. 1999 Mar 1;19(5):1610-9.
doi: 10.1523/JNEUROSCI.19-05-01610.1999.

Functional consequences of mutations in the human alpha1A calcium channel subunit linked to familial hemiplegic migraine

Affiliations

Functional consequences of mutations in the human alpha1A calcium channel subunit linked to familial hemiplegic migraine

M Hans et al. J Neurosci. .

Abstract

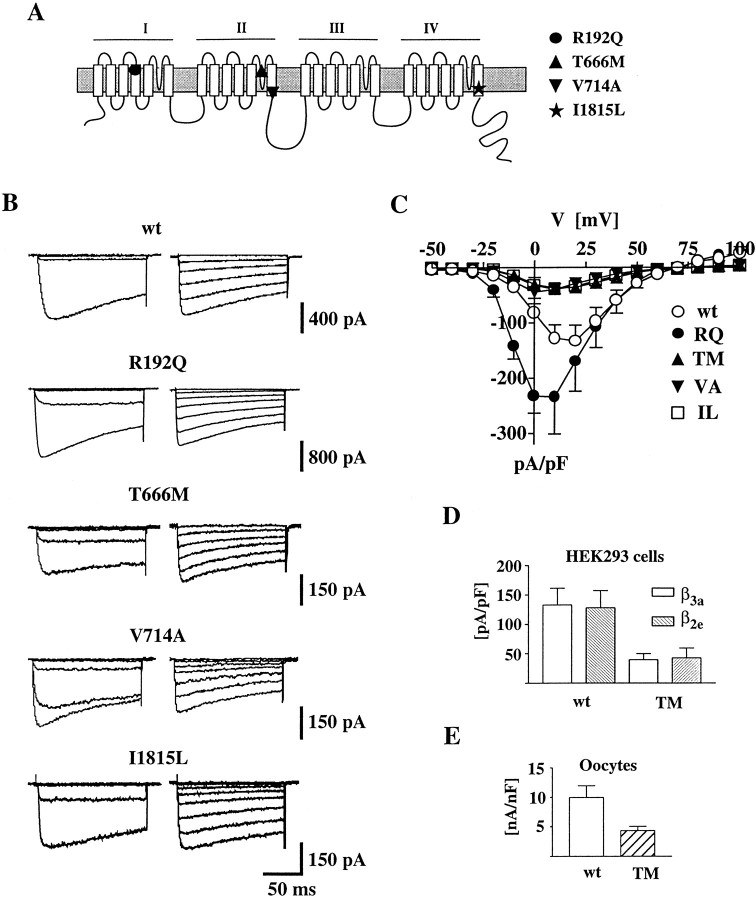
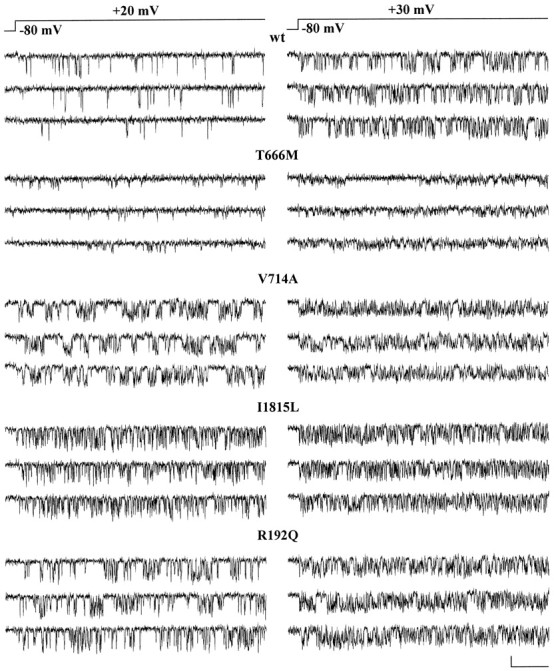
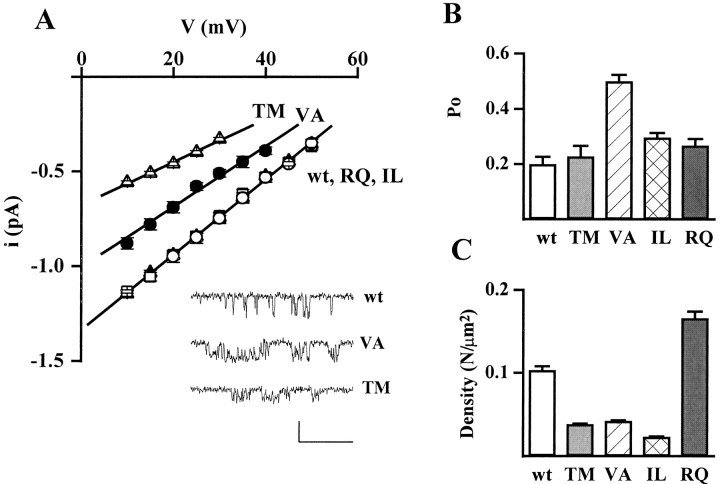
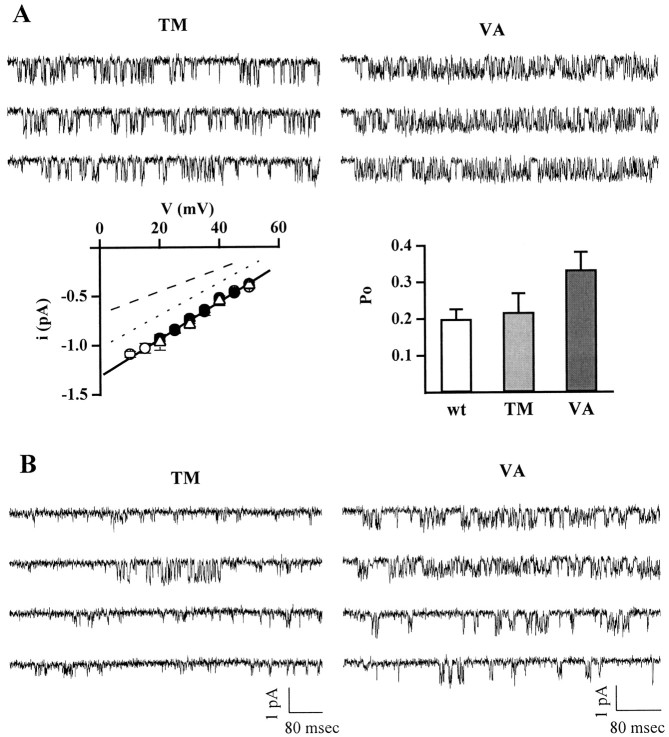
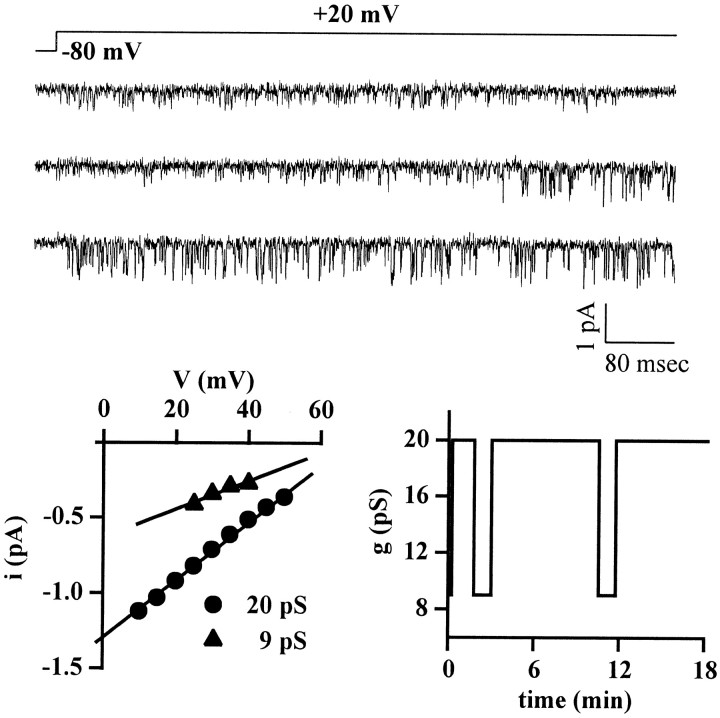
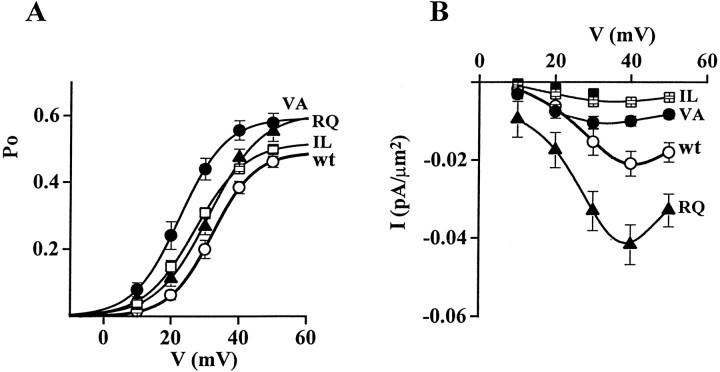
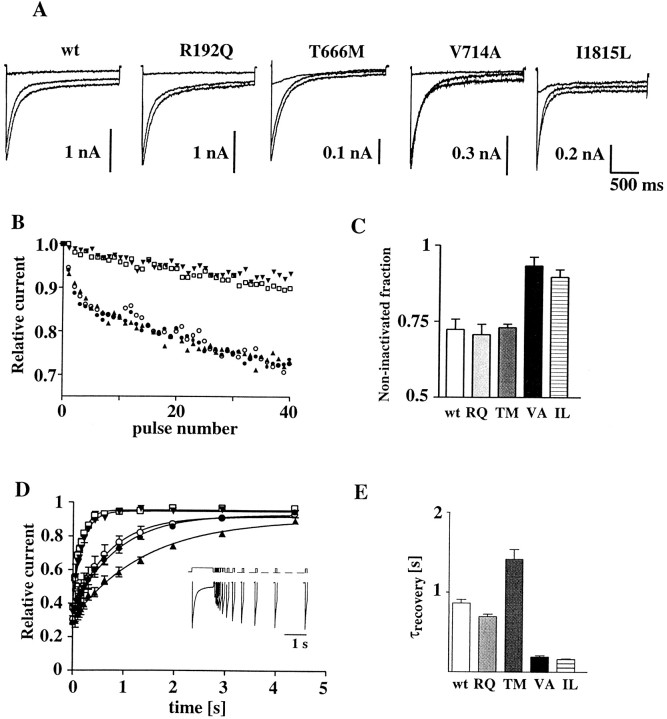
Mutations in alpha1A, the pore-forming subunit of P/Q-type calcium channels, are linked to several human diseases, including familial hemiplegic migraine (FHM). We introduced the four missense mutations linked to FHM into human alpha1A-2 subunits and investigated their functional consequences after expression in human embryonic kidney 293 cells. By combining single-channel and whole-cell patch-clamp recordings, we show that all four mutations affect both the biophysical properties and the density of functional channels. Mutation R192Q in the S4 segment of domain I increased the density of functional P/Q-type channels and their open probability. Mutation T666M in the pore loop of domain II decreased both the density of functional channels and their unitary conductance (from 20 to 11 pS). Mutations V714A and I1815L in the S6 segments of domains II and IV shifted the voltage range of activation toward more negative voltages, increased both the open probability and the rate of recovery from inactivation, and decreased the density of functional channels. Mutation V714A decreased the single-channel conductance to 16 pS. Strikingly, the reduction in single-channel conductance induced by mutations T666M and V714A was not observed in some patches or periods of activity, suggesting that the abnormal channel may switch on and off, perhaps depending on some unknown factor. Our data show that the FHM mutations can lead to both gain- and loss-of-function of human P/Q-type calcium channels.


Figures

Fig. 1.
Fig. 1.
Whole-cell current of human recombinant calcium channels containing wt or mutant α1A subunits. Whole-cell patch-clamp recordings with 15 mm Ba2+ as charge carrier from HEK293 cells transiently expressing calcium channels containing the wt human α1A-2 or human α1A-2R192Q, α1A-2T666M, α1A-2V714A, or α1A-2I1815L subunits together with the α2bδ and β3a subunits. Step depolarizations were delivered from a holding potential of −90 mV. The recordings were obtained from cells incubated at 28°C for 48–72 hr. A, Proposed secondary structure of Ca2+ channel α1 subunits with the approximate positions of the four FHM mutations indicated by differentsymbols. B, Representative families of Ba2+ currents elicited by step depolarizations between −50 and 0 mV (left panels) and +10 and +80 mV (right panels) in 10 mV increments. C, Voltage dependence of whole-cell current density for wt and mutant channels. The current density values, obtained by dividing current amplitudes and cell capacitance, are averages from 80, 25, 58, 62, and 55 cells for wt, RQ, TM, VA, and IL, respectively. D, Comparison of the average whole-cell current density at +10 mV measured in HEK293 cells transiently expressing calcium channels containing the wt human α1A-2 or human α1A-2TM subunit with the α2bδ and either the β3a or the β2e subunits. The current density values are averages from 80 and 16 cells expressing wt α1A-2 with β3a and β2e subunits, respectively, and from 58 and 5 cells expressing α1A-2TM with β3a and β2e subunits, respectively. With both β subunits, the difference in current density between wt and TM was statistically significant (p < 0.01).E, Comparison of the average whole-cell current density at +10 mV measured in Xenopus oocytes expressing calcium channels containing the wt α1A-2 or α1A-2TM subunit with the α2bδ and the β3asubunits. The current density values are averages from 10 and 8 oocytes expressing wt α1A-2 and α1A-2TM subunits, respectively. The difference was statistically significant (p < 0.01).
Fig. 2.
Fig. 2.
Single-channel activity of human recombinant calcium channels containing wt or mutant α1A subunits. Cell-attached patch-clamp recordings, with 90 mm Ba2+ as charge carrier, from HEK293 cells transiently expressing calcium channels containing the wt human α1A-2 or human α1A-2TM, α1A-2VA, α1A-2IL, or α1A-2RQ subunits together with the α2bδ and β2esubunits. Three representative current traces at +20 and +30 mV from single-channel patches on cells expressing calcium channels containing wt human α1A-2 (cell X24A), mutant human α1A-2TM (cell X29D), α1A-2VA (cell X35D), α1A-2IL (cell X51D), or α1A-2RQ subunit (cell X51C) are shown. Calibration: 80 msec, 0.5 pA. Depolarizations were delivered every 4 sec from a holding potential of −80 mV. The recordings were obtained from cells incubated at 28°C for 12–48 hr.
Fig. 3.
Fig. 3.
Effect of FHM mutations on single-channel current and conductance, open probability, and density of functional channels. Cell-attached patch-clamp recordings as in Figure 2. A, Unitary current–voltage,i–v, relationships of calcium channels containing wt and mutant human α1A-2 subunits. Unitary current values of wt (○), TM (▵), VA (•), IL (■), and RQ (▴) channels are averages from 8, 7, 9, 8, and 14 patches, respectively. For each patch, values of i at a given voltage are averages of many measurements on well resolved openings (compare insetshowing unitary activity at +20 mV on an expanded time scale; calibration: 40 msec, 1 pA). The values of i refer to the prevailing larger current level shown in the inset, which was much more frequently occupied with respect to other short-lived subconductance levels (particularly present in the VA mutant). The slope conductances of the average i–vrelationships are 20 pS for wt, IL, and RQ; 16 pS for VA; and 11 pS for TM. B, Open probability,po, at +30 mV of calcium channels containing wt and mutant human α1A-2 subunits. Averagepo values were obtained from the same patches from which the average i–v relationships were derived (n = 8, 7, 9, 8, and 14 patches for wt, TM, VA, IL, and RQ, respectively). The very similar average values of i for wt, RQ, and IL assure that the relatively small difference between the averagepo values of the three channels are not caused by any artifactual difference of voltage across the patches. All the patches contained only one channel. For each patch,po values were obtained by averaging the open probabilities measured in each sweep in segments with activity (n = 10–180). Statistical significance of differences with respect to wt: p ≪ 0.0001 for VA;p < 0.01 for IL; and p < 0.08 for RQ. C, Density of functional calcium channels containing wt and mutant human α1A-2 subunits. The density of functional channels was calculated from the average number of channel per patch and the average patch area in 144, 299, 192, 73, and 193 cell-attached patches on cells transfected with wt, TM, IL, RQ, and VA subunits, respectively. The average number of channel per patch in cells transfected with wt, TM, IL, RQ, and VA subunits was 0.98, 0.40, 0.30, 1.45, and 0.47, respectively. The corresponding average pipette resistance was 1.59 ± 0.09, 1.35 ± 0.05, 1.04 ± 0.03, 1.68 ± 0.08, and 1.29 ± 0.04 MΩ, respectively.
Fig. 4.
Fig. 4.
Calcium channels containing human α1ATM and α1AVA subunits can be in a state with unitary current and conductance identical to wt. Cell-attached patch-clamp recordings from HEK293 cells transiently expressing calcium channels containing the human α1A-2TM or α1A-2VA subunits, together with the α2bδ and β2e subunits. Experimental conditions and protocol as in Figure 2. All recordings are from patches containing only one channel. A, Single-channel current traces at +30 mV of calcium channels containing the human α1A-2TM (cell X19E) and α1A-2VA (cell X44A) subunits, from patches in which the mutants had unitary current and conductance identical to wt, are shown together with their average current–voltage relationships (TM, ▵, n = 3; VA, ○, n = 8) and open probability at +30 mV (TM, n = 5; VA,n = 8). For comparison, the average current–voltage relationships (•, n = 8) and the open probability at +30 mV (n = 8) of wt channels are also shown. The dotted and dashed lines in the left panel are the lines best fitting the i–v relationships of the majority of VA and TM mutants, with conductance of 16 and 11 pS, respectively (compare Fig. 3). Calibration for traces as in B.B, Left, Consecutive single-channel current traces at +20 mV from a patch containing a single TM channel with the prevailing 11 pS conductance, showing a rare example of a transition from the lower conductance to the larger conductance state: cell X19A. Right, Representative current traces at +20 mV from a patch containing a single VA channel with the prevailing 16 pS conductance (top two traces), which shifted to the 20 pS conductance state (bottom two traces) during the recording: cell X37A. The transition from the low conductance to the wt conductance was observed only in one of nine single-channel patches.
Fig. 5.
Fig. 5.
Calcium channels containing the human α1AIL subunit can be in a state with unitary current and conductance smaller than wt. Cell-attached patch-clamp recordings from a HEK293 cell (cell X25A) transiently expressing calcium channels containing the human α1A-2IL subunit together with the α2bδ and β2e subunits. Experimental conditions and protocol as in Figure 2. The patch contained only one channel, which alternated between a prevailing state with unitary current and conductance identical to wt and a state with lower current and conductance. Single-channel current traces, showing a transition from the low conductance state to the state with wt conductance, are displayed together with the current–voltage relationships in the two states (left panel), and the time course with which the channel changed between the two states during the recording (right panel).
Fig. 6.
Fig. 6.
Activation curves of human recombinant calcium channels containing wt or mutant α1A subunits. Cell-attached patch-clamp recordings as in Figure 2 from patches containing only one channel. A, Voltage dependence of the open probability, po, of single calcium channels containing wt or mutant α1A-2 subunits. The curves were obtained by averaging at each voltage the values ofpo measured in different single-channel patches: n = 8 for wt (○), n= 16 for VA (•), n = 6 for IL (■), andn = 14 for RQ (▴). The VA curve was obtained by combining the activation curves of mutant channels with 16 pS conductance (n = 8) and 20 pS conductance (n = 8), according to the relative fraction of channels with low (67%) and high (33%) conductance. The data points were fitted by Boltzmann distributions of the formpo = po,max × (1 + exp (− (VV1/2)/k)) withV1/2 = 32.1 mV, k = 6.2,po,max = 0.489 for wt;V1/2 = 23, k = 6.8,po,max = 0.592 for VA;V1/2 = 27.1, k = 7.3,po,max = 0.518 for IL; andV1/2 = 31.2, k = 7.6,po,max = 0.605 for RQ. The parameters of the Boltzmann distribution functions fitting the average activation curve of VA mutants with 16 and 20 pS conductance wereV1/2 = 20.3 and 28.3 mV,k = 5.8 and 7.6, andpo,max = 0.583 and 0.626, respectively. For the TM mutant, average values of po at +10 mV (0.019 ± 0.005, n = 5), +20 mV (0.089 ± 0.010, n = 5), and +30 mV (0.200 ± 0.014,n = 7) were not significantly different from wt (data not shown). B, Voltage dependence of macroscopic current density obtained from the single-channel data by multiplying the channel density and the unitary current, i, and open probability, po, at each voltage. Symbols: wt (○), VA (•), IL (■), RQ (▴), and TM (▪). The VA and TM data points were obtained by combining the values ofi and po of channels with low and high conductance, according to the relative fractions (11 and 89% for TM, 33 and 67% for VA).
Fig. 7.
Fig. 7.
Inactivation properties of human recombinant calcium channels containing wt or mutant α1Asubunits. Whole-cell patch-clamp recordings with 15 mm Ba2+ as charge carrier from HEK293 cells transiently expressing calcium channels containing the wt human α1A-2or human α1A-2RQ, α1A-2TM, α1A-2VA, or α1A-2IL subunits together with the α2bδ and β3a subunits.A, Example Ba2+ current traces elicited by 2 sec step depolarizations to −10, 0, and +10 mV from a holding potential of −90 mV. The average time constants for current inactivation at +10 mV, τ1 and τ2, obtained by fitting the current traces to a biexponential function of the form I = A0 + A1exp(−t/τ1) + A2exp(−t/τ2), were 58.1 ± 16.6 and 540 ± 47 msec for wt (n = 7), 51.0 ± 9.2 and 423 ± 63 msec for RQ (n = 6), 62.6 ± 7.1 and 402 ± 54 msec for TM (n= 6), 43.6 ± 20.0 and 472 ± 84 msec for VA (n = 5), and 65.2 ± 16 and 304 ± 55 msec for IL (n = 7). The average fraction of current associated with the fast component was 76 ± 6, 75 ± 4, 62 ± 3, 76 ± 4, and 46 ± 8% for wt, RQ, TM, VA, and IL, respectively. The average fraction of current remaining at the end of a 2 sec depolarization to +10 mV was 8 ± 3, 7 ± 1, 13 ± 2, 12 ± 2, and 20 ± 5% for wt, RQ, TM, VA, and IL, respectively. B, Representative time course of inactivation of wt and mutant channels during a series of 40-msec-long step depolarizations to +10 mV at 3 Hz. Holding potential was −90 mV. The data points represent peak currents in each consecutive depolarization, expressed asI(n)/I(n = 1). Symbols: wt (○), RQ (•), TM (▴), VA (▾), and IL (■). C, Fraction of noninactivated current at the end of 40 step depolarizations to +10 mV. Mutations VA and IL are significantly different from wt (p < 0.01).D, Time course of recovery from inactivation after a 1 sec step depolarization to +10 mV. Lines through the data points represent single exponential best fits. The average time constants of recovery from inactivation for wt and the mutants are shown in E. Recovery from inactivation was measured using the double-pulse protocol shown in the inset, in which a 50 msec long test depolarization at +10 mV was applied at variable times after the 1 sec depolarization at the same voltage. Representative current traces recorded from wt using this voltage protocol are also shown in the inset. Holding potential was −90 mV. E, Time constant of recovery from inactivation. The time constants for VA, IL, and TM are significantly different from wt (p < 0.001).

References

    1. Armstrong CM, Hille B. Voltage-gated ion channels and electrical excitability. Neuron. 1998;20:371–380. - PubMed
    1. Brust PF, Simerson S, McCue AF, Deal CR, Schoonmaker S, Williams ME, Velicelebi G, Johnson EC, Harpold MM, Ellis SB. Human neuronal voltage-dependent calcium channels: studies on subunit structure and role in channel assembly. Neuropharmacology. 1993;32:1089–102. - PubMed
    1. Cannon SC. Sodium channel defects in myotonia and periodic paralysis. Annu Rev Neurosci. 1996;19:141–164. - PubMed
    1. Diriong S, Lory P, Williams ME, Ellis SB, Harpold MM, Taviaux S. Chromosomal localization of the human genes for α1A, α1B, and α1E voltage-dependent Ca2+ channel subunits. Genomics. 1995;30:605–609. - PubMed
    1. Dove LS, Abbott LC, Griffith WH. Whole-cell and single-channel analysis of P-type calcium current in cerebellar Purkinje cells of leaner mutant mice. J Neurosci. 1998;18:7687–7699. - PMC - PubMed

Publication types

MeSH terms

Grants and funding

LinkOut - more resources