. 1999 Mar 1;19(5):1736-53.
doi: 10.1523/JNEUROSCI.19-05-01736.1999.

Competitive mechanisms subserve attention in macaque areas V2 and V4

Affiliations

Competitive mechanisms subserve attention in macaque areas V2 and V4

J H Reynolds et al. J Neurosci. .

Abstract

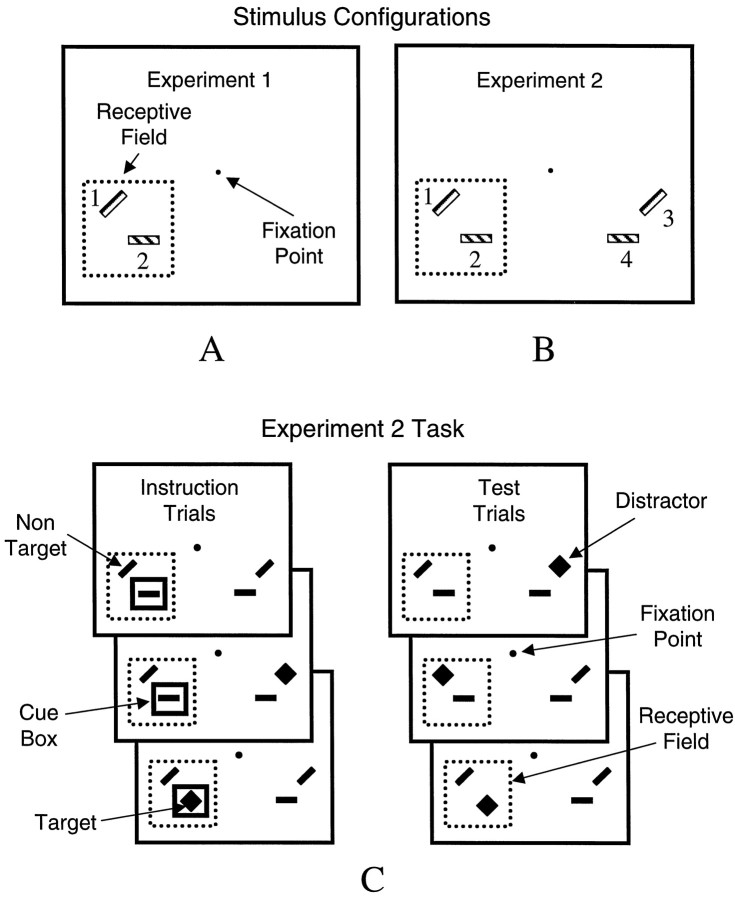
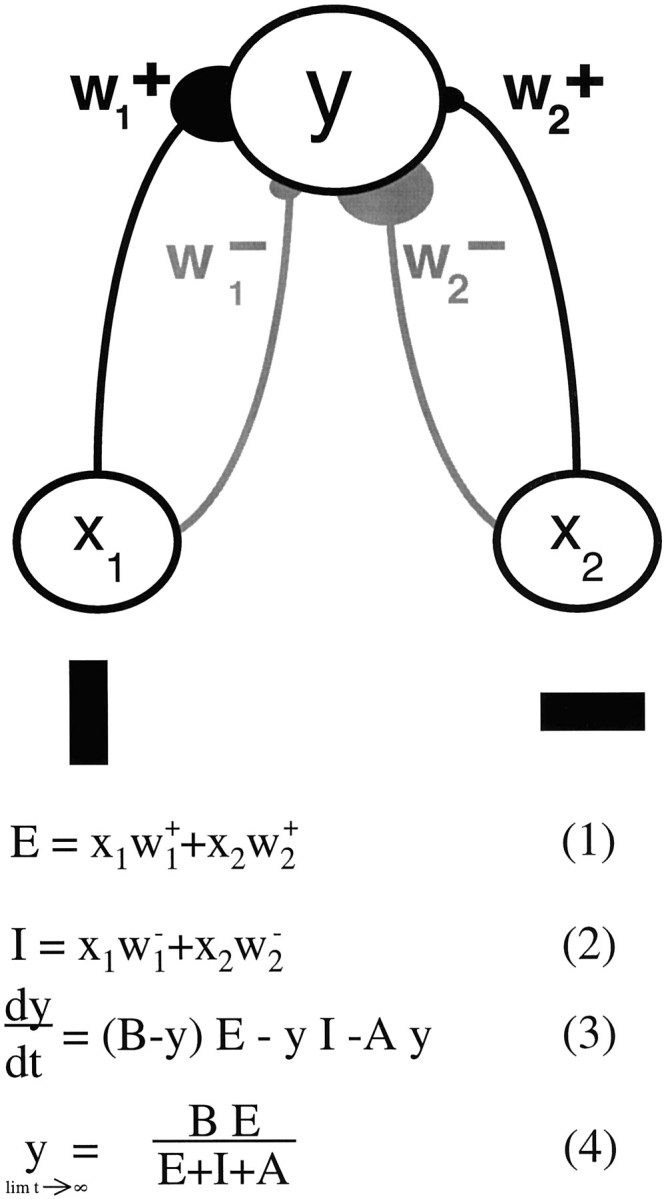
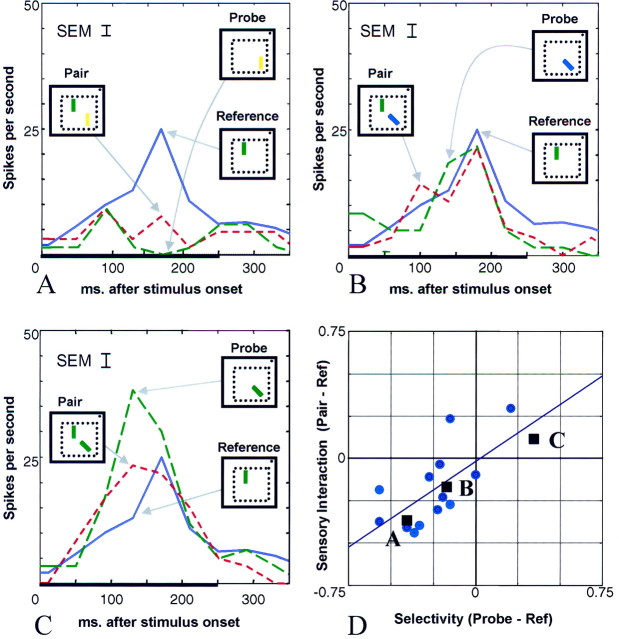
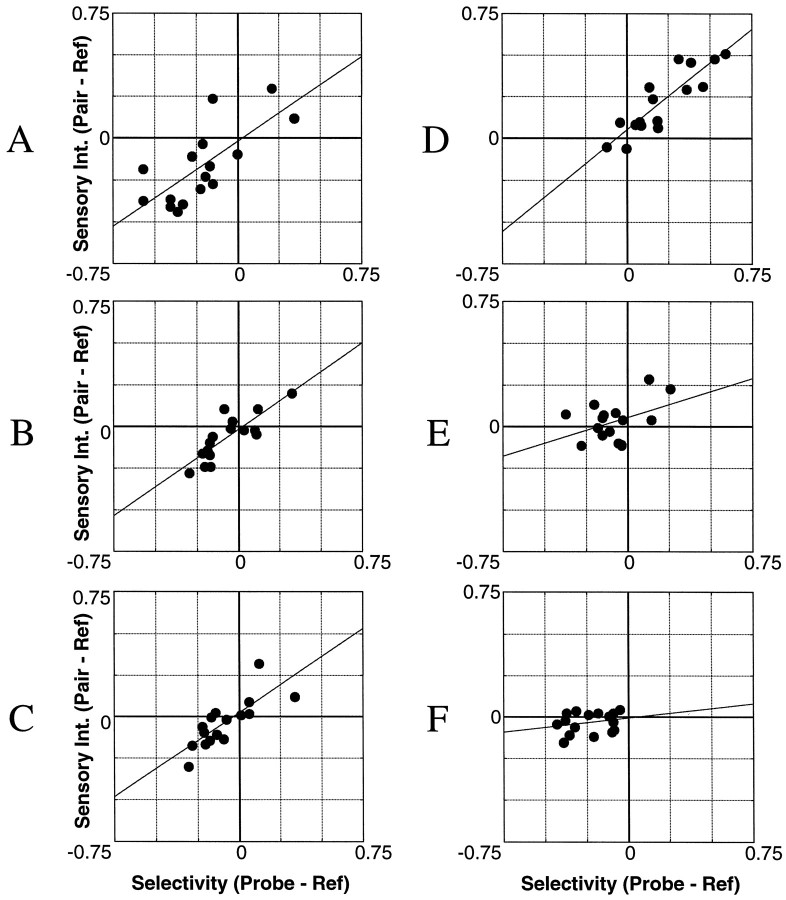
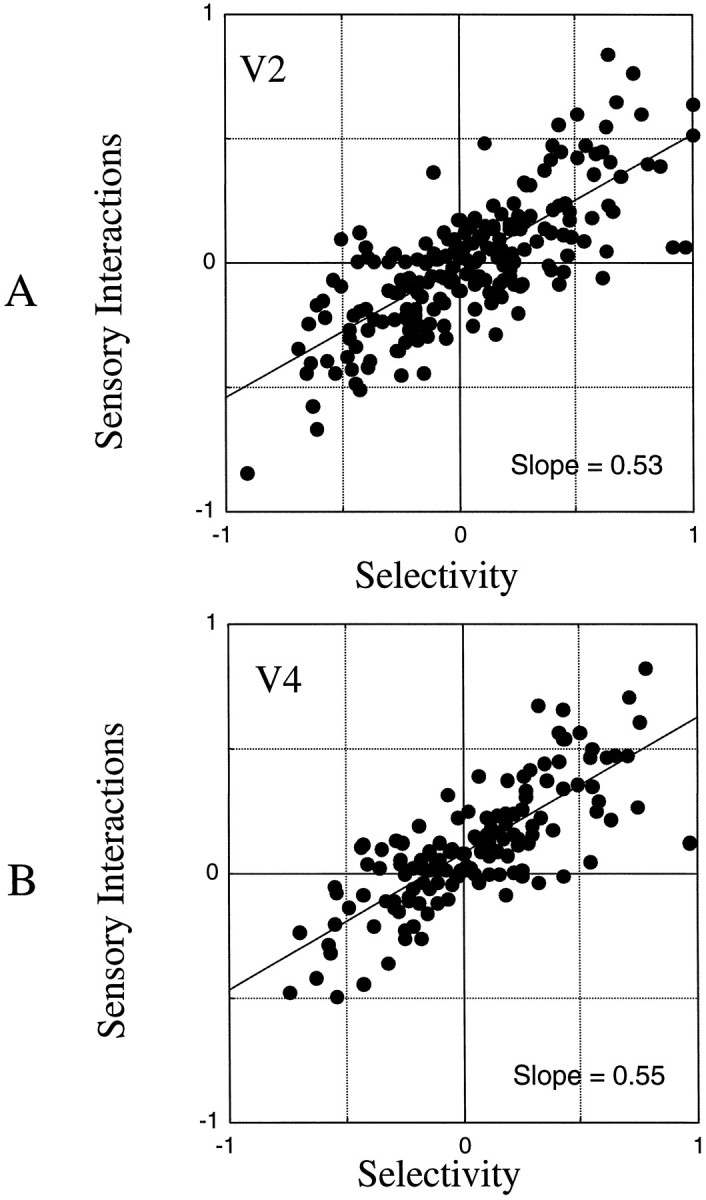
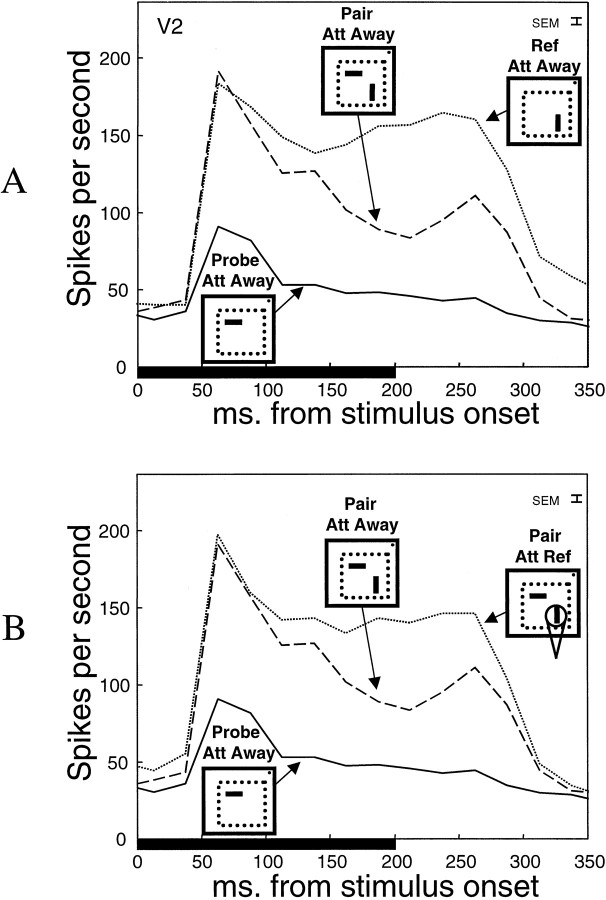
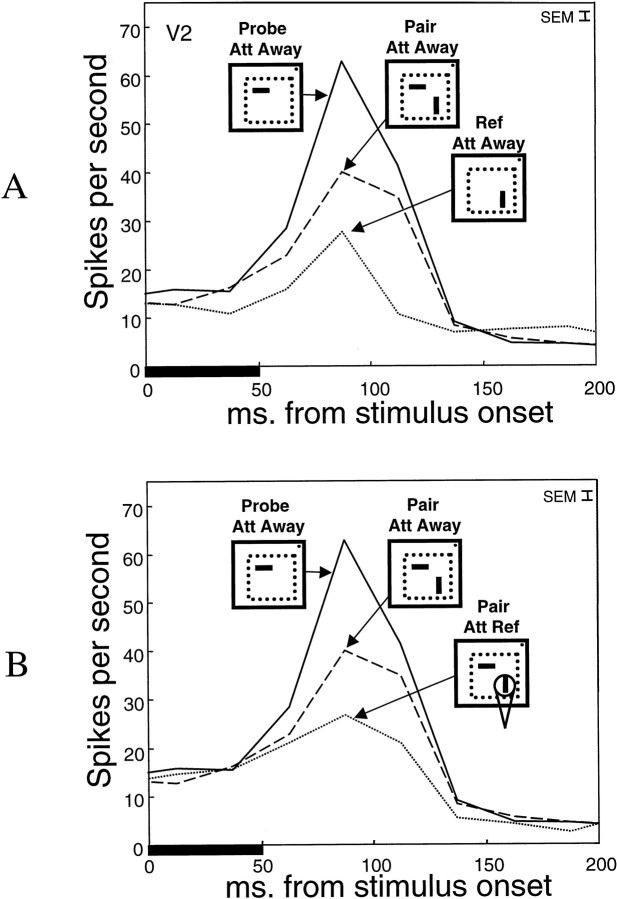
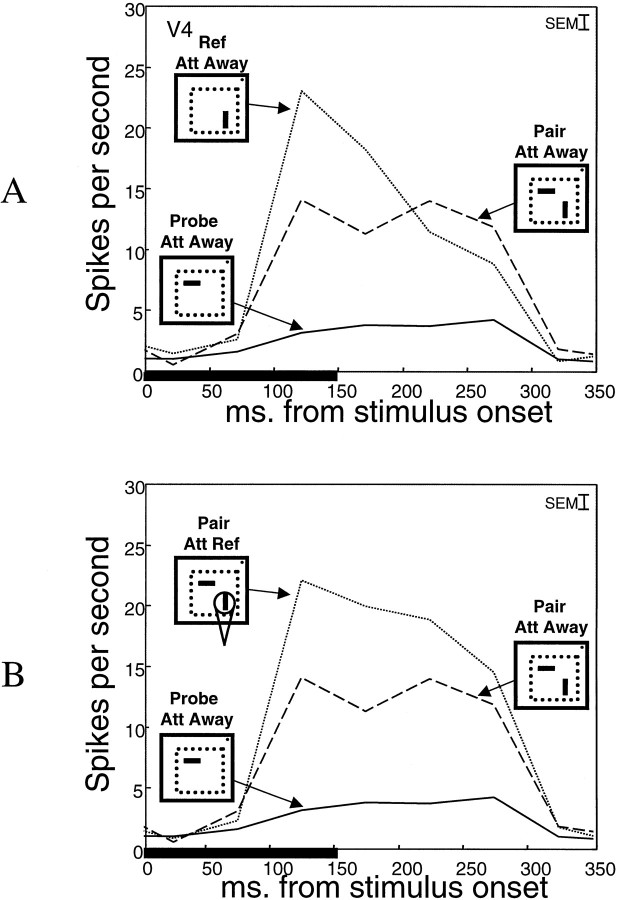
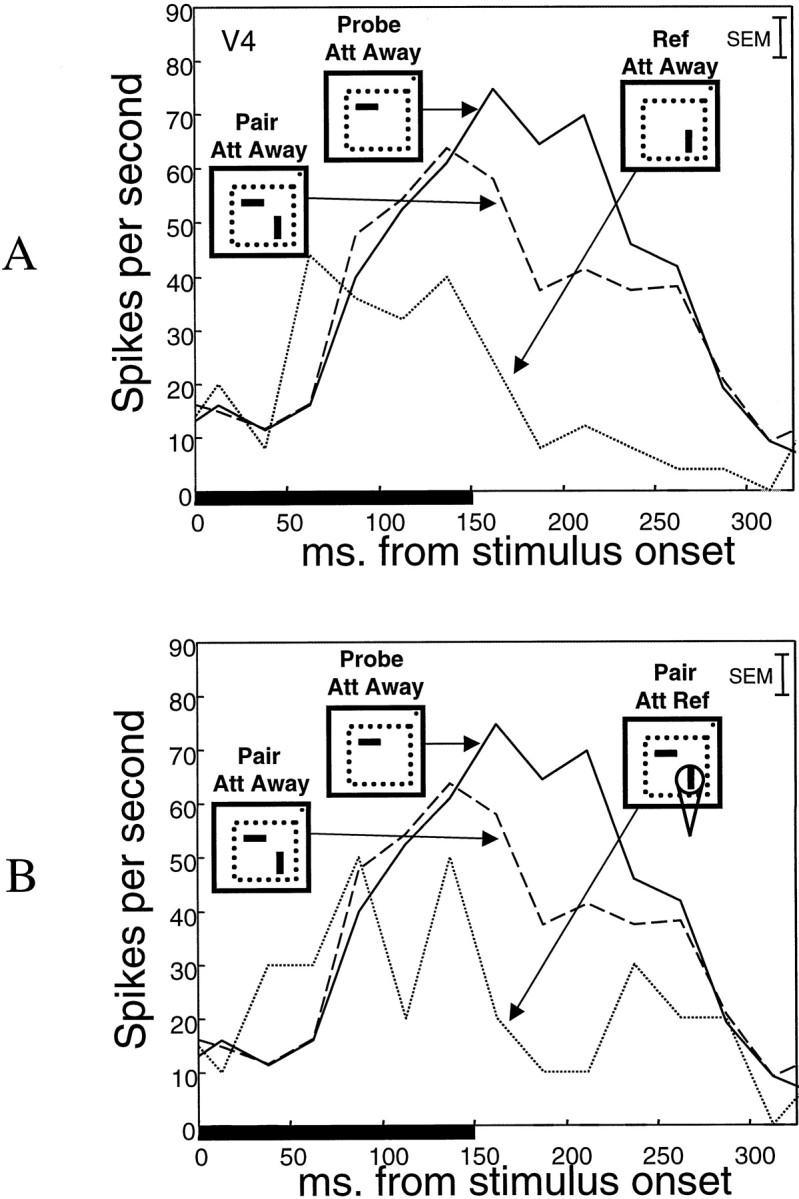
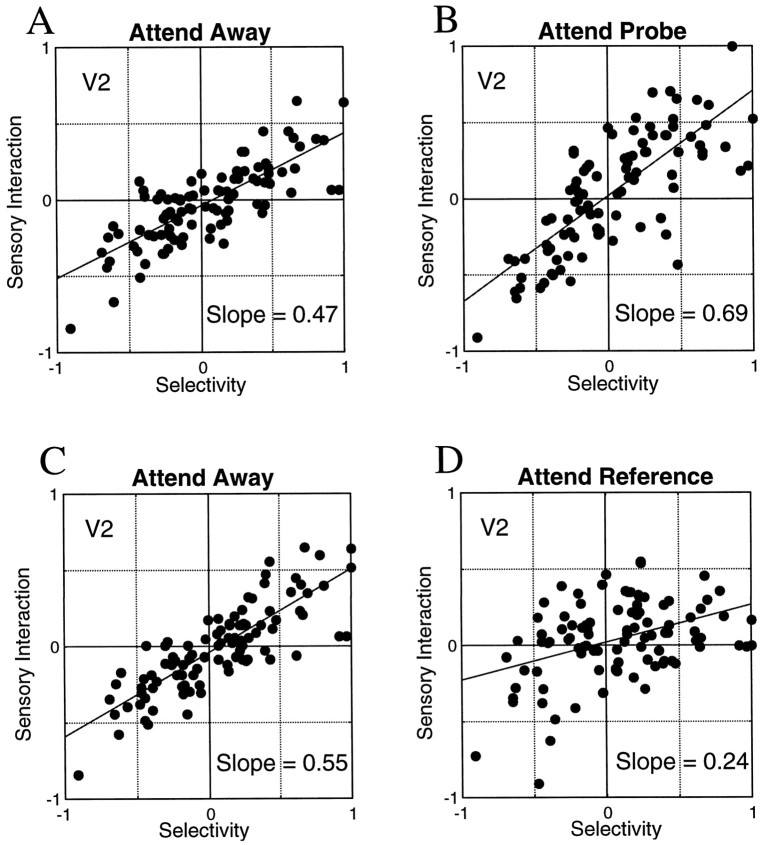
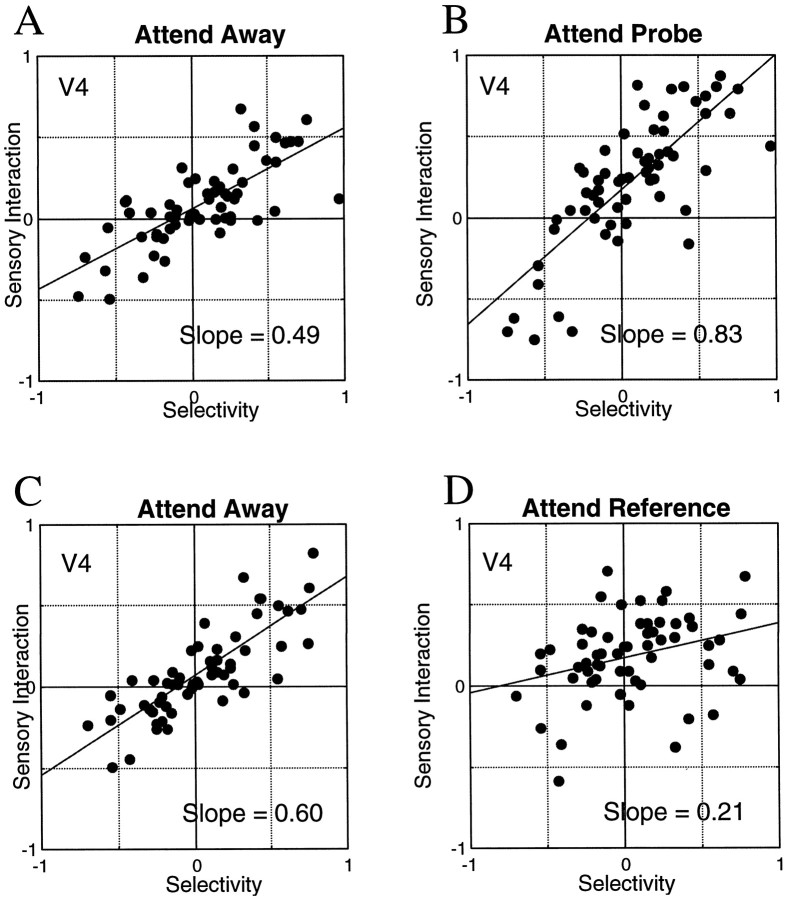
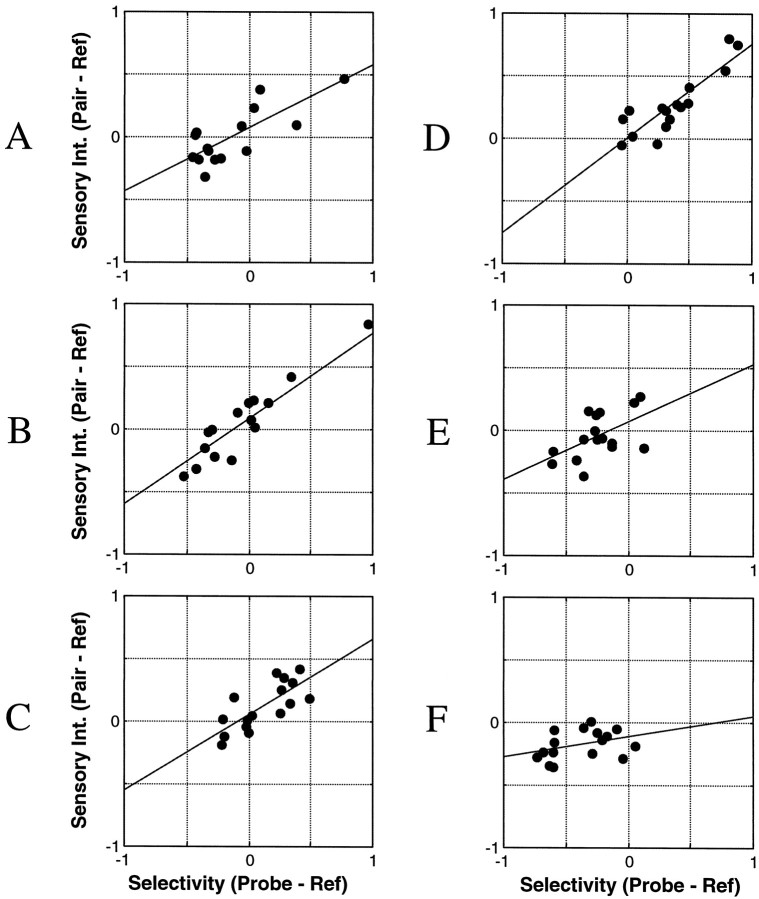
It is well established that attention modulates visual processing in extrastriate cortex. However, the underlying neural mechanisms are unknown. A consistent observation is that attention has its greatest impact on neuronal responses when multiple stimuli appear together within a cell's receptive field. One way to explain this is to assume that multiple stimuli activate competing populations of neurons and that attention biases this competition in favor of the attended stimulus. In the absence of competing stimuli, there is no competition to be resolved. Accordingly, attention has a more limited effect on the neuronal response to a single stimulus. To test this interpretation, we measured the responses of neurons in macaque areas V2 and V4 using a behavioral paradigm that allowed us to isolate automatic sensory processing mechanisms from attentional effects. First, we measured each cell's response to a single stimulus presented alone inside the receptive field or paired with a second receptive field stimulus, while the monkey attended to a location outside the receptive field. Adding the second stimulus typically caused the neuron's response to move toward the response that was elicited by the second stimulus alone. Then, we directed the monkey's attention to one element of the pair. This drove the neuron's response toward the response elicited when the attended stimulus appeared alone. These findings are consistent with the idea that attention biases competitive interactions among neurons, causing them to respond primarily to the attended stimulus. A quantitative neural model of attention is proposed to account for these results.


Figures

Fig. 1.
Fig. 1.
Stimulus configurations, Experiments 1 and 2, and task, Experiment 2. A, In Experiment 1, stimuli could appear at two locations within the receptive field (indicated by thedotted outline). On a given trial, either (1) the reference stimulus appeared at position 1, (2) a probe stimulus appeared once at position 2, or (3) the reference appeared at position 1 and a probe appeared at position 2. B, In Experiment 2, stimuli could appear at four positions: two within the receptive field and two across the vertical meridian. In the attend-away condition, the monkey attended to one of the stimuli across the midline from the receptive field. On each trial, the reference, the probe, or the pair appeared within the receptive field. In the attend-receptive-field-stimulus condition, stimuli appeared at all four positions, and the monkey attended to the reference or probe stimulus within the receptive field. C, Examples of stimulus sequences. The monkey’s task was to respond when a diamond-shaped target appeared at the attended location, while ignoring distractor targets, which occasionally appeared at the other locations. From trial to trial, the length of the stimulus sequence varied at random, so the monkey never knew when the target would appear. At the beginning of a block of trials, there were a few instruction trials, in which a bright cue box appeared at the location to be attended. After the monkey was reliably responding to the targets appearing at the cued location and ignoring distractors appearing at other locations, the cue was removed, and the task continued in the absence of the cue. From block to block, the monkey was recued to attend to a different location.
Fig. 2.
Fig. 2.
Model circuit diagram. The circleon top represents the neuron being recorded. The variable y is the firing rate of this neuron. Thetwo circles at the bottom of thediagram represent populations of “input” neurons that respond to the reference (left) and probe (right) stimuli and that project to the measured cell. The average response of the ith input population is designated xi. Black linesindicate the excitatory projections from each input population to the measured cell, and gray lines indicate the inhibitory projections, which are assumed to depend on inhibitory interneurons (not shown). The variablewi+ is the magnitude, or weight, of the excitatory projection from theith input population, andwi is the weight of the inhibitory projection from the ith input population. For a complete description of the model, see Materials and Methods.
Fig. 3.
Fig. 3.
Single cell, Experiment 1. A–C, The response of a single V4 neuron to the reference, a probe, and the corresponding pair is shown in each panel. Stimulus conditions are indicated by the square icons inA–C. The receptive field is indicated by thedotted outline in each icon. The dot in the top right corner of each icon represents the fixation point. The x-axis shows time (in milliseconds) from stimulus onset, and the thick horizontal barindicates stimulus duration. The vertical bar in theupper left corner shows the SEM of the response of this neuron, averaged over the three stimulus conditions for eachpanel. The blue line that is constant across all three panels shows the response to the reference stimulus, which was a vertical green bar. The response to the reference stimulus averaged over the defined time window (70–320 msec after stimulus onset) was 11.75 spikes/sec.A, The green line indicates the response to a vertical yellow probe that drove the cell at a low average rate (4.51 spikes/sec). The response to the pair, indicated by a red line, was strongly suppressed by the probe stimulus (5.31 spikes/sec). B, A 45° blue bar probe, which elicited a response that was slightly smaller than the response to the reference stimulus (mean response, 8.76 spikes/sec), caused a smaller suppression in the cell’s response (mean pair response, 8.82 spikes/sec). C, A 45° green bar probe, which elicited a response that was larger than the response to the reference (mean response, 17.80 spikes/sec), increased the cell’s response (mean response to pair, 13.81 spikes/sec).D, Indices of selectivity (x-axis) and sensory interaction (y-axis) for all 16 probe stimuli are shown. The indices corresponding to each of the probes illustrated in AC are indicated bysquares and are labeled in D. A negative selectivity index (indicating that the response to the probe was less than the response to the reference stimulus) was typically paired with a negative sensory interaction index (indicating that the addition of the poor probe suppressed the response of the cell). Nonselective reference–probe pairs showed little or no sensory interactions. Preferred probes increased the response to the reference stimulus.Ref, Reference stimulus.
Fig. 4.
Fig. 4.
Six representative neurons, Experiment 1.A–F, The correlation between selectivity and sensory interactions, across 16 probes, for one cell. A, The same cell that appeared in Figure 3 shown for comparison.B–D, Cells whose responses to pairs showed a greater degree of probe control (slope > 0.5). E,F, Cells for which the reference was the dominant stimulus (slope < 0.5). In all cases, probe–reference pairs for which the cell was nonselective showed little or no sensory interactions.
Fig. 5.
Fig. 5.
Relationship between selectivity and sensory interactions recorded in Experiment 2, with attention directed away from the receptive field. A, B, Data from cells in V2 and V4, respectively. Each point corresponds to the indices of selectivity and sensory interaction computed for a given reference–probe pair. Responses were computed using a time window from 120 to 270 msec after stimulus onset. Cells tested with more than one reference–probe pair appear more than once in the figure. Consistent with the results of Experiment 1, a strong positive correlation between selectivity and sensory interactions, in both cortical areas, was found. Both best-fit lines passed close to the origin (−0.01 and 0.08), indicating that adding the second stimulus had little effect on the pair response that was not accounted for by selectivity. Slopes were not significantly different from 0.5, indicating that, across both populations, the reference and probes exerted approximately equivalent control over responses to pairs (slopes, 0.53 and 0.55).
Fig. 6.
Fig. 6.
Attention filtering out the effect of a suppressive probe in V2. A, B, Thex-axis shows time (in milliseconds) from stimulus onset, and the thick horizontal bar indicates stimulus duration. The y-axis shows instantaneous firing rate. The vertical bar in the upper right corner shows the SEM response for this neuron, averaged across experimental conditions. A, Responses when attention was directed away from the receptive field are shown. Small iconic figures illustrate sensory conditions. Within each icon, the dotted line indicates the receptive field, and the small dot represents the fixation point. In this and subsequent figures, we indicate the reference stimulus by avertical bar and the probe by a horizontal bar. In fact, the identity of both stimuli varied from cell to cell. The dotted line shows the response to the reference stimulus. The solid line shows the response elicited by the probe. The response to the pair (dashed line) was suppressed by the addition of the probe.B, The upper, dotted line shows the pair response when attention (indicated by thecone symbol) was directed to the reference stimulus. The responses to the unattended probe (solid line) and pair (dashed line), taken fromA, are repeated for comparison. Attention to the reference stimulus caused the cell’s response to move upward, toward the response that was elicited by the unattended reference stimulus presented alone (dotted line in A).Att Away, Attend away; Att Ref, attend reference.
Fig. 7.
Fig. 7.
Attention filtering out the effect of an enhancing probe in V2. The format is identical to that in Figure 6.A, With attention directed away from the receptive field, this cell gave a moderate response to the reference stimulus (dotted line). The response elicited by the probe (solid line) was much higher, and the addition of the probe drove up the response to the pair (dashed line).B, When attention was directed to the reference stimulus, the pair response (dotted line) was reduced to a level comparable with the response to the unattended reference stimulus (dotted line in A). The response to the unattended pair (dashed line) and the probe (solid line) are repeated from A for comparison.
Fig. 8.
Fig. 8.
Attention filtering out the effect of a suppressive probe in V4. The format is identical to that in Figure 6.A, With attention directed away, the response to the reference stimulus (dotted line) was suppressed (response to pair, dashed line) by the addition of the probe (response to probe, solid line). B, Attention to the reference stimulus drove the pair response (dotted line) toward the response elicited by the unattended reference stimulus presented alone (dotted line in A).
Fig. 9.
Fig. 9.
Attention filtering out the effect of an enhancing probe in V4. The format is identical to that in Figure 6.A, With attention directed away from the receptive field, the moderate response to the reference stimulus (dotted line) was increased (response to pair, dashed line) by the addition of the probe (response to probe,solid line). B, This increase was diminished when attention was directed to the reference stimulus (response to pair, with attention to reference stimulus, dotted line).
Fig. 10.
Fig. 10.
V2 neurons showing attention effects.A, The relationship of sensory interaction indices (y-axis) to selectivity indices (x-axis) when attention was directed away from the receptive field. All stimulus pairs were included that elicited a response that changed significantly (two-tailed t test,p < 0.05) when attention was directed to the probe stimulus. B, Same population that is shown inA. Directing attention to the probe stimulus caused the probe to have enhanced influence over the pair response, as reflected in the increased slope (slope, 0.69 vs 0.47 with attention directed away from the receptive field in A). C, The relationship of selectivity to sensory interaction indices when attention was directed away from the receptive field. All stimulus pairs were included that elicited a response that changed significantly (two-tailed t test, p < 0.05) when attention was directed to the reference stimulus. D, Same population that is shown in C. Directing attention to the reference stimulus caused the probe to have diminished influence over the pair response, as reflected in the decreased slope (slope, 0.24 vs 0.55 with attention directed away from the receptive field inC). Some cells were tested with more than one pair of stimuli, so some cells appear more than once. All responses were computed using a time window from 120 to 270 msec after stimulus onset.
Fig. 11.
Fig. 11.
V4 neurons showing attention effects.A, The relationship of sensory interaction indices (y-axis) to selectivity indices (x-axis) when attention was directed away from the receptive field. All stimulus pairs were included that elicited a response that changed significantly (two-tailed t test,p < 0.05) when attention was directed to the probe stimulus. B, Same population that is shown inA. Directing attention to the probe stimulus caused the probe to have enhanced influence over the pair response, as reflected in the increased slope (slope, 0.83 vs 0.49 with attention directed away from the receptive field in A). C, The relationship of selectivity to sensory interaction indices when attention was directed away from the receptive field. All stimulus pairs were included that elicited a response that changed significantly (two-tailed t test, p < 0.05) when attention was directed to the reference stimulus. D, Same population that is shown in C. Directing attention to the reference stimulus caused the probe to have diminished influence over the pair response, as reflected in the decreased slope (slope, 0.21 vs 0.60 with attention directed away from the receptive field inC). Some cells were tested with more than one pair of stimuli, so some cells appear more than once. All responses were computed using a time window from 120 to 270 msec after stimulus onset.
Fig. 12.
Fig. 12.
Model simulation of Experiment 1. Eachpanel (A–F) shows the relationship between sensory interactions (y-axis) and selectivity (x-axis) for a single model neuron tested with 16 probe stimuli. By varying only randomly selected excitatory and inhibitory weights, the model generates slopes that span the range observed in Experiment 1. Compare with Figure 4. Simulations are fully described in Materials and Methods.
Fig. 13.
Fig. 13.
Model simulation of Experiment 2.A, The sensory interaction and selectivity indices of 100 model neurons simulated with no attentional bias either to the probe or to the reference stimulus. Compare with Figures 10,A and C, and 11, A andC. B, The indices of the same 100 model neurons with an attentional bias added to the probe stimuli. Compare with Figures 10B and 11B.C, The same population of 100 model neurons with an attentional bias added to the reference stimulus. Compare with Figures10D and 11D. The magnitude and direction of changes in slope and vertical offset are comparable with those observed in Experiment 2. Simulations are fully described in Materials and Methods.

Similar articles

Cited by

References

    1. Anderson CH, Van Essen DC. Shifter circuits: a computational strategy for dynamic aspects of visual processing. Proc Natl Acad Sci USA. 1987;84:6297–6301. - PMC - PubMed
    1. Borisyuk RM, Borisyuk GN, Kazanovich YB. The synchronization principle in modelling of binding and attention. Membr Cell Biol. 1998;11:753–761. - PubMed
    1. Bushnell MC, Goldberg ME, Robinson DL. Behavioral enhancement of visual responses in monkey cerebral cortex. I. Modulation in posterior parietal cortex related to selective visual attention. J Neurophysiol. 1981;46:755–772. - PubMed
    1. Chelazzi L, Desimone R. Responses of V4 neurons during visual search. Soc Neurosci Abstr. 1994;20:1054.
    1. Connor CE, Gallant JL, Preddie DC, Van Essen DC. Responses in area V4 depend on the spatial relationship between stimulus and attention. J Neurophysiol. 1996;75:1306–1308. - PubMed

Publication types

LinkOut - more resources