. 1999 Mar 1;19(5):1782-803.
doi: 10.1523/JNEUROSCI.19-05-01782.1999.

Cerebellar Purkinje cell simple spike discharge encodes movement velocity in primates during visuomotor arm tracking

Affiliations

Cerebellar Purkinje cell simple spike discharge encodes movement velocity in primates during visuomotor arm tracking

J D Coltz et al. J Neurosci. .

Abstract

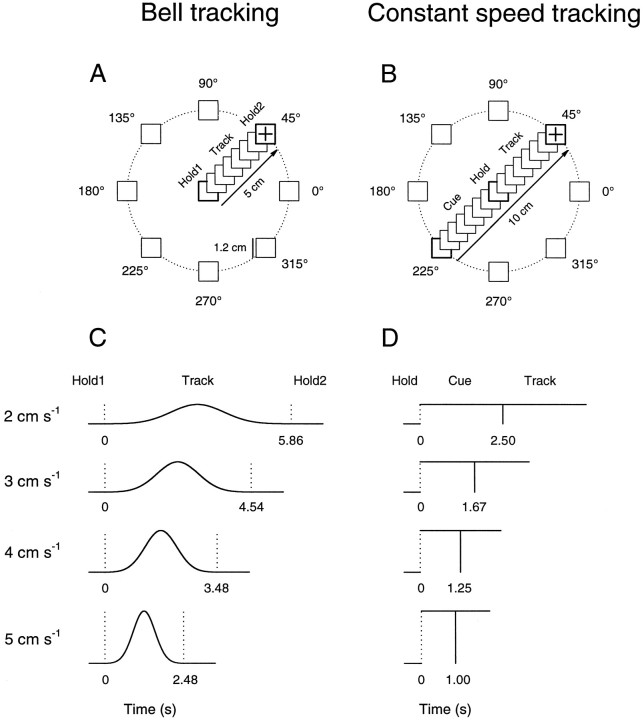
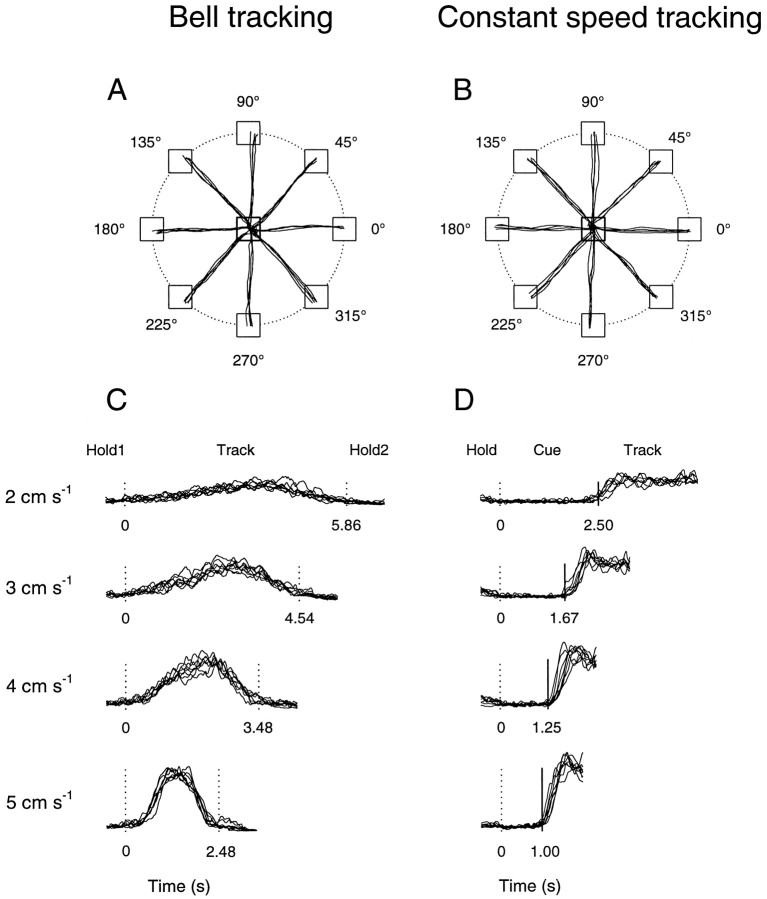
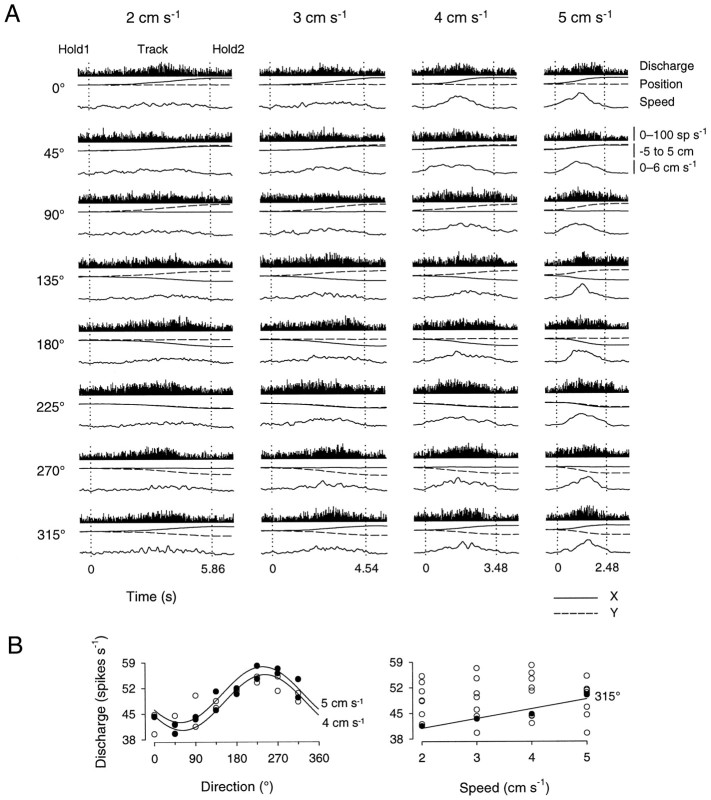
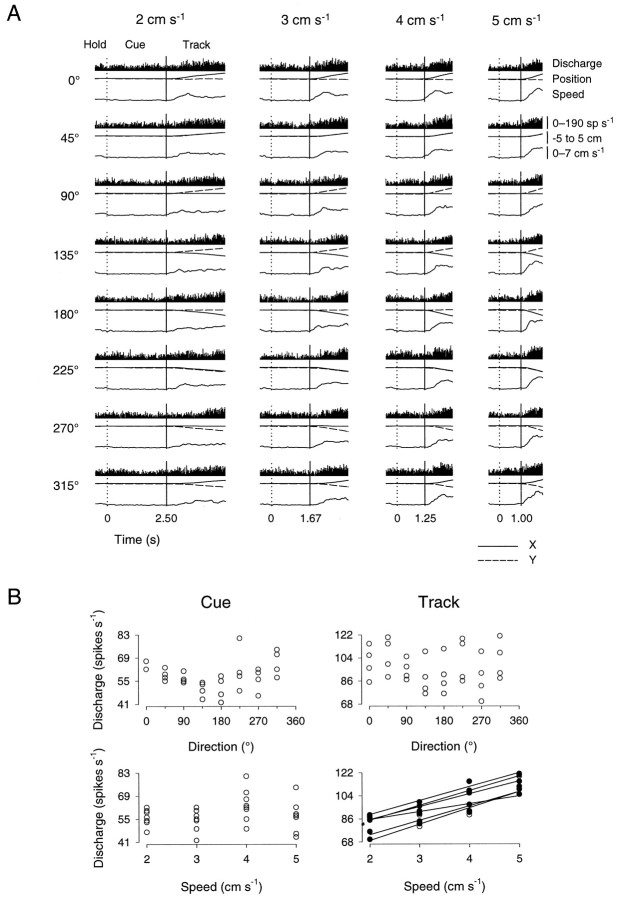
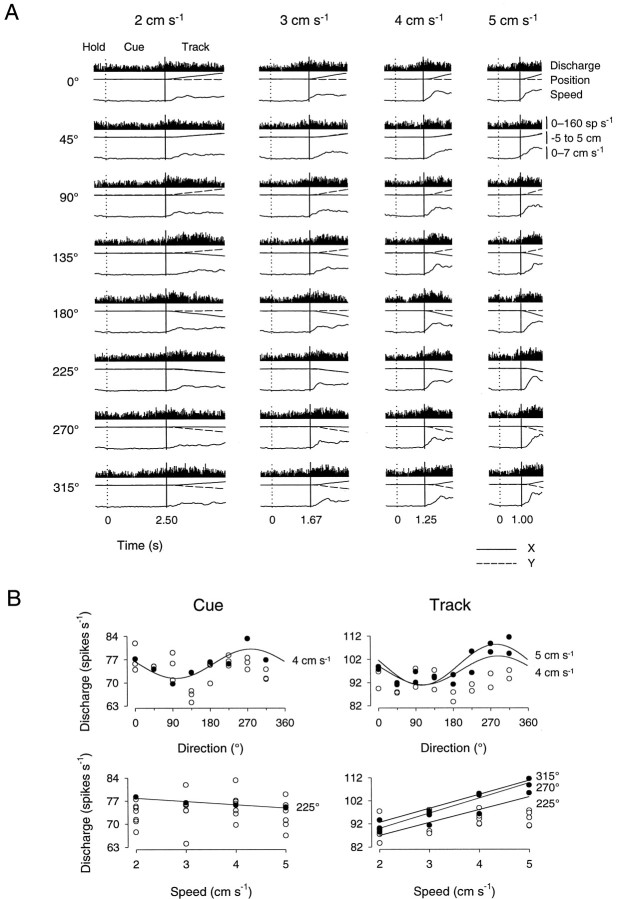
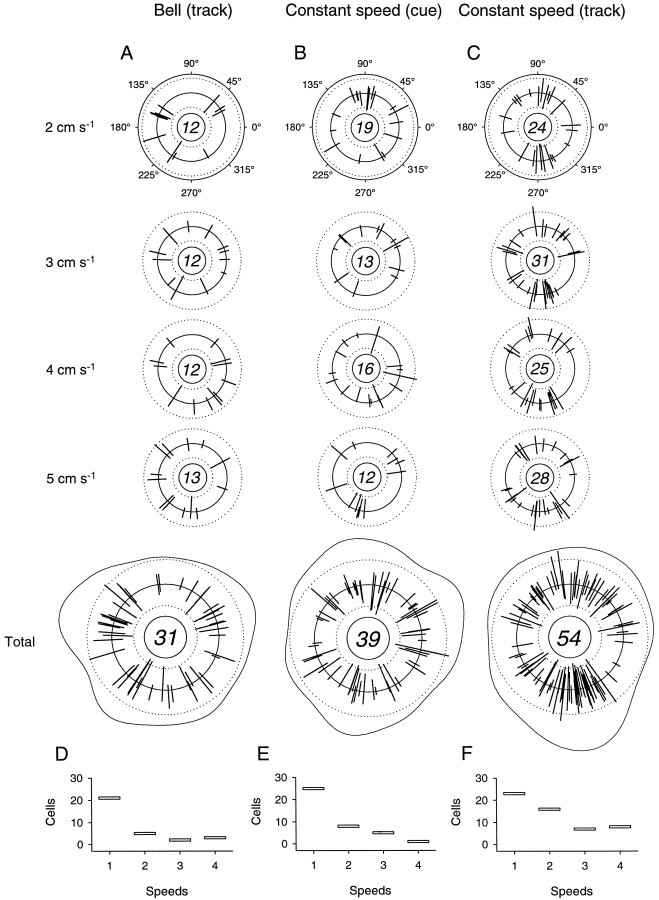
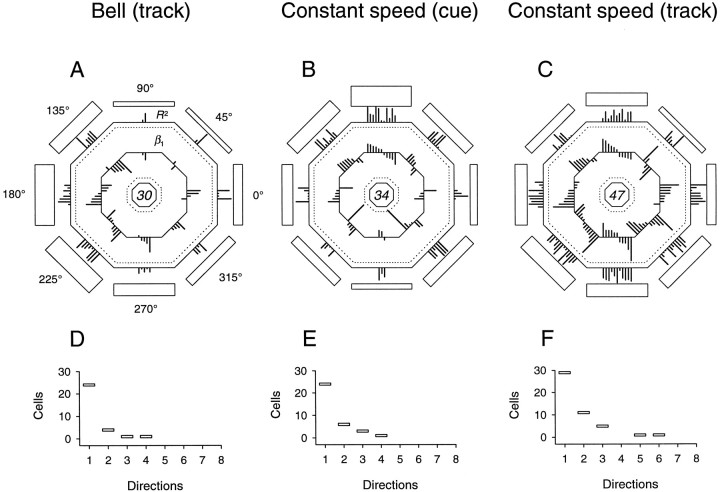
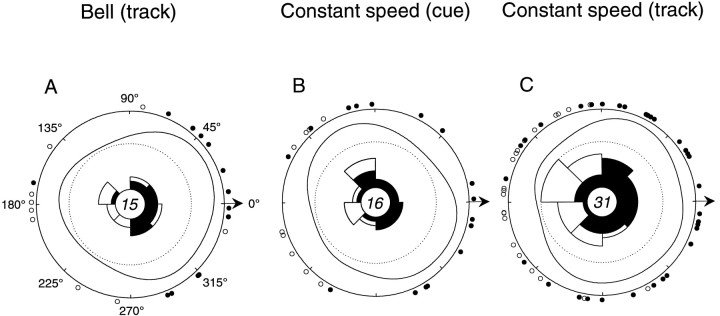
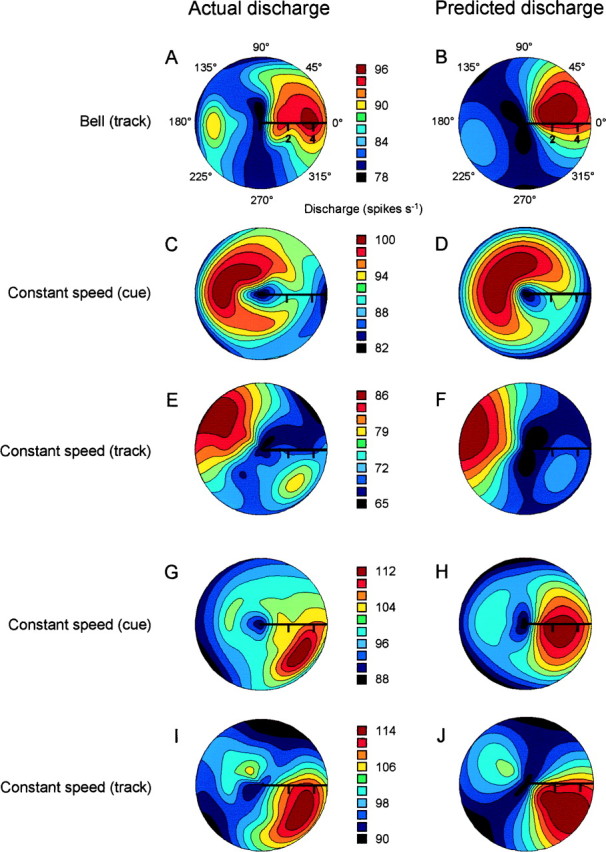
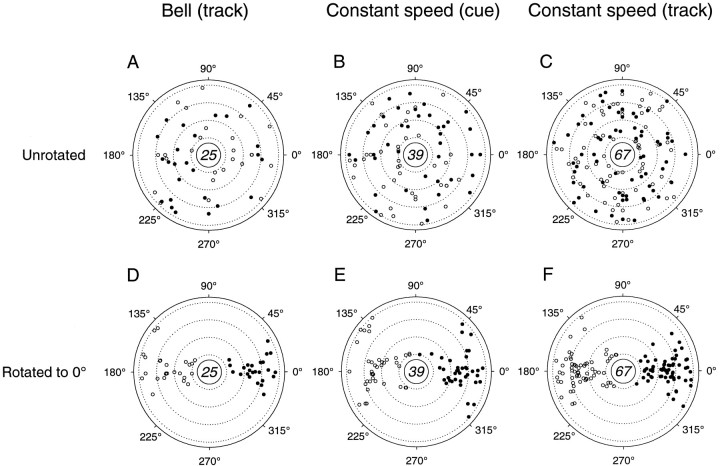
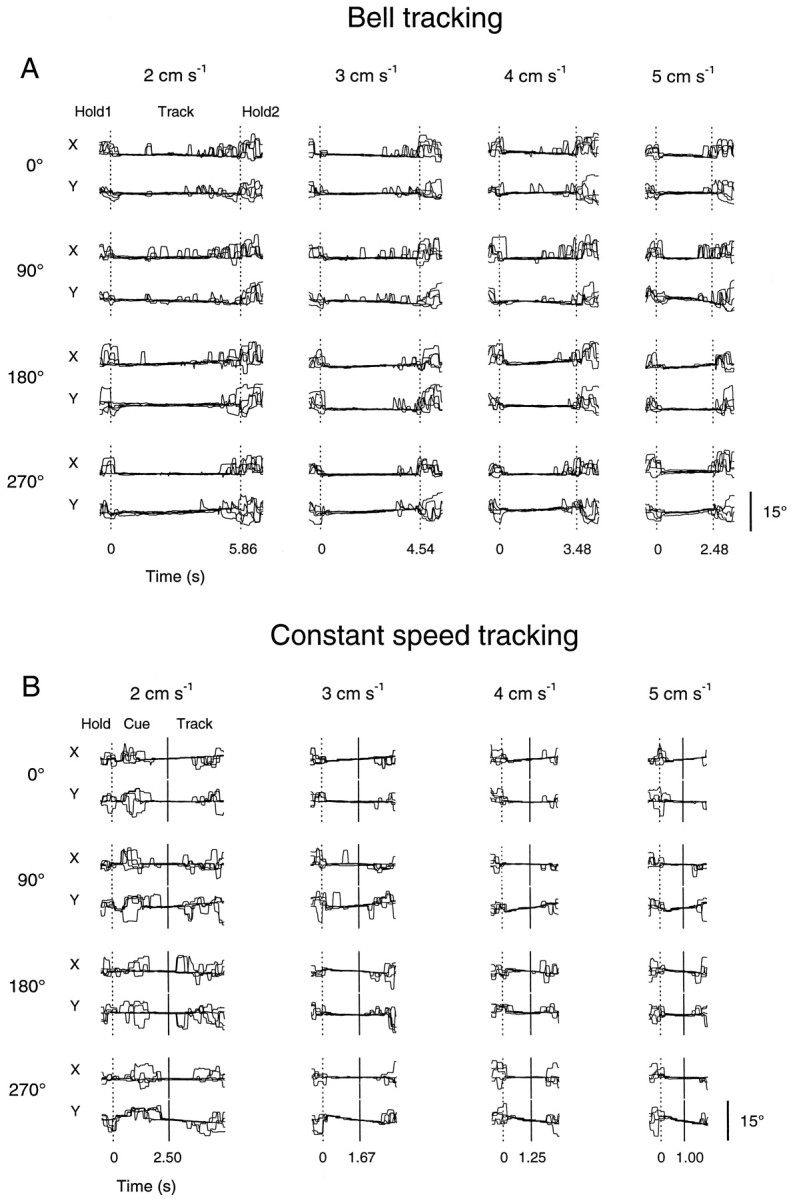
Pathophysiological, lesion, and electrophysiological studies suggest that the cerebellar cortex is important for controlling the direction and speed of movement. The relationship of cerebellar Purkinje cell discharge to the control of arm movement parameters, however, remains unclear. The goal of this study was to examine how movement direction and speed and their interaction-velocity-modulate Purkinje cell simple spike discharge in an arm movement task in which direction and speed were independently controlled. The simple spike discharge of 154 Purkinje cells was recorded in two monkeys during the performance of two visuomotor tasks that required the animals to track targets that moved in one of eight directions and at one of four speeds. Single-parameter regression analyses revealed that a large proportion of cells had discharge modulation related to movement direction and speed. Most cells with significant directional tuning, however, were modulated at one speed, and most cells with speed-related discharge were modulated along one direction; this suggested that the patterns of simple spike discharge were not adequately described by single-parameter models. Therefore, a regression surface was fitted to the data, which showed that the discharge could be tuned to specific direction-speed combinations (preferred velocities). The overall variability in simple spike discharge was well described by the surface model, and the velocities corresponding to maximal and minimal discharge rates were distributed uniformly throughout the workspace. Simple spike discharge therefore appears to integrate information about both the direction and speed of arm movements, thereby encoding movement velocity.


Figures

Fig. 1.
Fig. 1.
Tracking tasks. A, The bell tracking task required the animals to track targets that moved with bell-shaped speed profiles. The animal first superimposed a cross-hair cursor over the central start target (Hold1); the target then began to move in one of eight directions and at one of four speed profiles. The animal tracked the target (Track) for a distance of 5 cm to the end point (Hold2).B, The constant speed tracking task required the animals to track targets that moved at constant speeds. The animal first held the cursor in the start target (Hold); a cue target (Cue) then appeared 5 cm radial to the start target and moved toward it at a constant speed. When the cue target intersected the center hold target, the animal began to track the moving target (Track) in the same direction and at the same speed as the cue target for a distance of 5 cm. C, Schematic of the target movement in the bell tracking task as a function of time and period. First and second vertical dotted lines mark the Hold1 period–Track period and Track period–Hold2 period transitions, respectively. Height of dotted lines indicates peak target speed. D, Schematic of the target movement in the constant speed tracking task as a function of time and period. Vertical dotted andsolid lines mark the Hold period–Cue period and Cue period–Track period transitions, respectively. Height ofvertical lines indicates constant target speed.
Fig. 2.
Fig. 2.
Hand paths and speed profiles. A, B, Average hand paths from 10 movements at each direction–speed combination (8 directions, 4 speeds) in the bell (A) and constant speed (B) tracking tasks. C, D, Average speed profiles from movements at each direction–speed combination in the bell (C) and constant speed (D) tracking tasks. Hand paths and speed profiles were recorded from animals D (A, C) and C (B, D). Conventions are as in Figure 1.
Fig. 3.
Fig. 3.
Cell discharge during the track period in the bell tracking task. A, Each plot shows average Purkinje cell simple spike discharge (top) from 10 movements at the direction–speed combination indicated. Also shown are the corresponding x (solid lines) andy (dashed lines) position (middle) and speed (bottom, solid lines). Discharge ranges 0–100 spikes/sec. Position and speed span −5 to 5 cm and 0–6 cm/sec, respectively. Discharge was recorded from animal C.B, Scatterplots of average simple spike discharge during the track period as a function of movement direction (left) and speed (right). Significant directional tuning (R2 > 0.7) was found at speeds of 4 and 5 cm/sec; significant speed-related modulation was found for movements along 315°. Filled circlesdenote discharge rates with statistically significant relations to direction and speed.
Fig. 4.
Fig. 4.
Cell discharge during the track period in the constant speed tracking task. A, Conventions are as in Figure 3. Speed spans 0–7 cm/sec. Discharge rate ranges 0–190 spikes/sec; recorded from animal D. B, Scatterplots of average simple spike discharge during the cue (left) and track (right) periods as a function of movement direction (top) and speed (bottom). No significant directional tuning was found in either the cue or track period; significant speed-related modulation was found only during the track period for movements along 0, 45, 90, 180, 270, and 315°.Filled circles denote discharge rates with statistically significant relations to speed. See Results for details.
Fig. 5.
Fig. 5.
Cell discharge during the cue and track periods in the constant speed tracking task. A, B, Conventions are as in Figures 3 and 4. Example of a cell with statistically significant directional tuning (4 cm/sec) and speed-related modulation (225°) during the cue period is shown. Discharge was also related to movement direction (4 and 5 cm/sec) and speed (225, 270, and 315°) during the track period. Simple spike discharge (A) spans 0–160 spikes/sec.
Fig. 6.
Fig. 6.
Summary of movement direction-related cell discharge at each movement speed. A–C, Distribution of PDs and R2 andIdir values for all cells with significant direction-related discharge in the track period of the bell tracking task (A) and in the cue (B) and track (C) periods in the constant speed tracking task. Numbers of cells with statistically significant directional tuning (R2 > 0.7) at each speed are given in the center of each plot. Each radially directed spoke indicates PD,R2, andIdir. Length of spokesprojecting inward from center reference line givesR2 from 0.7 to 1.0 (dotted line at 0.9); length of spokes projecting outward gives Idir for values >0 (dotted line at 0.3). Total plots show PDs, and R2, andIdir values for all four peak and constant speeds, with superimposed density estimates. Numbers incenters of Total plots indicate the numbers of cells with statistically significant directional tuning for all speeds. D–F, Total numbers of cells with direction-related discharge at each movement speed.
Fig. 7.
Fig. 7.
Summary of movement speed-related discharge along each direction. A–C, Distribution of positive and negative speed slopes (β1 values; Eq. 3) andR2 values for cells with significant speed-related modulation (R2 > 0.9) in the track period of the bell tracking task (A) and in the cue (B) and track (C) periods of the constant speed tracking task.Spokes projecting from the inner octagonindicate β1 values; inward-directed spokesindicate negative values from −14 (inner dotted line) to 0; outward-directed spokes indicate positive β1 values, ranging from 0 to 14 (outer dotted line). Spokes projecting from the outer octagon indicate R2 values, spanning 0.9 to 1.0. Height of outer histogram blocks gives proportion of cells with speed-related modulation in the given hemiquadrant.Numbers of cells with statistically significant speed-related discharge modulation are given in thecenter of each plot. D–F, Number of cells with speed-related modulation at one or more directions during the track period of the bell task (D) and in the cue (E) and track (F) periods of the constant speed task.
Fig. 8.
Fig. 8.
Cells with both directionally tuned and speed-related discharge. Polar plots indicate the coincidence of direction- and speed-related modulation in the track period of the bell task (A) and in the cue (B) and track (C) periods of the constant speed task. Circles around plot peripheries indicate directions along which cells had speed-related discharge after rotation of cells’ PDs to 0°. Filled circles indicate positive speed slopes (β1 > 0; Eq. 3); open circles indicate negative speed slopes (β1 < 0). Rose plotsindicate numbers of positive (filled) and negative (open) speed slopes in each hemiquadrant (dotted line, n = 11). Density estimates show relative concentration of positive speed modulation in a given directional region. Cells tended to have positive speed-related modulation in the same hemisphere as the PD and negative speed-related modulation in the opposite hemisphere.
Fig. 9.
Fig. 9.
Actual and predicted simple spike discharge from fitting the response surface model. A–J, Color polar contour plots of actual simple spike discharge rates (left) and predicted discharge rates (right) for five Purkinje cells as a function of direction and speed. Speed is indicated on the radius arm. For the actual discharge plots (A, C, E, G, I) the average discharge is plotted for each of the 32 direction–speed combinations. The continuous surface was generated using bicubic interpolation of the 32 points. The plots of predicted discharge (B, D, F, H, J) were plotted using the predicted surfaces from the polynomial model.
Fig. 10.
Fig. 10.
Summary of movement velocity encoding in simple spike discharge. A–C, Velocities at which maximal (filled circles) and minimal (open circles) discharge rates were found for all cells with significant fits to the surface model during the track period of the bell tracking task (A) and in the cue (B) and track (C) periods of the constant speed task. Dotted lines indicate speeds of 2, 3, 4, and 5 cm/sec from the center. D–F, Velocities corresponding to maximal and minimal discharge rates after rotation of maximal velocities to the PD of the cell. Conventions are as in A–C.
Fig. 11.
Fig. 11.
Recording sites. A, Regions and penetration coordinates for the recordings in animal D (left cerebellar hemisphere) and animal C (right hemisphere). PF, Primary fissure. B, C, Expanded view of the recording locations from animals D and C, respectively. At each recording site the color of the circleindicates whether a cell’s discharge responded to passive manipulation of the hand and wrist (red), arm and elbow (green), or shoulder (blue).Black dots indicate that the cell responded to active movements but not passive manipulations. In some penetration tracks more than one Purkinje cell was recorded.
Fig. 12.
Fig. 12.
Task-related eye movements. A, Single-trial records of x and y eye positions in time during bell tracking at each of the four peak speeds (2, 3, 4, and 5 cm/sec) and at four of the eight movement directions (0, 90, 180, and 270°) recorded in animal D. Data from five overlapping trials are shown; first and second vertical dotted lines mark the Hold1 period–Track period and the Track period–Hold2 period transitions, respectively.B, Single-trial records of x andy eye positions during constant speed tracking at each of the four constant speeds (2, 3, 4, and 5 cm/sec) and at four of the eight movement directions (0, 90, 180, and 270°) from animal C. Five overlapping trials are shown. Vertical dotted lines mark the Hold period–Cue period transitions; vertical solid lines mark the Cue period–Track period transitions. Scale bar,x and y eye position excursions of 15°.
Fig. 13.
Fig. 13.
Task-related EMG activity. A–C, EMG activity of the biceps (long head), spinodeltoid, and flexor carpi ulnaris muscles recorded in animals D, D, and C, respectively. Also shown in each plot are x and y hand position (solid and dashed lines, middle) and speed (solid lines, bottom). Position and speed span −5 to 5 cm and 0–6 cm/sec, respectively. The biceps EMG was recorded during performance of the bell task; the spinodeltoid and flexor carpi ulnaris muscles were recorded during the constant speed task.D–F, Average EMG activity in standardized units as a function of direction (top) and speed (bottom) corresponding to A–C above. Each of these muscles was directionally tuned at all four speeds; no speed-related activity was observed along any of the directions.

References

    1. Bastian AJ, Martin TA, Keating JG, Thach WT. Cerebellar ataxia: abnormal control of interaction torques across multiple joints. J Neurophysiol. 1996;76:492–509. - PubMed
    1. Batschelet E. Circular statistics in biology. Academic; New York: 1981.
    1. Becker WJ, Morrice BL, Clark AW, Lee RG. Multi-joint reaching movements and eye-hand tracking in cerebellar incoordination: investigation of a patient with complete loss of Purkinje cells. Can J Neurol Sci. 1991;87:407–420. - PubMed
    1. Beppu H, Suda M, Tanaka R. Analysis of cerebellar motor disorders by visually guided elbow tracking movement. Brain. 1984;107:407–420. - PubMed
    1. Boussaoud D, Wise SP. Primate frontal cortex: neuronal activity following attentional versus intentional cues. Exp Brain Res. 1993;95:15–27. - PubMed

Publication types

LinkOut - more resources