. 1999 Mar;67(3):1034-44.
doi: 10.1128/IAI.67.3.1034-1044.1999.

Generation of CD8(+) T-cell responses to Mycobacterium bovis and mycobacterial antigen in experimental bovine tuberculosis

Affiliations

Generation of CD8(+) T-cell responses to Mycobacterium bovis and mycobacterial antigen in experimental bovine tuberculosis

E Liébana et al. Infect Immun. 1999 Mar.

Abstract

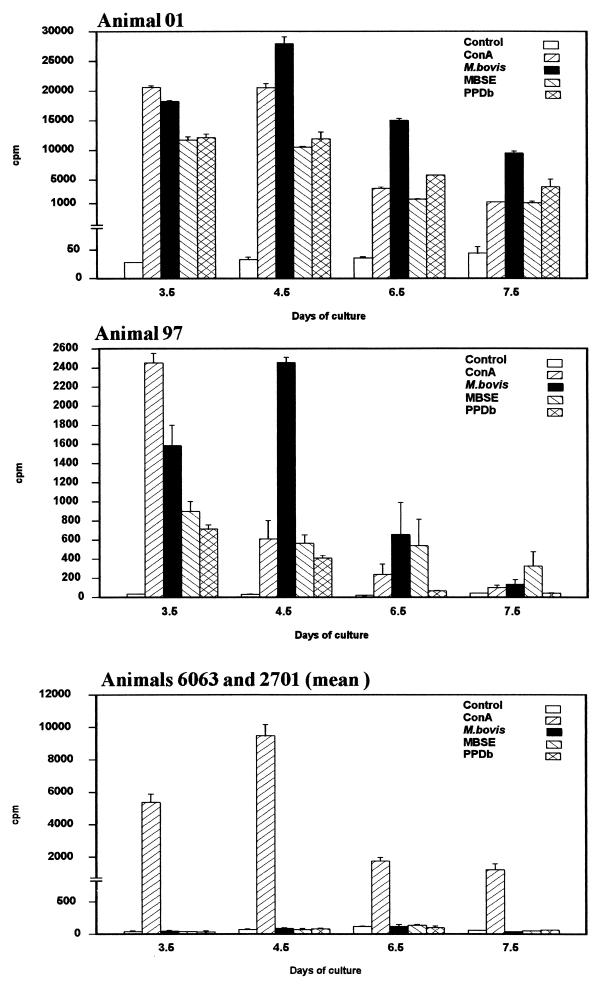
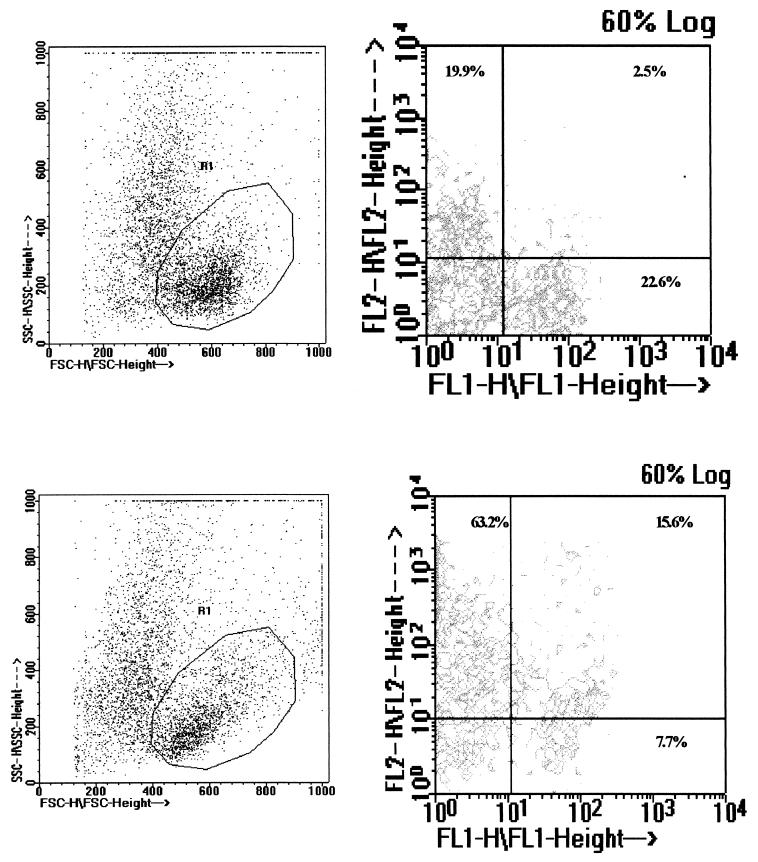
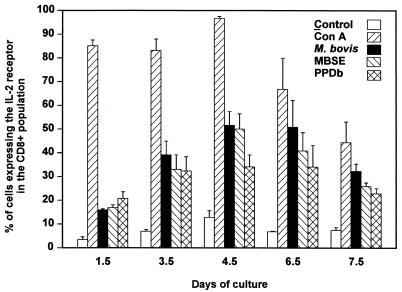
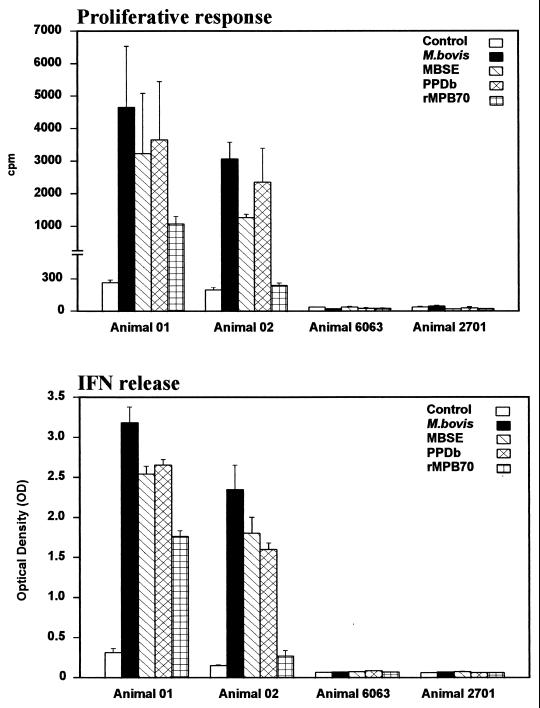
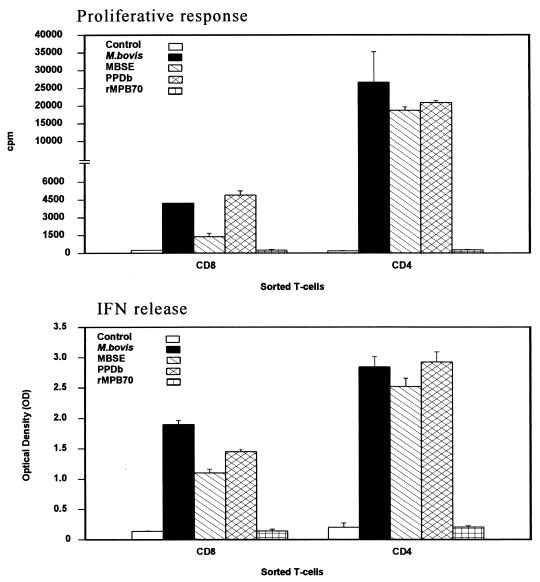
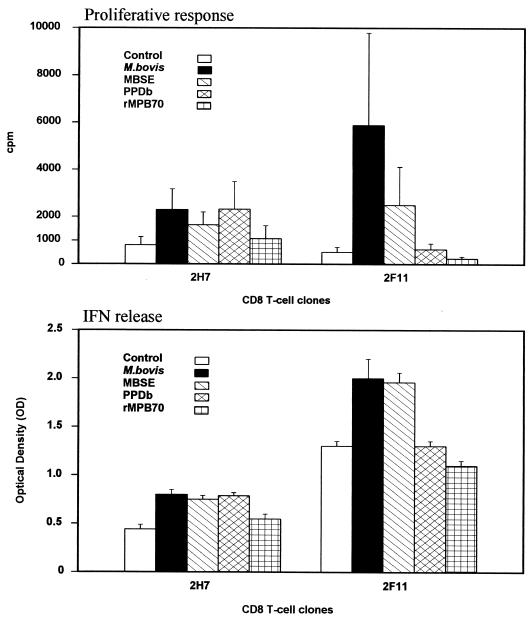
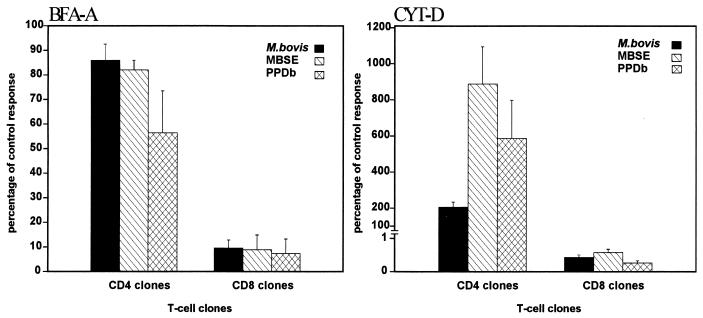
Protective immunity against tuberculosis is considered to be essentially cell mediated, and an important role for CD8(+) T lymphocytes has been suggested by several studies of murine and human infections. The present work, using an experimental model of infection with Mycobacterium bovis in cattle, showed that live M. bovis elicits the activation of CD8(+) T cells in vitro. However, a sonic extract prepared from M. bovis (MBSE) and protein purified derivative (PPDb) also induced a considerable degree of activation of the CD8(+) T cells. Analysis of proliferative responses of peripheral blood mononuclear cells, purified CD8(+) T cells, and CD8(+) T-cell clones to M. bovis and to soluble antigenic preparations (MBSE, PPDb) showed that the responses of all three types of cells were always superior for live mycobacteria but that strong responses were also obtained with complex soluble preparations. Furthermore, while cytotoxic capabilities were not investigated, the CD8(+) T cells were found to produce and release gamma interferon in response to antigen (live and soluble), which indicated one possible protective mechanism for these cells in bovine tuberculosis. Finally, it was demonstrated by metabolic inhibition with brefeldin A and cytochalasin D at the clonal level that an endogenous pathway of antigen processing is required for presentation to bovine CD8(+) cells and that presentation is also dependent on phagocytosis of the antigen.


Figures

FIG. 1
FIG. 1
PBMC populations from two experimentally infected animals (01 and 97) and two noninfected controls (6063 and 2701) were stimulated in vitro with M. bovis (106 CFU/ml), MBSE (4 μg/ml), or PPDb (4 μg/ml). Control (no antigen) and concanavalin A (ConA)-stimulated cultures were also included. Results represent lymphocyte proliferation assessed by [methyl-3H]thymidine incorporation at various time points and are expressed as mean counts per minute (cpm) of triplicate values ± standard errors.
FIG. 2
FIG. 2
Flow cytometric analysis of CD8+-T-cell activation. PBMC from animal 01 were cultured with PBS (top) or M. bovis (bottom) and stained with monoclonal antibodies to the surface molecules CD8 (FL1 signal) and IL-2R (FL2 signal) on day 4.5, and viable cells were selected on forward scatter (FSC) versus side scatter (SSC) dot plots (left). Dual-fluorescence contour diagrams for the gated population (R1) (right) were used to assess the percentage of cells positive for both markers. The percentage in the upper right quadrant represents activated (IL-2R+) CD8+ T cells.
FIG. 3
FIG. 3
Kinetics of activation of CD8+ T cells. PBMC from M. bovis-infected animals (01, 84, and 97) were stimulated in vitro with live M. bovis (106 CFU/ml), MBSE (4 μg/ml), or PPDb (4 μg/ml) for different periods (1.5, 3.5, 4.5, 6.5, and 7.5 days). Control (no-antigen) and concanavalin A (Con A)-stimulated cultures were also included. Activation of CD8+ T cells within the short-term cultures was determined by staining for CD8 and IL-2R at each of the time points and analyzed by flow cytometry. Results are representative of two experiments and are expressed as the mean value from the three animals ± standard error.
FIG. 4
FIG. 4
Proliferation (top) and IFN-γ production (bottom) of MACS-separated CD8+ T cells in response to M. bovis (106 CFU/ml), MBSE, PPDb, and rMPB70 (4 μg/ml). The top panel shows the responses as cpm following [methyl-3H]thymidine incorporation. The bottom panel indicates the IFN-γ production assessed by ELISA and presented as OD450. Results are shown for experimentally infected animals 01 (two experiments) and 02 (three experiments) and for two noninfected control animals (animals 6063 and 2701) and are expressed as mean and standard error. The proliferation (cpm) obtained for APC alone in all the animals were similar to the control values. The OD450 obtained for APC alone were <0.8 for animal 01, <0.3 for animal 02, and <0.06 for animals 6063 and 2701.
FIG. 5
FIG. 5
Comparison of the proliferative responses (top) and IFN-γ production (bottom) of CD8+ and CD4+ MACS-sorted T cells from animal 02 in response to M. bovis (106 CFU/ml), MBSE, PPDb, and rMPB70 (4 μg/ml). The top panel shows the responses as cpm following [methyl-3H]thymidine incorporation. The bottom panel indicates the IFN-γ production as assessed by ELISA and presented as OD450. The proliferative responses obtained for APC alone were similar to the control value. The OD450 values obtained for APC alone were <0.2.
FIG. 6
FIG. 6
Proliferation (top) and IFN-γ production (bottom) of CD8+ T-cell clones in response to M. bovis (106 CFU/ml), MBSE, PPDb, and rMPB70 (4 μg/ml). The top panel shows the responses as cpm following [methyl-3H]thymidine incorporation. The bottom panel indicates the IFN-γ production assessed by ELISA and presented as OD450. Results are mean values of three experiments and standard error. For proliferation, the values obtained for APC alone were similar to the controls. The IFN-γ OD450 values obtained for APC alone were <0.3.
FIG. 7
FIG. 7
Effect of BFA-A (left) and CYT-D (right) on the presentation of M. bovis, MBSE, and PPDb. Autologous mitomycin C-treated PBMC were used as APC. The APC were treated with BFA-A (1 μg/ml) or CYT-D (10 μM) for 1 h at 37°C. The different antigens were then added to the cultures, which were further incubated for 1 h. Finally, T-cell clones (CD8+ or CD4+) were added to the appropriate wells. Results are presented as percentages of the control response, i.e., (response in the presence of chemical [cpm]/response in absence of chemical [cpm]) × 100, and are representative of two repeated experiments with CD8+ (2H7 and 2F11) and CD4+ (2E1 and 2E6) T-cell clones.

References

    1. Adorini L, Ullrich S J, Appella S, Fuchs S. Inhibition by brefeldin A of presentation of exogenous protein antigens to MHC class II restricted cells. Nature. 1990;346:63–66. - PubMed
    1. Berggren S A. Field experiment with BCG vaccine in Malawi. Br Vet J. 1981;137:88–96. - PubMed
    1. Bevan M J. Antigen recognition. Class discrimination in the world of immunology. Nature. 1987;325:192–194. - PubMed
    1. Boom W H. The role of T cell subsets in Mycobacterium tuberculosis infection. Infect Agents Dis. 1996;5:73–81. - PubMed
    1. Breen E C, Salazar-Gonzalez J F, Shen L P, Kolberg J A, Urdea M S, Martinez-Maza O, Fahey J L. Circulating CD8+ T cells show increased interferon-γ m-RNA expression in HIV infection. Cell Immunol. 1997;178:91–98. - PubMed

Publication types