. 1999 Feb 22;144(4):617-29.
doi: 10.1083/jcb.144.4.617.

Processing of endogenous pre-mRNAs in association with SC-35 domains is gene specific

Affiliations

Processing of endogenous pre-mRNAs in association with SC-35 domains is gene specific

K P Smith et al. J Cell Biol. .

Abstract

Analysis of six endogenous pre-mRNAs demonstrates that localization at the periphery or within splicing factor-rich (SC-35) domains is not restricted to a few unusually abundant pre-mRNAs, but is apparently a more common paradigm of many protein-coding genes. Different genes are preferentially transcribed and their RNAs processed in different compartments relative to SC-35 domains. These differences do not simply correlate with the complexity, nuclear abundance, or position within overall nuclear space. The distribution of spliceosome assembly factor SC-35 did not simply mirror the distribution of individual pre-mRNAs, but rather suggested that individual domains contain both specific pre-mRNA(s) as well as excess splicing factors. This is consistent with a multifunctional compartment, to which some gene loci and their RNAs have access and others do not. Despite similar molar abundance in muscle fiber nuclei, nascent transcript "trees" of highly complex dystrophin RNA are cotranscriptionally spliced outside of SC-35 domains, whereas posttranscriptional "tracks" of more mature myosin heavy chain transcripts overlap domains. Further analyses supported that endogenous pre-mRNAs exhibit distinct structural organization that may reflect not only the expression and complexity of the gene, but also constraints of its chromosomal context and kinetics of its RNA metabolism.


Figures
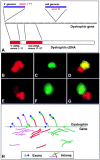
Figure 5
Figure 5
Structure of the dystrophin RNA track. (A) Map of relative positions of dystrophin probes. All distances are approximations due to the lack of a detailed map of the entire dystrophin gene locus. The dystrophin gene is represented by equally spaced hash marks that represent exons. The variability of intron sizes is not represented here. Positions of the two genomic and two cDNA probes relative to the dystrophin gene and mRNA are shown. (B–D) 5′ cDNA sequences overlap more 3′ sequences. 5′ cDNA signal (B, red) runs into and overlaps the mid cDNA signal (C, green) as seen in the combined photo (D), indicating that 5′ sequences are transcribed first and carried along as midgene exons are transcribed. (E–G) RNA sequences seen with 5′ intron sequences do not overlap more 3′ intron sequences. 5′ genomic sequences (E, red) do not overlap midgene genomic sequences (F, green) as shown in the combined photo (G). Both probes are almost entirely intron sequences. Only minute amounts of 5′ sequences can be seen overlapping the midgene RNA signal. Separation suggests that the intron sequences are cleaved out of the transcribing RNA. (H) Model of cotranscriptional processing of dystrophin RNA. As RNA is transcribed along the gene, introns are spliced out, whereas the spliced exons move down the gene. So the intron foci would appear spatially separate and the 5′ and midgene exon tracks would overlap.
Figure 1
Figure 1
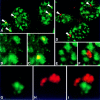
Detection of MyHC and dystrophin RNA foci in myotube nuclei (left). Nuclei of a myotube show variable positions of MyHC and dystrophin RNA foci. Most nuclei have two MyHC signals (green) and a single dystrophin signal (red). The image illustrates the developmental stage-specific expression of MyHC and dystrophin. A single myoblast nucleus (left, bottom left) outside of the myotube has neither MyHC nor dystrophin RNA foci. The myotube cytoplasm is visualized by the presence of cytoplasmic MyHC mRNA (green). (Right) Two myotube nuclei demonstrate that the RNA foci detected by a MyHC genomic probe (32 kb, green) and a dystrophin midgene genomic probe (16 kb, red) are of comparable size and intensity. This suggests that there is roughly similar molar abundance of each RNA in these foci.
Figure 2
Figure 2
Compartmentaliza- tion of MyHC and dystrophin RNAs. (A–C) MyHC RNA localizes within SC-35 domains. (A) Nuclei showing MyHC RNA foci (red, overlap appears yellow, marked by arrows) and domains enriched in the splicing assembly factor SC-35 (green). (B) Enlargement of a region showing only the SC-35 domains (green). (C) Combined red and green shows MyHC RNA in SC-35 domains. Overlaps appear yellow. (D–F) Dystrophin RNA does not localize to SC-35 domains. (D) Nuclei showing dystrophin RNA foci detected with a 5′ cDNA probe (red, marked by arrows) and domains enriched in the splicing assembly factor SC-35 (green). (E) Enlargement of a region showing only the SC-35 domains (green). (F) Double-label image indicates no overlap of dystrophin RNA (red) and SC-35 domains. (G–I) Dystrophin and MyHC RNAs do not overlap. (G) MyHC RNA focus (green). (H) Dystrophin RNA detected with a 5′ cDNA probe (red). (I) Combined red and green shows that two RNA foci in proximity to each other do not overlap.
Figure 3
Figure 3
Frequency of association of muscle-specific RNAs with SC-35 defined domains. MyHC and dystrophin RNA signals were scored as coincident with, or completely separate from SC-35 domains. Three different dystrophin probes, midgenomic, mid-cDNA, and 5′ cDNA were used. At least two investigators scored each experiment. N = number of signals scored.
Figure 4
Figure 4
Dystrophin and MyHC RNA signal positions in reiterated myotube nuclei. Three examples of the diagrams used to analyze 51 nuclei in 15 separate myotubes are shown. Myotubes were from female 077 myoblasts. M, MyHC RNA; D, dystrophin RNA. Only one dystrophin RNA track is seen in each nucleus due to inactivation of one X chromosome. Relative positions of the RNA signals were found to be quite different among nuclei of a common myotube.
Figure 6
Figure 6
Tracks versus trees. (A and B) MyHC RNA forms a track that moves away from the gene. (A) MyHC RNA foci (red) form a track with the MyHC gene signal (green, appear yellow in overlap) at the border. (B) Model showing posttranscriptional MyHC RNA molecules (red) moving away from the gene (dark blue). Although gene position relative to SC-35 (light blue) domains is directly demonstrated elsewhere (Moen et al., in preparation) the relationship of the track relative to the domain is consistent with published results for collagen (Xing et al., 1995) and fits with results presented here. (C and D) Dystrophin RNA forms a tree around the gene. (C) Dystrophin RNA (green) appears to surround the two foci corresponding to the 5′ and midgene regions of the dystrophin gene (red, appear yellow in overlap). (D) Model indicating the tree of nascent dystrophin transcripts (green) attached to the dystrophin gene (red and blue). Dark blue segments refer to the portions of the gene detected with the two different genomic probes.
Figure 7
Figure 7
Distributions of E2F4, LMNA, LMNB1, and LBR gene/RNA signals relative to SC-35 domains. Fibroblasts (WI-38) were hybridized with genomic probes to LMNA, E2F4, LBR, and LMNB1 (red). All of the genes are active in fibroblasts. Hybridizations were done using heat denaturation (detects both RNA and gene) for E2F4, LBR, and LMNB1, and under nondenaturing conditions (detects only RNA) for LMNA. LMNA and E2F4 associate with the periphery of SC-35 domains (green), whereas LBR and LMNB1 signals are spatially separate. Only one gene/RNA signal is evident in the LMNB1 image.
Figure 8
Figure 8
Frequency of LMNA, E2F4, LBR, and LMNB1 gene/RNA associations with SC-35 domains. Nuclei were scored for association of each of the four gene/RNAs with SC-35 domains. Signals were scored as associated if they either overlapped SC-35 rich regions or if no space was visible between the focus and the domain. At least two investigators scored each experiment. N = number of signals scored.
Figure 9
Figure 9
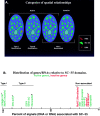
Types and frequencies of RNA and gene associations with SC-35 domains. (A) RNA foci of genes examined to date exhibit three distributions relative to SC-35 domains. Type I associations are defined by an RNA that overlaps the SC-35 domain. This type of association is evident in MyHC and collagen RNAs. In Type II associations demonstrated by LMNA and E2F4, the RNA signal is seen at the periphery of the SC-35 domain. Nonassociated RNA signals such as dystrophin, LMNB1, and LBR are visibly separate from the SC-35–rich domains. Inactive genes are also not associated with SC-35 domains. (B) Frequency of association with SC-35 of genes and RNAs studied to date. The five known associated genes/RNAs (all active, green) contact SC-35 domains at least 70% of the time with the two Type I genes collagen and MyHC approaching 100%. The four active (green) nonassociated genes/RNAs are seen with SC-35 domains less than 20% of the time, at a level comparable to inactive genes (red). Association refers to overlap or contact with SC-35 domain. XIST is an intron-containing gene that does not code for a protein (Clemson et al., 1996). #, from Xing et al. (1993); *, from Xing et al. (1995).

Similar articles

Cited by

References

    1. Blencowe BJ, Nickerson JA, Issner R, Penman S, Sharp PA. Association of nuclear matrix antigens with exon-containing splicing complexes. J Cell Biol. 1994;127:593–607. - PMC - PubMed
    1. Blobel G. Gene gating: a hypothesis. Proc Natl Acad Sci USA. 1985;82:8527–8529. - PMC - PubMed
    1. Bregman DB, Du L, van der Zee S, Warren SL. Transcription-dependent redistribution of the large subunit of RNA polymerase II to discrete nuclear domains. J Cell Biol. 1995;129:287–298. - PMC - PubMed
    1. Carter KC, Taneja KL, Lawrence JB. Discrete nuclear domains of poly(A). RNA and their relationship to the functional organization of the nucleus. J Cell Biol. 1991;115:1191–1202. - PMC - PubMed
    1. Carter KC, Bowman D, Carrington W, Fogarty K, McNeil JA, Fay FS, Lawrence JB. A three-dimensional view of precursor messenger RNA metabolism within the mammalian nucleus. Science. 1993;259:1330–1335. - PubMed

Publication types