Comment
. 1999 Feb 15;13(4):424-36.
doi: 10.1101/gad.13.4.424.

Bmp4 is required for the generation of primordial germ cells in the mouse embryo

Affiliations
Comment

Bmp4 is required for the generation of primordial germ cells in the mouse embryo

K A Lawson et al. Genes Dev. .

Abstract

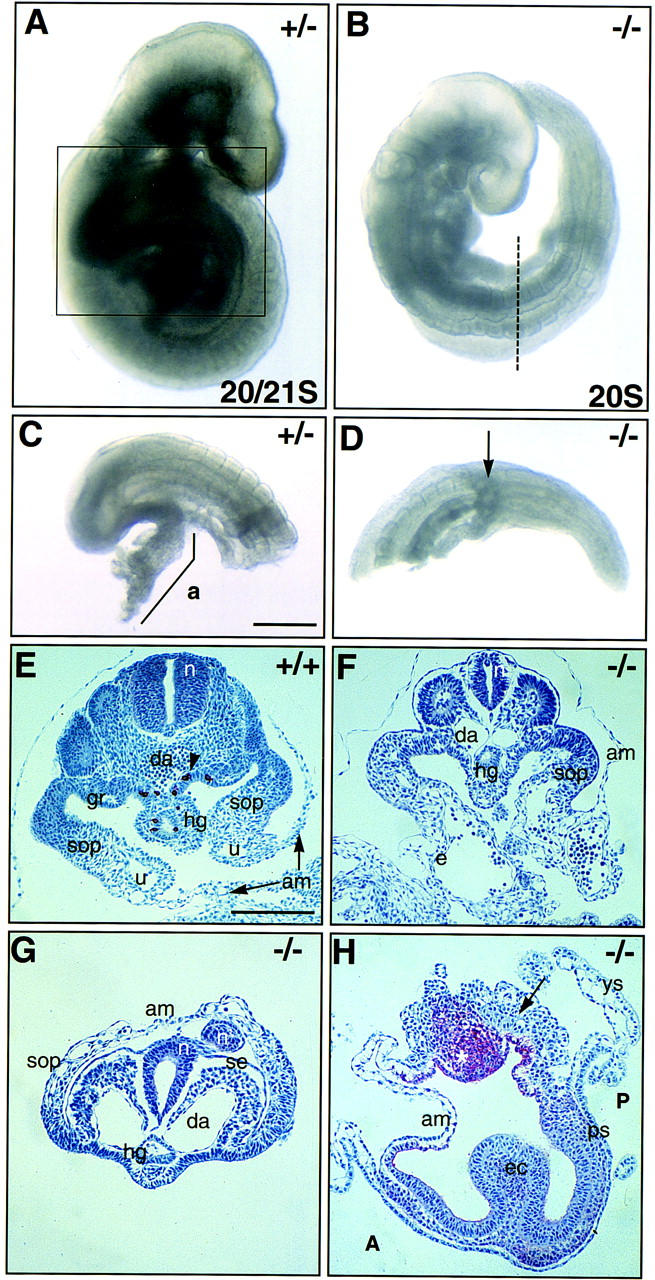
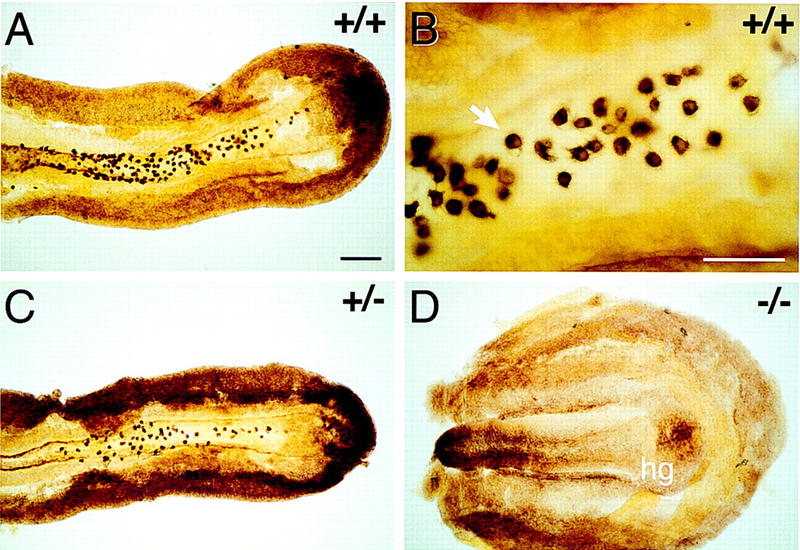
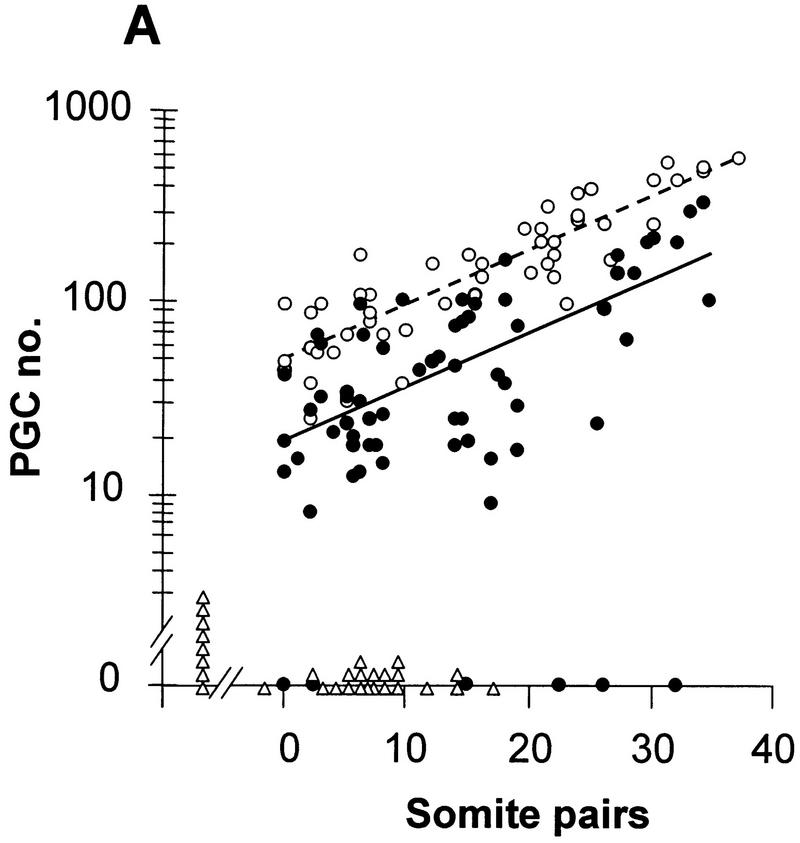
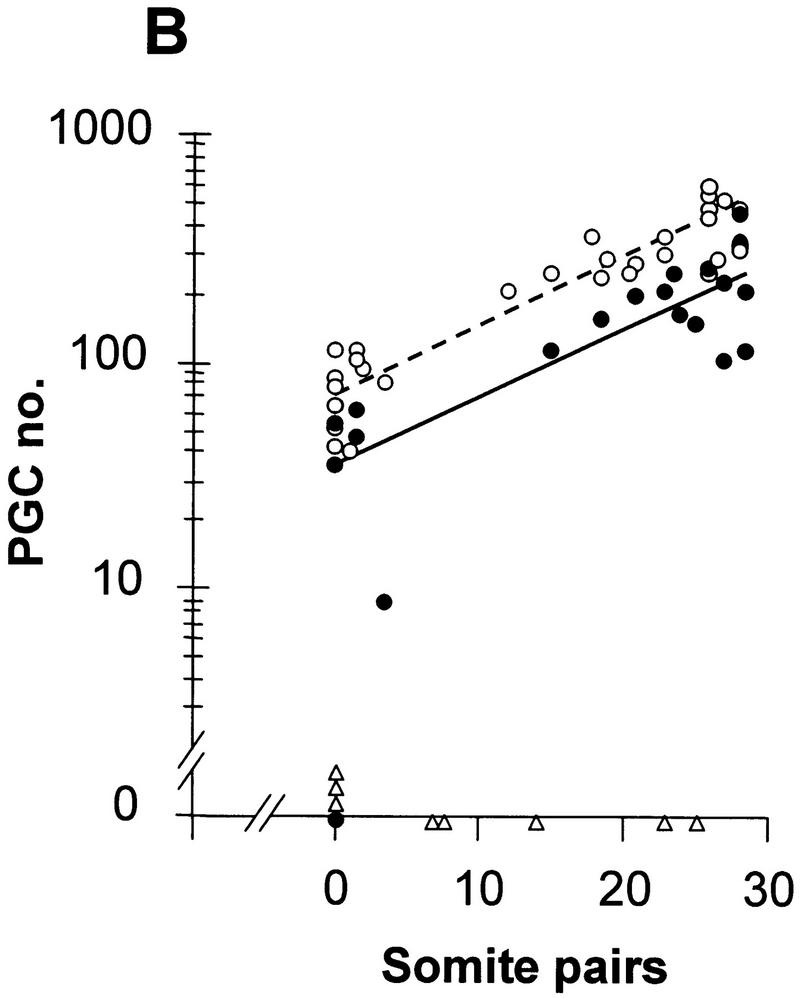
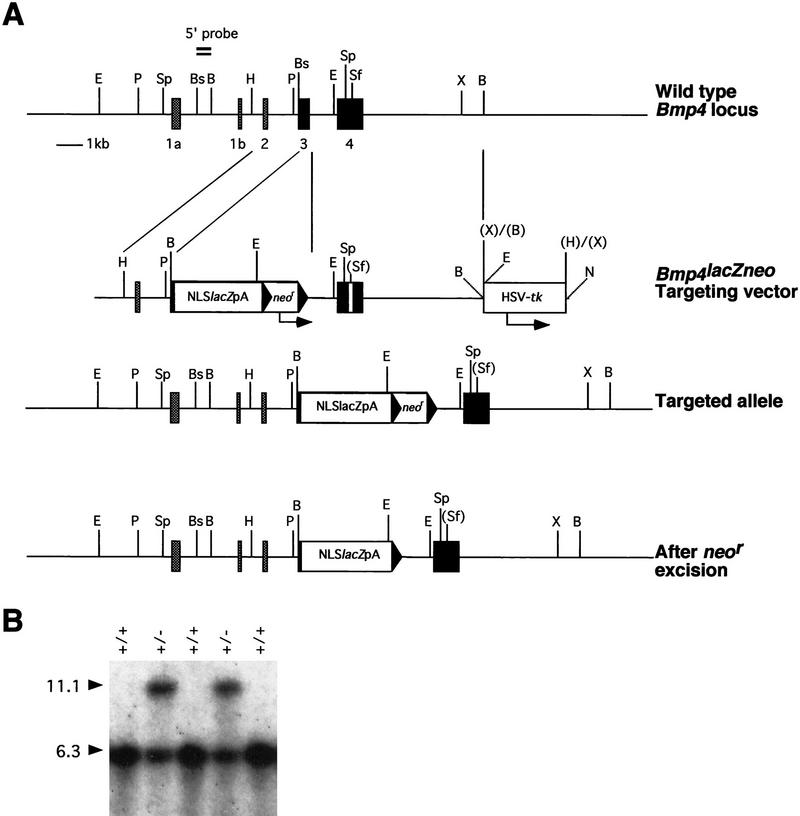
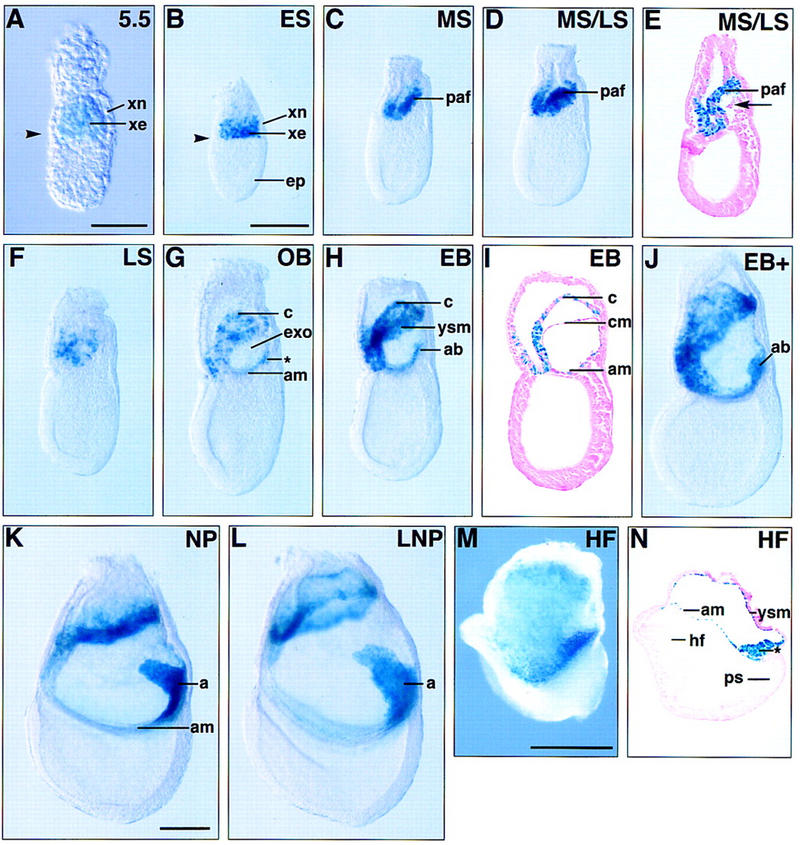
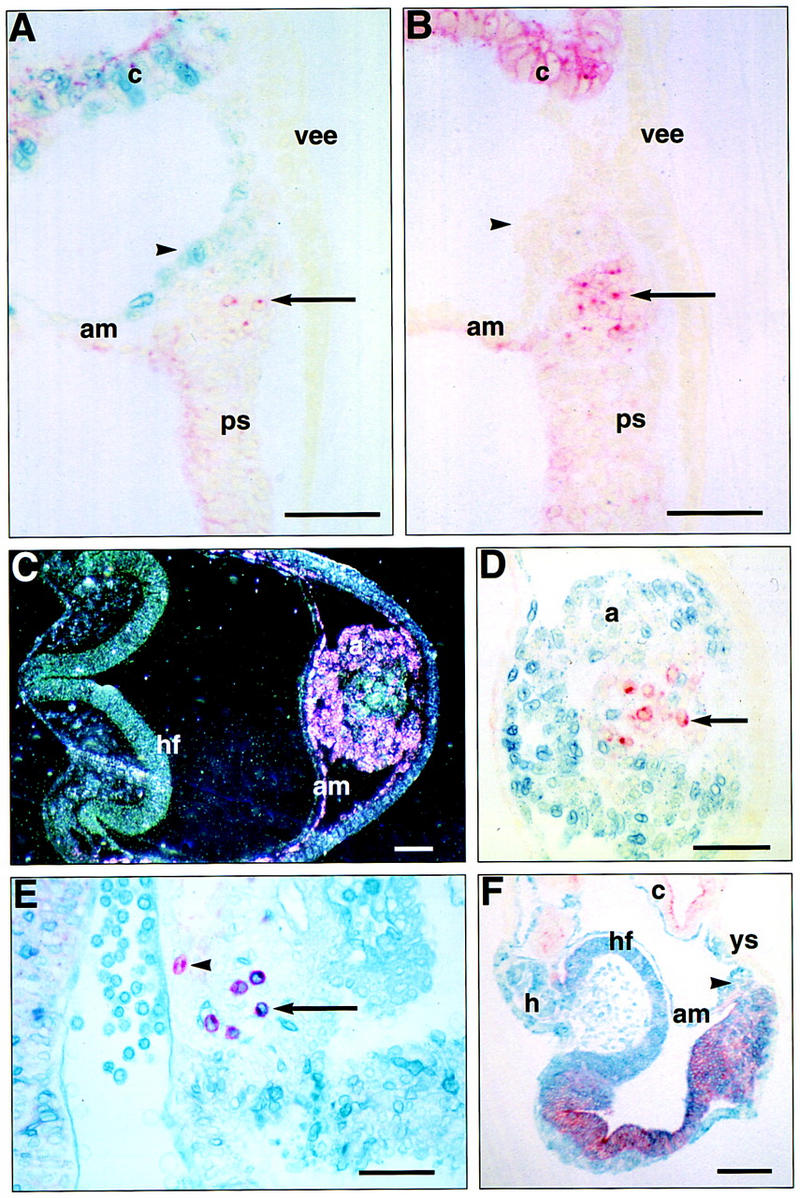
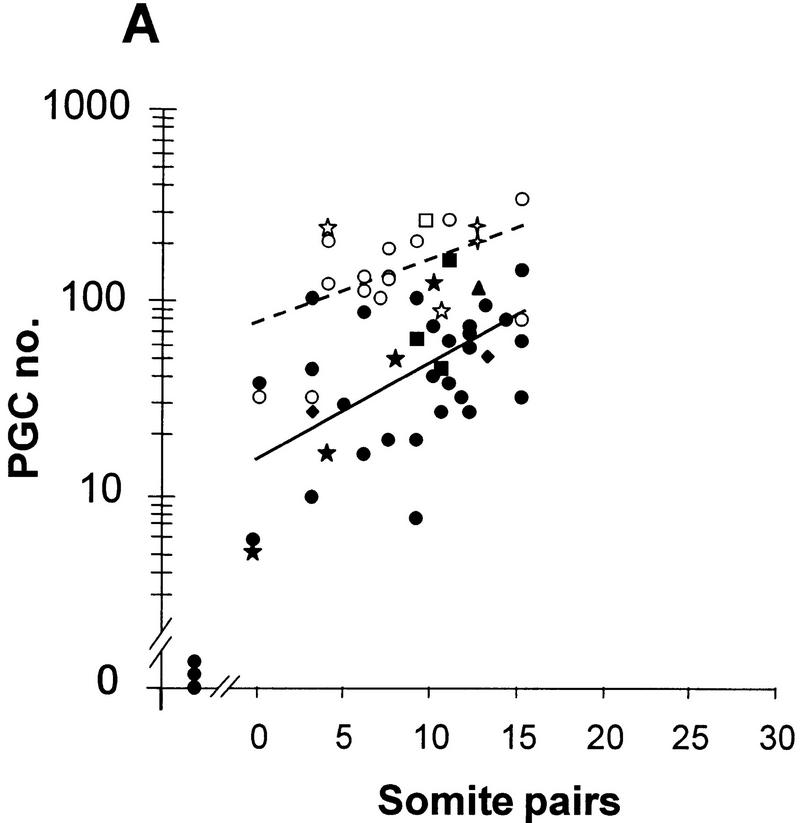
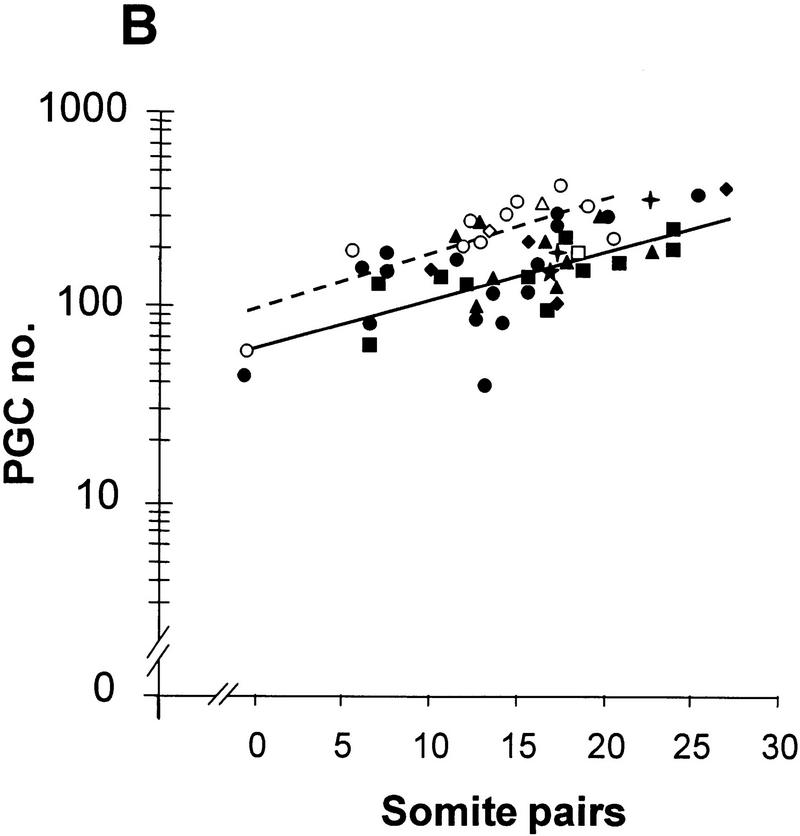
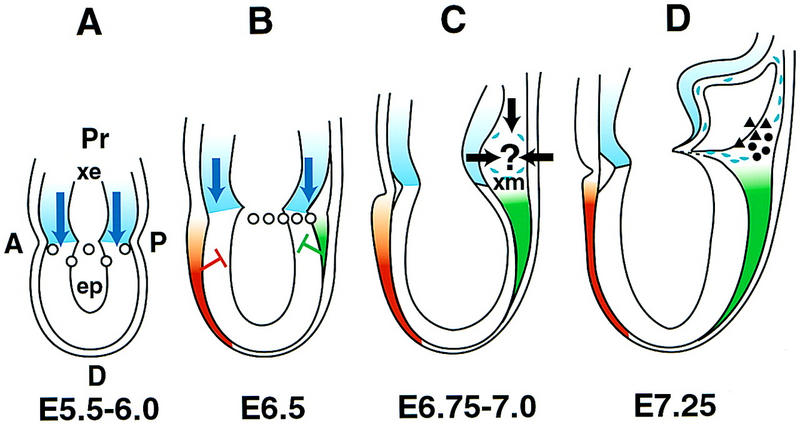
In many organisms the allocation of primordial germ cells (PGCs) is determined by the inheritance of maternal factors deposited in the egg. However, in mammals, inductive cell interactions are required around gastrulation to establish the germ line. Here, we show that Bmp4 homozygous null embryos contain no PGCs. They also lack an allantois, an extraembryonic mesodermal tissue derived, like the PGCs, from precursors in the proximal epiblast. Heterozygotes have fewer PGCs than normal, due to a reduction in the size of the founding population and not to an effect on its subsequent expansion. Analysis of beta-galactosidase activity in Bmp4(lacZneo) embryos reveals that prior to gastrulation, Bmp4 is expressed in the extraembryonic ectoderm. Later, Bmp4 is expressed in the extraembryonic mesoderm, but not in PGCs. Chimera analysis indicates that it is the Bmp4 expression in the extraembryonic ectoderm that regulates the formation of allantois and primordial germ cell precursors, and the size of the founding population of PGCs. The initiation of the germ line in the mouse therefore depends on a secreted signal from the previously segregated, extraembryonic, trophectoderm lineage.


Figures

Figure 1
Figure 1
Phenotypes of advanced Bmp4tm1 (129/SvEv × Black Swiss) mutant embryos. (A) Bmp4tm1/+ embryo at the early forelimb bud stage showing wild-type morphology. (B) Bmp4tm1/Bmp4tm1, littermate of A showing delayed development, incomplete turning, irregular somites and kinked neural tube, uncharacteristic looping of the tail to the left, and absence of allantois. (C) Posterior of embryo in A (boxed region) with allantois (a). (D) No allantois in homozygous mutant (arrow). The broken line in B marks the level of dissection for D. (E–H) Sections of wild-type and homozygous null Bmp4tm1 (129/SvEv × Black Swiss) embryos showing posterior phenotype. AP and haemalum staining. (E) Wild type. Transverse section (TS) of posterior region of an E9.5 embryo with 27 somites. The umbilical vein (u) demarcates the junction between somatopleure (sop) and amnion (am). PGCs (arrowhead) are migrating from the hindgut (hg) into the genital ridges (gr). (F) TS of the posterior region of a −/− sibling to the embryo in E. This embryo had 23 somites and an external morphology similar to the embryo in B. There was no external allantois, but the region between the amnion and the somatopleure was heavily endothelialized (e). (G) TS of the posterior region of another E9.5 −/− sibling with 14 somites and more severe posterior defects. The endothelialized somatopleure has reflected dorsally, forming a posterior pocket that becomes continuous with the amnion. A dorsal extension (n′) of the caudally disorganized neurectoderm (n) surrounded by surface ectoderm (se) is contained within the pocket. (H) Sagittal section of an E8.5 −/− embryo showing a severe mutant phenotype. The embryonic portion contains convoluted ectoderm (ec) and limited mesoderm extending rostrally from the primitive streak (ps). The amnion is normal rostrally, but is filled caudally with mesoderm (arrow), which is continuous with the primitive streak. In addition, there is an accumulation of AP-positive amnion ectoderm (*). (A) Anterior; (da) dorsal aorta; (n) neural tube; (P) posterior; (ys) visceral yolk sac. Scale bars in C for A–D, 200 μm; in E for E–H, 200 μm.
Figure 2
Figure 2
Incidence of wild-type and heterozygous embryos with recognizable PGCs at E7.2–E7.75 from Bmp4tm1/+ (C57BL/6 × CBA) intercrosses (7 females, 40 embryos) and ICR × Bmp4lacZneo/+ matings (4 females, 38 embryos) examined in whole mount. (Open columns) Wild type; (hatched columns) heterozygotes; sample size in parentheses. The same trend was found in both groups (not shown): The pooled data show that the proportion of embryos with PGCs was smaller in the heterozygotes in combined stages up to, and including, the headfold (HF) stage (χ2 test: P < 0.05). (ES/MS) Early streak/midstreak; (LS) late streak; (NP) neural plate; (HF) headfold; (S) somite.
Figure 3
Figure 3
PGCs in posterior (hindgut) pieces from E8.5 sibling embryos from a Bmp4tm1/+ (C57BL/6 × CBA) intercross mating. Alkaline phosphatase staining, dorsal view. (A) Wild type, 15S embryo. (B) High power of part of A showing individual PGCs (arrow) in the hindgut. (C) Heterozygote, 15S embryo. There are fewer PGCs compared with the wild-type sibling in A. (D) Homozygous null, 8S embryo. Although a hindgut is present (hg), PGCs are entirely absent. Scale bars in A for A, C, and D, 200 μm; in B, 100 μm. (+/+) Wild type; (+/−) heterozygote; (−/−) homozygous null.
Figure 4
Figure 4
Linear regression analysis of PGC number (counted in whole mount) vs. somite number in embryos from Bmp4tm1/+ intercrosses. (A) Bmp4tm1 (C57BL/6 × CBA). (B) Bmp4lacZneo (129/SvEv × Black Swiss). (○, broken line) Wild type; (●, solid line) heterozygote; (▵) homozygous null. The values in the regression equation, Y = a + bX, for log PGC (Y) on somite (X) number at the mean values of X and Y with each set of data were in A, wild type, 2.124 = 1.684 + 0.0286 (15.4); heterozygote (PGC values >0), 1.647 = 1.268 + 0.0275 (13.8); B, wild type, 2.305 = 1.878 + 0.0288 (14.8); heterozygote, 2.089 = 1.541 + 0.0298 (18.4). Identification of genotype in B was by β-gal staining and phenotype. In A, the 25/26S heterozygote with 23 PGCs resembled an advanced homozygous null embryo (as in Fig. 1B) and completely lacked an allantois.
Figure 4
Figure 4
Linear regression analysis of PGC number (counted in whole mount) vs. somite number in embryos from Bmp4tm1/+ intercrosses. (A) Bmp4tm1 (C57BL/6 × CBA). (B) Bmp4lacZneo (129/SvEv × Black Swiss). (○, broken line) Wild type; (●, solid line) heterozygote; (▵) homozygous null. The values in the regression equation, Y = a + bX, for log PGC (Y) on somite (X) number at the mean values of X and Y with each set of data were in A, wild type, 2.124 = 1.684 + 0.0286 (15.4); heterozygote (PGC values >0), 1.647 = 1.268 + 0.0275 (13.8); B, wild type, 2.305 = 1.878 + 0.0288 (14.8); heterozygote, 2.089 = 1.541 + 0.0298 (18.4). Identification of genotype in B was by β-gal staining and phenotype. In A, the 25/26S heterozygote with 23 PGCs resembled an advanced homozygous null embryo (as in Fig. 1B) and completely lacked an allantois.
Figure 5
Figure 5
Targeted replacement of the Bmp4 gene with a lacZ reporter cassette. (A) Genomic organization of the wild-type and mutated alleles and the structure of the targeting vector. Coding and noncoding exons are represented by solid and shaded rectangles, respectively. The Bmp4lacZneo targeting vector contains 1.6 kb of 5′ homology. The 6.1-kb 3′ homology arm includes the oligonucleotide-interrupted coding exon 4 (open rectangle) from the Bmp4tm1blh targeting vector (Winnier et al. 1995) and is flanked by the herpes virus thymidine kinase cassette (HSV-tk) for negative selection (Soriano et al. 1991). Coding exon three is replaced with both lacZ and neor resistance cassettes; the arrow indicates the direction of neor transcription. loxP sites (▸) flank the neor cassette. The correctly recombined locus produces a fusion transcript between noncoding Bmp4 sequences and lacZ without disrupting the structure of neighboring introns. The 500-bp BamHI–BsmI fragment used as an external 5′ probe is shown above the wild-type Bmp4 locus. In the 12C targeted ES cell line, recombination occurred in the intron between exons 3 and 4, as determined by the PCR strategy described in Winnier et al. (1995). (B) Southern blot analysis of progeny from a representative backcross of the Bmp4lacZneo allele. By use of the 5′ external probe and SpeI digestion, the wild-type and targeted loci generate 6.3 and 11.1 hybridizing bands, respectively. (B) BamHI; (Bs) BsmI; (C) ClaI; (E) EcoRI; (H) HindIII; (N) NotI; (P) PstI; (Sf) SfiI; (Sm) SmaI; (Sp) SpeI; (X) XbaI. (+/+) Wild type; (+/−) heterozygote.
Figure 6
Figure 6
Bmp4lacZneo expression in the early mouse embryo. (A) An E5.5 embryo viewed under Nomarski optics. Low levels of β-gal activity are first detected throughout the uncavitated extraembryonic ectoderm (xe). (Arrowhead) Junction between embryonic and extraembryonic regions. (B) At the onset of gastrulation (early streak, ES), Bmp4lacZneo expression continues in the extraembryonic ectoderm, in a ring that abuts the epiblast (ep). (C,D) As gastrulation proceeds, Bmp4lacZneo expression within the extraembryonic ectoderm persists and is particularly evident between the mid-streak (MS) to late-streak (LS) stages within the posterior amniotic fold (paf). (E) Sagittal section through a MS/LS embryo. Low levels of β-gal activity within the extraembryonic mesoderm (arrow) are first detected at this stage, as the exocoelom (exo) begins to form. (F) Late-streak (LS) stage embryo. (G–L) Bmp4 expression during allantois development. lacZ expression is detected in the posterior accumulation of extraembryonic mesoderm that precedes overt allantois formation (asterisk in G) and within the allantoic bud (ab) and allantois (a) as it extends through the exocoelomic cavity. Expression also persists in the extraembryonic mesodermal components of the amnion (am), yolk sac (ysm), and chorion (cm) that line the exocoelom. (M,N) Bmp4lacZneo homozygous null embryo at the headfold (HF) stage. (M) Whole mount, lateral view. (N) Parasagittal section of M. Strong β-gal activity is detected in the amnion and yolk sac mesoderm, as well as in the accumulation of extraembryonic mesoderm (*) posterior to the primitive streak (ps). Anterior (A) is to the left in B–N. (c) Chorion; (xn) extraembryonic endoderm; (ES) early streak; (OB) no bud; (EB) early bud; (NP) neural plate; (LNP) late neural plate. Scale bars in A, 100 μm; in B for B–J, 200 μm; in K for K and L, 100 μm; in M for M and N, 200 μm.
Figure 7
Figure 7
(A–D) Sections of embryos from ICR × Bmp4lacZneo/+ matings stained for β-gal and AP activity. (A) Heterozygote, late streak (LS) stage. Sagittal section of posterior region at embryonic/extraembryonic junction. β-gal staining (arrowhead), representing Bmp4 expression, is present in mesothelial cells lining the exocoelom. Three AP-positive PGCs (arrow) (of a total of seven in this embryo) lie internal to the β-gal staining region and do not stain blue. (B) Wild type, late streak stage, sibling of embryo in A, sagittal section as in A. The cluster of 11 PGCs (arrow) at the base of the incipient allantois (arrowhead) is larger than in the heterozygote. There were 33 identifiable PGCs in this embryo. (C) Heterozygote, headfold (hf) stage. Transverse section at the level of the headfold (hf) and base of the allantois (a). (Dark field) β-Gal staining appears pink. There is strong β-gal activity in the periphery of the allantois but not in its core. (D) High power, bright-field view of part of C. β-Gal staining peripherally at the base of the allantois, but not in the AP-positive PGCs (arrow) lying more centrally. (E,F) Sections of R26.1 ES ↔ Bmp4tm1/+ × Bmp4tm1/+ chimeras stained for β-gal and AP activity: Wild-type ES cells stain blue. (E) Hindgut of a 75% chimeric wild-type embryo showing β-gal-positive PGCs (arrow) derived from the ES cells and a recipient-derived, β-gal-negative, PGC (arrowhead). (F) Sagittal section of 4S stage >95% chimeric homozygous null embryo on the (C57BL/6 × CBA) background. The epiblast derived cells are of wild-type, ES cell origin and have no detectable contribution from the mutant cells that are confined to the chorion ectoderm (c) and visceral yolk sac endoderm (ys). The phenotype is characteristically homozygous null with no allantois (arrowhead), no PGCs, small visceral yolk sac and defective yolk sac vascularization. AP staining in the embryonic ectoderm and chorionic ectoderm is independent of phenotype (cf. with A and B). (am) Amnion; (c) chorion; (h) heart; (ps) primitive streak; (vee) visceral extraembryonic endoderm. Scale bars in A–E, 50 μm; in F, 100 μm.
Figure 8
Figure 8
PGCs (estimated from histological sections) in chimeras of R26.1 ES cells with wild-type and Bmp4tm1/+ embryos. (A) Aggregation chimeras with (C57BL/6 × CBA) recipients. (B) Blastocyst injection chimeras with (129/SvEv × Black Swiss) recipients. (Open symbols, broken line) Wild-type recipients; (solid symbols, solid line) heterozygous recipients; (circles) nonchimeric; (squares) ≤25% chimeric; (triangles) >25%–50% chimeric; (diamond) >50%–75% chimeric; (four-pointed star) >75%–95% chimeric; (five pointed star) >95% chimeric. The number of PGCs in chimeric embryos falls within the distribution of the nonchimeric embryos of the same genotype, irrespective of the degree of chimerism. The plotted regression lines are for combined chimeric and nonchimeric embryos. The values in the regression equation (see legend to Fig. 4) are in A, (wild type) 2.165 = 1.876 + 0.0361 (8.0); (heterozygote) 1.631 = 1.205 + 0.0483 (8.8); B, (wild type) 2.364 = 1.976 + 0.0283 (13.7); (heterozygote) 2.155 = 1.775 + 0.0246 (15.4).
Figure 8
Figure 8
PGCs (estimated from histological sections) in chimeras of R26.1 ES cells with wild-type and Bmp4tm1/+ embryos. (A) Aggregation chimeras with (C57BL/6 × CBA) recipients. (B) Blastocyst injection chimeras with (129/SvEv × Black Swiss) recipients. (Open symbols, broken line) Wild-type recipients; (solid symbols, solid line) heterozygous recipients; (circles) nonchimeric; (squares) ≤25% chimeric; (triangles) >25%–50% chimeric; (diamond) >50%–75% chimeric; (four-pointed star) >75%–95% chimeric; (five pointed star) >95% chimeric. The number of PGCs in chimeric embryos falls within the distribution of the nonchimeric embryos of the same genotype, irrespective of the degree of chimerism. The plotted regression lines are for combined chimeric and nonchimeric embryos. The values in the regression equation (see legend to Fig. 4) are in A, (wild type) 2.165 = 1.876 + 0.0361 (8.0); (heterozygote) 1.631 = 1.205 + 0.0483 (8.8); B, (wild type) 2.364 = 1.976 + 0.0283 (13.7); (heterozygote) 2.155 = 1.775 + 0.0246 (15.4).
Figure 9
Figure 9
Two-signal model of Bmp4 regulation of PGC allocation. (A) Preprimitive streak stage. Bmp4 is produced by the extraembryonic ectoderm (xe) adjacent to the proximal epiblast (ep) and a gradient (blue arrows) is set up to which the proximal epiblast cells respond and become directed toward an allantois initiator/PGC fate (○). (A) Anterior; (P) posterior; (Pr) proximal; (D) distal. (B) Early primitive streak stage. Bmp4 continues to be produced by the extraembryonic ectoderm. The gradient can be steepened by the presence of the extracellular antagonists mCer-1 (red) anteriorly and follistatin (green) posteriorly. These may also limit the temporal window within which Bmp4 can act in the epiblast. Along with other epiblast cells, the allantois initiator/PGC progenitors divide with a generation time of 6.5–7.0 hr, and the progeny align toward and begin to move through the posterior streak. (C) Midstreak stage. Part of the newly formed extraembryonic mesoderm (xm) is derived from the most proximal epiblast and is specified to respond to the putative second signal (black arrows). This coincides with the onset of Bmp4 expression in the extraembryonic mesoderm. (D) Midstreak/late streak stage. By ∼E7.2, precursors have separated into allantois initiator (▴) and PGC (●) lineages.

Comment on

  • Signaling for germ cells.
    McLaren A. McLaren A. Genes Dev. 1999 Feb 15;13(4):373-6. doi: 10.1101/gad.13.4.373. Genes Dev. 1999. PMID: 10049351 No abstract available.

References

    1. Albano RM, Arkell R, Beddington RSP, Smith JC. Expression of inhibin subunits and follistatin during postimplantation mouse development: Decidual expression of activin and expression of follistatin in primitive streak, somites and hindbrain. Development. 1994;120:803–813. - PubMed
    1. Beddington RSP, Robertson EJ. An assessment of the developmental potential of embryonic stem cells in the midgestation mouse embryo. Development. 1989;105:733–737. - PubMed
    1. ————— Anterior patterning in the mouse. Trends Genet. 1998;14:277–284. - PubMed
    1. Belo JA, Bouwmeester T, Leyns L, Kertesz N, Gallo M, Follettie M, De Robertis EM. Cerberus-like is a secreted factor with neuralizing activity expressed in the anterior primitive endoderm of the mouse gastrula. Mech Dev. 1997;68:45–57. - PubMed
    1. Biben C, Stanley E, Fabri L, Kotecha S, Rhinn M, Drinkwater C, Lah M, Wang CC, Nash A, Hilton D, Ang SL, Mohun T, Harvey RP. Murine cerberus homologue mCer-1: A candidate anterior patterning molecule. Dev Biol. 1998;194:135–151. - PubMed

Publication types

Substances