. 1999 Jan;126(1):251-63.
doi: 10.1038/sj.bjp.0702283.

Effects of phrixotoxins on the Kv4 family of potassium channels and implications for the role of Ito1 in cardiac electrogenesis

Affiliations

Effects of phrixotoxins on the Kv4 family of potassium channels and implications for the role of Ito1 in cardiac electrogenesis

S Diochot et al. Br J Pharmacol. 1999 Jan.

Abstract

1. In the present study, two new peptides, phrixotoxins PaTx1 and PaTx2 (29-31 amino acids), which potently block A-type potassium currents, have been purified from the venom of the tarantula Phrixotrichus auratus. 2. Phrixotoxins specifically block Kv4.3 and Kv4.2 currents that underlie I(to1), with an 5 < IC50 < 70 nM, by altering the gating properties of these channels. 3. Neither are the Shaker (Kv1), Shab (Kv2) and Shaw (Kv3) subfamilies of currents, nor HERG, KvLQT1/IsK, inhibited by phrixotoxins which appear specific of the Shal (Kv4) subfamily of currents and also block I(to1) in isolated murine cardiomyocytes. 4. In order to evaluate the physiological consequences of the Ito1 inhibition, mice were injected intravenously with PaTx1, which resulted in numerous transient cardiac adverse reactions including the occurrence of premature ventricular beats, ventricular tachycardia and different degrees of atrioventricular block. 5. The analysis of the mouse electrocardiogram showed a dose-dependent prolongation of the QT interval, chosen as a surrogate marker for their ventricular repolarization, from 249 +/- 11 to 265 +/- 8 ms (P < 0.05). 6. It was concluded that phrixotoxins, are new and specific blockers of Kv4.3 and Kv4.2 potassium currents, and hence of I(to1) that will enable further studies of Kv4.2 and Kv4.3 channel and/or I(to1) expression.


Figures

Figure 1
Figure 1
Purification of phrixotoxins from Phrixotricus auratus venom. (A) Reverse phase HPLC chromatogram monitored at 220 nm illustrating the separation of 10 fractions – A–J – after loading 500 μl of diluted venom in a Beckman ODS C18 column. The stepwise solvent B (0.1% TFA in acetonitrile) gradient (from 15–30% over 60 min, from 30–35% over 10 min, then from 35–60% over 10 min) is indicated. Collected fractions E and F, active on Kv4.3 channels, are shaded. (B,C) Ion exchange chromatograms illustrating the second purification step for fractions PaE and PaF as described in ‘Methods'. A stepwise gradient for fraction PaE, from 50–70% over 15 min, then from 70–100% over 10 min of solvent D (ammonium acetate 1 M) was used and allowed the separation of five fractions. Activity against Kv4.3 channels was recovered in PaE5. The other active fraction PaF4 was purified from the fraction PaF with a linear gradient from 50–100% solvent D over 25 min. The effluent was monitored at 280 nm. (D, E) The fractions PaE5 and PaF4 were further purified on C18 reverse phase column with a linear solvent B gradient from 10–50% over 40 min.
Figure 2
Figure 2
PaTx1 and PaTx2 sequences. Homologies of phrixotoxins PaTx1 and PaTx2 with heteropodatoxins (HpTx1, HpTx2, and HpTx3) (Sanguinetti et al., 1997) from Heteropoda venatoria and with hanatoxins (HaTx1 and HaTx2) (Swartz & MacKinnon, 1997) from Grammostola spatulata. Black boxes indicate sequence identities, and grey boxes indicate sequence homologies.
Figure 3
Figure 3
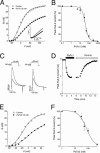
Effect of PaTx1 and PaTx2 on Kv4.3 currents. Kv4.3 currents were recorded in COS transfected cells in the whole-cell configuration. Holding potential: −80 mV. (A) Conductance-voltage relationship for Kv4.3 peak current measured before and during application of 50 nM PaTx1. Conductances were calculated with equation (1): G=I/(V−EK) where G is the conductance, I the amplitude of the peak current, V the test potential, EK the reversal potential for K+ (−85 mV). The Gmax value was evaluated from equation (2): G=Gmax/(1+exp(V0.5−V)/k) where V0.5 is the midpoint potential and k is the curve slope. In this example, the midpoint potential (V0.5) values in control conditions and after inhibition by 50 nM PaTx1 were of −7 and +17 mV respectively. The Gmax values were 30 and 21 nS before and after PaTx1 inhibition. Inset: Current-voltage curve. Currents were induced by a set of depolarizing pulses at −60 to +120 mV in 10 mV increments. (B) Concentration-response relationship for PaTx1 block of the Kv4.3 current at −10 mV. The IC50 value is 28 nM. The effects of 0.1 nM to 1 μM phrixotoxin on Kv4.3 currents were tested at −10 mV from a holding potential of −80 mV. The dose response curve was fitted by equation (3): I=Imax+(Imin−Imax)/(1+exp(C−IC50)/k)) where I is the amplitude of the peak current, Imax and Imin are the amplitudes of the current corresponding to control and saturating concentrations of phrixotoxins respectively, C is the concentration of the toxin, IC50 is the concentration of toxin which correspond to 50% Imax and k is the curve slope. Each point is the mean±s.e.mean of data from 3–6 cells. (C) Effect of 50 nM PaTx1 on Kv4.3 currents, recorded at a test pulse of −10 and +20 mV respectively, on the same cell. More blockade of Kv4.3 current by PaTx1 occurred at −10 mV (62%) than at 20 mV (51%). (D) Time course for Kv4.3 peak-current block with 50 nM PaTx1 at +20 mV and reversibility. The kinetics of current inhibition were fitted with equation (4): I=Ires+Imaxexp(−t/τi) where I is the amplitude of the peak current relative to time (t), Imax is the initial peak current, Ires is the non inactivating component and τi is the time constant of inhibition. τi value is 0.57 ms. (E) Conductance-voltage relationship for Kv4.3 peak current measured before and during application of 100 nM PaTx2. (F) Concentration-response relationship for PaTx2 block of the Kv4.3 current at −10 mV. Each point is the mean±s.e.mean of data from 3–5 cells. The IC50 value determined from equation (3) is 71 nM.
Figure 4
Figure 4
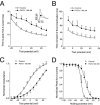
Effects of PaTx1 on the kinetics of activation and inactivation of Kv4.3 currents. Kv4.3 currents were all recorded in COS transfected cells in the whole cell configuration. The holding potential is −80 mV. (A) The time-to-peak current is represented against the test potential for Kv4.3 channel before and after inhibition of the current by 100 nM PaTx1. The inset shows the effect of PaTx1 at +20 mV. (B) The time constant of current inactivation is plotted against the test potential for Kv4.3 channel before and after inhibition of the current by 100 nM PaTx1. The decay of current inactivation was fitted according to equation (4). (C) Normalized conductance-voltage relationships for Kv4.3 currents in control and after inhibition by 100 nM PaTx1. Relative conductances were obtained after normalization with the Gmax value. Points are means±s.e.mean of data from four cells. (D) Steady-state inactivation curves for Kv4.3 currents evoked at +30 mV before and after their inhibition by 50 nM PaTx1. 10 s conditioning prepulses from −120 to +10 mV were applied prior to 200 ms depolarizing pulses to +30 mV. The same protocol was used after inhibition of Kv4.3 currents by PaTx1 at a concentration of 50 nM. The steady-state inactivation curves were fitted according to equation (3). Each point is the mean after normalization of Kv4.3 peak current amplitude from six cells.
Figure 5
Figure 5
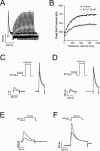
Voltage dependent inhibition of Kv4.3 channels by PaTx1. Kv4 currents were recorded in COS transfected cells in the whole-cell configuration. The holding potential was −80 mV. (A) Successive traces illustrating recovery from Kv4.3 channel inactivation in control conditions. The corresponding fit for the peak Kv4.3 current evoked at +10 mV is superimposed with the traces. (B) Peaks Kv4.3 currents were plotted against the interpulse interval in control and after inhibition by 30 nM of PaTx1. The time constant for recovery from channel inactivation was determined using a double pulse protocol where cells were depolarized from −80 mV to +10 mV for 200 ms with increasing interpulse intervals of time at −80 mV (dt=20 ms). Peak currents elicited by depolarizing pulses were plotted as a function of time and data points were fitted to equation (5): I=Ires+Imax(1−exp−t/τr) where I is the peak current elicited by the second pulse, Imax is the amplitude of peak current elicited by the test pulse after recovery at −80 mV for 20 s. Ires is the amplitude of the residual current remaining at the end of the first pulse, t the interval of time between the first and the second test pulses at +10 mV and τr the time constant of recovery. PaTx1 was tested at a concentration of 30 nM on the Kv4.3 current in order to block at least 50% of the current. Fit curves are shown and corresponding values for τr are: 199 ms in control and 185 ms after PaTx1 inhibition. (C) Effect of 50 nM PaTx1 on Kv4.3 current at high depolarizations to +130 mV. To test whether PaTx1 was still bound to the channel after large depolarizations, a test pulse to +130 mV was applied 700 ms after a 150 ms depolarization to −10 mV from a holding potential of −80 mV, in the absence (control) and in the presence of the toxin. In this example, the Kv4.3 current is inhibited by PaTx1 at −10 mV by 60% and at +130 mV by 18%. (D) In another example, using the same protocol as in (C), the Kv4.3 current is inhibited by PaTx1 at −10 mV by 63% and not at all at +130 mV. (E) PaTx1 is able to block the Kv4.3 channel in a closed state. The membrane potential was maintained at −80 mV during 2 min in the presence of a concentration of PaTx1 (50 nM), known to block 70% of the Kv4.3 current, before applying a depolarizing pulse to −10 mV. The inhibition of the current was measured after applying the toxin for 2 min to obtain the steady-state inhibition. Under a 2 min perfusion of 50 nM of PaTx1 at −80 mV, the Kv4.3 current is inhibited by 60% as early as the first stimulation to −10 mV. (F) PaTx1 can block the Kv4.3 channel in an inactivated state. The interaction of the toxin with the inactivated state of the channel was tested using a membrane potential maintained at −40 mV. After 2 min of superfusion with 50 nM PaTx1, the membrane potential was clamped to −80 mV during 700 ms for recovery from inactivation, followed by a depolarizing pulse to −10 mV. Comparison to control values assessed the degree of blockade. Under a 2 min perfusion of 50 nM of PaTx1 at −40 mV, the Kv4.3 current was inhibited by 70% as early as the first stimulation to −10 mV.
Figure 6
Figure 6
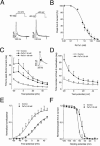
Effect of PaTx1 and PaTx2 on Kv4.2 currents. Kv4.2 currents were recorded in COS transfected cells in the whole-cell configuration. Holding potential: −80 mV. (A) Effect of 50 nM PaTx1 on Kv4.2 currents, recorded at a test pulse of −10 mV and +20 mV respectively, on the same cell. More blockade of Kv4.2 current by PaTx1 occurred at −10 mV (79%) than at +20 mV (67%). (B) Concentration-response relationship for PaTx1 block of the Kv4.2 current at −10 mV. Each point is the mean±s.e.mean of data from 3–7 cells. The IC50 value determined from equation (3) is 5 nM. (C) The time-to-peak current is represented against the test potential for Kv4.2 channel before and after inhibition of the current by 30 and 100 nM PaTx1. The inset shows the effect of 30 nM PaTx1 at 20 mV. (D) The time constant of current inactivation is plotted against the test potential for Kv4.2 channel before and after inhibition of the current by 30 nM PaTx1. (E) Normalized conductance-voltage relationships for Kv4.2 currents in control and after inhibiton by 50 nM PaTx1. Points are means±s.e.mean of data from three cells. (F) Steady-state inactivation curves for Kv4.2 currents evoked at +30 mV before and after their inhibition by 30 nM PaTx1. Each point is the mean after normalization of Kv4.2 peak current amplitude from 7–9 cells.
Figure 7
Figure 7
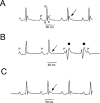
Electrocardiographic modifications induced by intravenous injections of PaTx1 in mice. (A) A representative lead I surface control ECG, recorded from a Balb C female by Pclamp Software (Axon). P, Q, R and T describe the P wave (atrial depolarization), the PR interval (atrio-ventricular conduction), QRS wave (ventricular depolarization) and the biphasic T wave (ventricular repolarization). The cycle length (RR) on the upper trace is 130 ms, with a PR at 37.5 ms, and QT at 62 ms. (B) ECG recorded 3 min after the intravenous injection of 12 nmol of PaTx1. The QT interval increased to 71 ms. A significant decrease of the fast component of the T wave occurred (arrow) and typical premature ventricular beats appeared (•). (C) The T wave modifications progressively reversed 20 min after the injection of PaTx1.
Figure 8
Figure 8
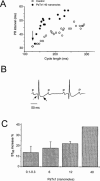
Electrocardiographic modifications induced by high concentrations of PaTx1 in mice. (A) Plot of the PR-RR relationships in a representative mouse, obtained during two successive anaesthesia, in control conditions and after injecting of 40 nmol of PaTx1. After anaesthesia induction, the heart rate progressively decrease, and the PR interval was prolonged accordingly, reflecting the AV conduction. Within seconds after the intravenous injection of PaTx1 (arrow), the PR interval abruptly increased. (B) A typical second degree atrio-ventricular block occurred 2 min after the injection of 40 nmol of PaTx1 with myocardial infarction. Note the Q wave and the huge negative T wave (arrows). (C), Dose-effect relationship of PaTx1 and the resulting increase in ST50 measured 5 min after the injection (n=11).

Similar articles

Cited by

References

    1. AIYAR J., WITHKA J.M., RIZZI J.P., SINGLETON D.H., ANDREWS G.C., LIN W., BOYD J., HANSON D.C., SIMON M., DETHLEFS B., LEE C., HALL J.E., GUTMAN G.A., CHANDY K.G. Topology of the pore-region of a K+ channel revealed by the NMR-derived structures of scorpions toxins. Neuron. 1995;15:1169–1181. - PubMed
    1. ATTALI B. Ion channels A new wave for heart rhythms. Nature. 1996;384:24–25. - PubMed
    1. BAGETTA G., NISTICO G., DOLLY J.O. Production of seizures and brain damage in rats by α-dendrotoxin, a selective K+ channel blocker. Neurosci. Lett. 1992;139:24–40. - PubMed
    1. BALDWIN T.J., TSAUR M.-L., LOPEZ G.A., JAN Y.N., JAN L.Y. Characterization of a mammalian cDNA for an inactivating voltage-sensitive K+ channel. Neuron. 1991;7:471–483. - PubMed
    1. BARHANIN J., LESAGE F., GUILLEMARE E., FINK M., LAZDUNSKI M., ROMEY G. KvLQT1 and Isk (minK) proteins associate to form the IKs cardiac potassium current. Nature. 1996;384:78–80. - PubMed

Publication types

MeSH terms

LinkOut - more resources