. 1999 Jan;126(1):269-79.
doi: 10.1038/sj.bjp.0702270.

Modulation of chloride, potassium and bicarbonate transport by muscarinic receptors in a human adenocarcinoma cell line

Affiliations

Modulation of chloride, potassium and bicarbonate transport by muscarinic receptors in a human adenocarcinoma cell line

N D Holliday et al. Br J Pharmacol. 1999 Jan.

Abstract

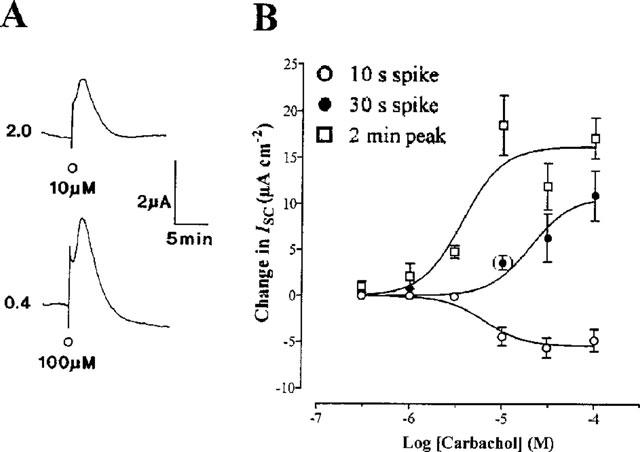
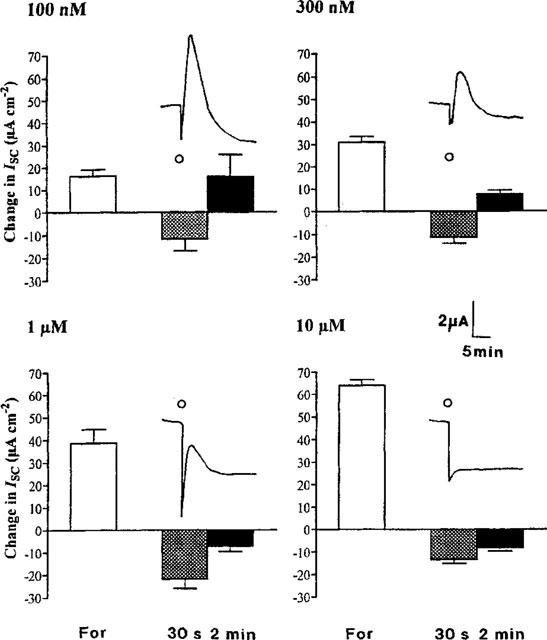
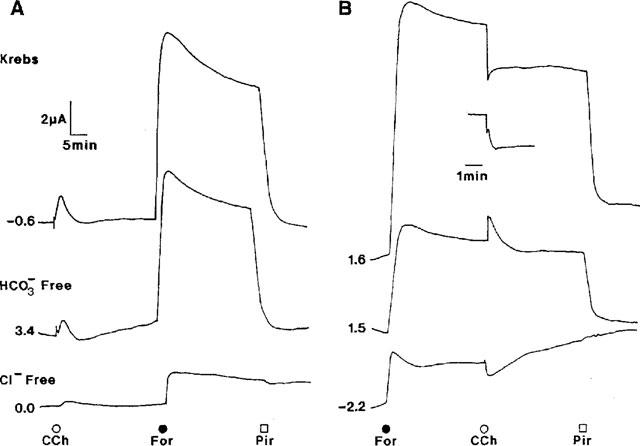
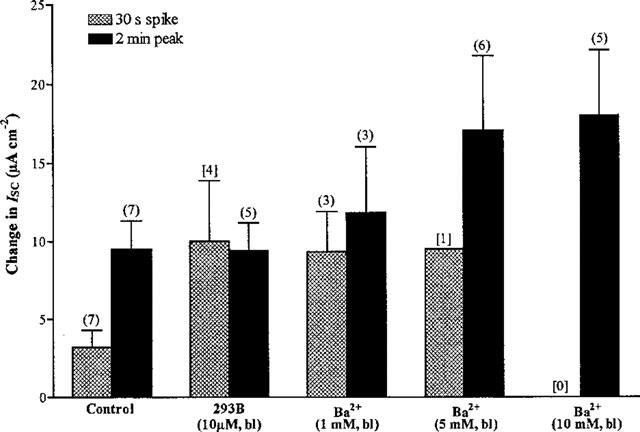
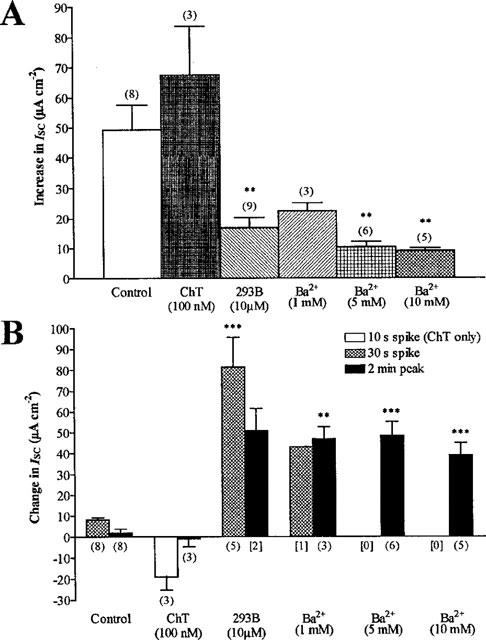
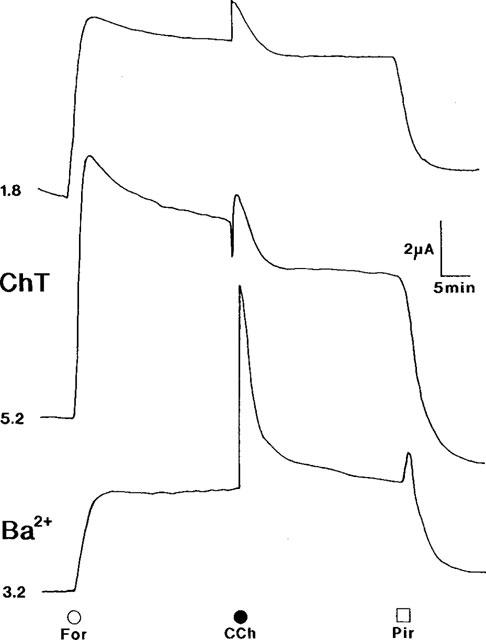
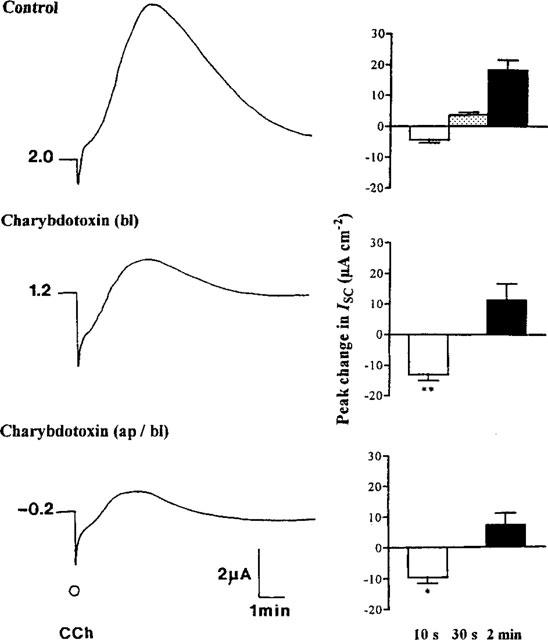
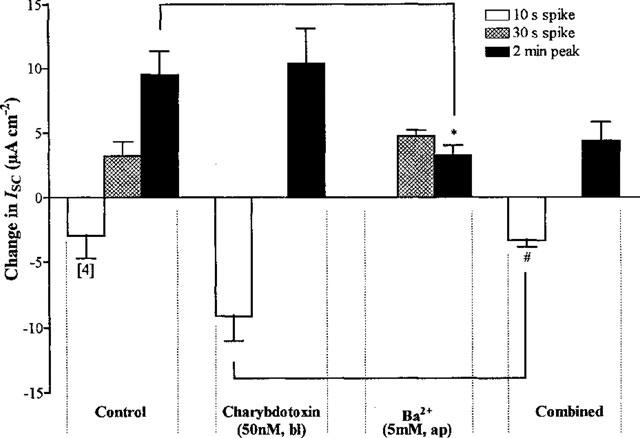
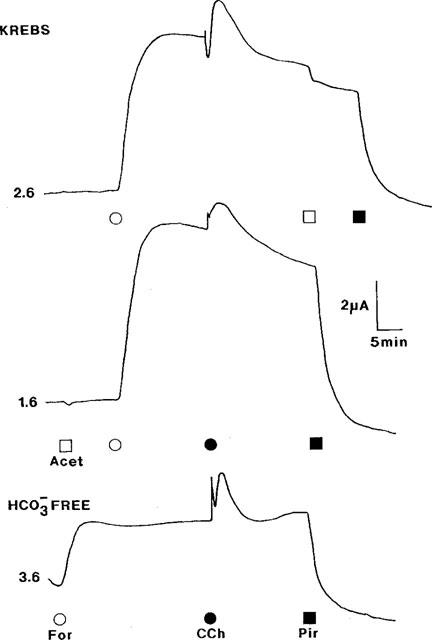
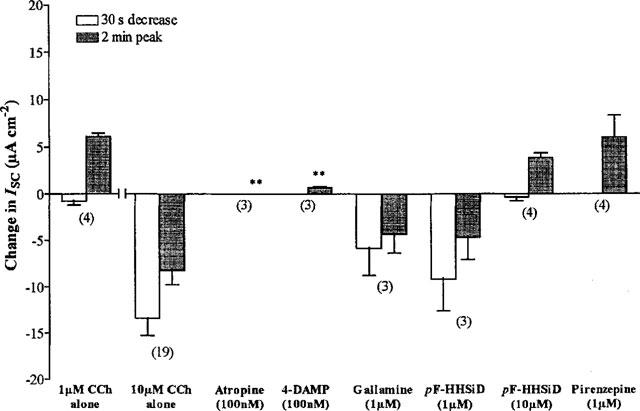
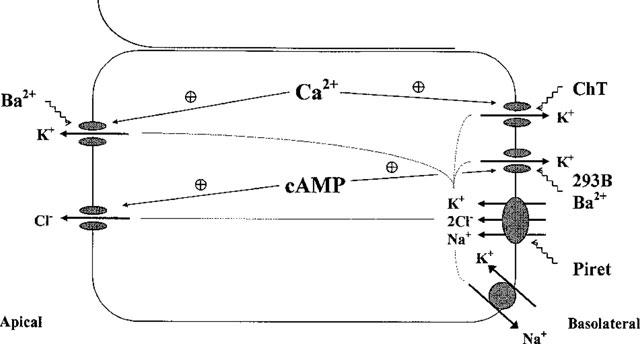
1. Short-circuit current (I(SC)) responses to carbachol (CCh) were investigated in Colony 1 epithelia, a subpopulation of the HCA-7 adenocarcinoma cell line. In Krebs-Henseleit (KH) buffer, CCh responses consisted of three I(SC) components: an unusual rapid decrease (the 10 s spike) followed by an upward spike at 30 s and a slower transient increase (the 2 min peak). This response was not potentiated by forskolin; rather, CCh inhibited cyclic AMP-stimulated I(SC). 2. In HCO3- free buffer, the decrease in forskolin-elevated I(SC) after CCh was reduced, although the interactions between CCh and forskolin remained at best additive rather than synergistic. When Cl- anions were replaced by gluconate, both Ca2+- and cyclic AMP-mediated electrogenic responses were significantly inhibited. 3. Basolateral Ba2+ (1-10 mM) and 293B (10 microM) selectively inhibited forskolin stimulation of I(SC), without altering the effects of CCh. Under Ba2+- or 293B-treated conditions, CCh responses were potentiated by pretreatment with forskolin. 4. Basolateral charybdotoxin (50 nM) significantly increased the size of the 10 s spike of CCh responses in both KH and HCO3- free medium, without affecting the 2 min peak. The enhanced 10 s spike was inhibited by prior addition of 5 mM apical Ba2+. Charybdotoxin did not affect forskolin responses. 5. In epithelial layers prestimulated with forskolin, the muscarinic antagonists atropine and 4-diphenylacetoxy-N-methylpiperidine methiodide (4-DAMP, both at 100 nM) abolished subsequent 10 microM CCh responses. Following addition of p-fluoro hexahydro-sila-difenidol (pF-HHSiD, 10 microM) or pirenzepine (1 microM), qualitative changes in the CCh response time-profile also indicated a rightward shift of the agonist concentration-response curve; however, 1 microM gallamine had no effect. These results suggest that a single M3-like receptor subtype mediates the secretory response to CCh. 6. It is concluded that CCh and forskolin activate discrete populations of basolateral K+ channels gated by either Ca2+ or cyclic AMP, but that the Cl- permeability of the apical membrane may limit their combined effects on electrogenic Cl- secretion. In addition, CCh activates a Ba2+-sensitive apical K+ conductance leading to electrogenic K+ transport. Both agents may also modulate HCO3- secretion through a mechanism at least partially dependent on carbonic anhydrase.


Figures

Figure 1
Figure 1
Responses to CCh in Colony 1 epithelial layers. (A) shows representative traces in which Colony 1 cells in KH buffer were stimulated with 10 μM (upper trace) or 100 μM (lower trace) CCh, with initial baseline currents (in μA) given to the left of each example. In (B) single additions of increasing CCh concentration (0.3–100 μM; n=4–14) are represented as a series of concentration response relationships showing the 10 s downward spike, the 30 s spike and the 2 min transient increase in ISC. A separate 30 s component could not be distinguished after 3 μM CCh and was observed in only a minority of cases (4 out of 14, bracketed value) after 10 μM agonist. EC50 values are quoted in the text.
Figure 2
Figure 2
The effect of forskolin stimulation on CCh-induced changes in ISC. Histograms show the increases in ISC after four different concentrations of forskolin (For) in epithelia bathed in KH solution (100 nM–10 μM; n=4–76; open bars) and the responses to 10 μM CCh added 30 min subsequently, summarized as the 30 s peak decrease in ISC (hatched bars) and the maximum at 2 min after agonist addition relative to initial levels (solid bars). Example traces are given as an inset to each histogram, with CCh added at the time indicated.
Figure 3
Figure 3
CCh and forskolin responses in Krebs, HCO3- and Cl-free buffers. (A) The effects of CCh (10 μM), forskolin (10 μM; For) and piretanide (200 μM; Pir) at 30 min intervals are shown in representative traces from cells bathed in KH, HCO3 free or Cl substituted solutions. In (B), the order of agonist addition is reversed, and an inset to the uppermost trace (KH buffer) displays the changes in ISC after CCh on an extended time-scale to highlight the additional spike component present in the response. Basal ISC is given in μA to the left of each trace.
Figure 4
Figure 4
The effect of 293B and Ba2+ on CCh stimulation. Epithelial layers in HCO3 free buffer were pretreated for 10 min with basolateral 293B (10 μM) or Ba2+ (as BaCl2, 1–10 mM) followed by 10 μM CCh. The 30 s spike, where clearly defined, and the 2 min peak increase in ISC are illustrated; the 10 s spike was rarely observed (not shown). N values (rounded brackets) or the number of times a component was observed (square brackets) are given above each bar.
Figure 5
Figure 5
Inhibition of forskolin-induced ISC increases by K+ channel blockade and the subsequent effects on CCh stimulation. (A) illustrates the effect on 10 μM forskolin responses of 10 min pretreatment with basolateral charybdotoxin (ChT, 100 nM), 293B (10 μM) or Ba2+ (1–10 mM). (B) shows the responses to 10 μM CCh added 30 min after forskolin in the same experiments, with each bar representing the 10 s spike (charybdotoxin treated cells only), 30 s spike and 2 min peak. The total number of observations or the frequency of individual components are indicated in round and square brackets respectively; **P<0.01 and ***P<0.001 compared to controls.
Figure 6
Figure 6
Forskolin and CCh responses in the presence of charybdotoxin or Ba2+. Example experiments from Colony 1 epithelia in HCO3 free buffer show the effect of 10 min pretreatment with either 50 nM charybdotoxin (ChT) or 1 mM Ba2+ compared to untreated cells (upper trace). Agents were added at the following concentrations: forskolin (10 μM; For), CCh (10 μM) and piretanide (200 μM; Pir). Initial ISC levels are indicated on the left (in μA) of each representative trace.
Figure 7
Figure 7
Alteration of CCh responses by charybdotoxin. Representative traces illustrate the CCh-induced changes in ISC from the basal levels indicated, in control cells in KH solution or in those incubated with basolateral (bl) or both apical (ap) and basolateral charybdotoxin (50 nM) for 10 min. To the right of each trace, the histograms show the size of the 10 s spike (open bars), 30 s spike (shaded bars) or the 2 min increase in ISC (solid bars). Significant differences between control values (n=14) and those in charybdotoxin-pretreated cells (both n=3) are indicated by *P<0.05 and **P<0.01.
Figure 8
Figure 8
Inhibition of CCh-stimulated changes in ISC by apical Ba2+ and charybdotoxin. The histogram shows the separate phases of 10 μM CCh responses in untreated cells in HCO3 free solution (control, n=9) or those exposed to 50 nM basolateral (bl) charybdotoxin (n=4), 5 mM apical (ap) Ba2+ (n=4) or both treatments (n=4) for 10 min. Note that the 10 s spike component of the control group was present in only 4 out of 9 observations, and that the 30 s spike was absent in charybdotoxin-treated cells. Significant differences are indicated as follows: *P<0.05 compared to control cells; #P<0.05 compared to pretreatment with charybdotoxin only.
Figure 9
Figure 9
The effect of acetazolamide pretreatment. Example traces show the effect of acetazolamide addition (450 μM, added apically and basolaterally; Acet) on forskolin (300 nM; For) and CCh responses (10 μM) in KH compared with those from otherwise untreated cells bathed in either KH, or HCO3 free buffer (lowest trace only). Piretanide (200 μM, Pir) was added at the end of each experiment. Basal ISC (in μA) in each recording is indicated on the left.
Figure 10
Figure 10
Inhibition of CCh responses by muscarinic antagonists. CCh (10 μM) was added to epithelia bathed in KH solution and prestimulated for 30 min with forskolin (10 μM), with the exception of a separate data group where 1 μM CCh controls are included solely for comparison. Antagonists were applied at the concentrations indicated 10 min prior to the addition of 10 μM CCh, and the subsequent peak changes in ISC in each case are represented by open (initial 30 s decrease) and shaded bars (2 min peak). Responses were compared either with control increases in ISC after 1 μM CCh (atropine, 4-DAMP, pF-HHSiD (10 μM) and pirenzepine), or with control decreases in ISC after 10 μM CCh (gallamine, 1 μM pF-HHSiD). Significant differences are highlighted by asterisks (**P<0.01); numbers in parenthesis denote n values.
Figure 11
Figure 11
Proposed model for epithelial K+ and Cl secretion in Colony 1 epithelia. The diagram indicates the apical and basolateral membrane conductances that are at present sufficient to explain the observed changes in ISC after either carbachol or forskolin in HCO3 free buffer, and the effects on these responses of the range of K+ channel blockers tested. Elevation of cyclic AMP levels activates basolateral Ba2+- and 293B-sensitive K+ channels, creating a favourable electrochemical gradient for Cl exit through an apical cyclic AMP-gated Cl conductance. Na+ ions, which enter via the Na+/K+/2Cl cotransporter inhibited by piretanide (Piret), recycle across the basolateral membrane through the Na+/K+ ATPase. Ca2+-mediated agonists increase electrogenic Cl secretion by opening a separate basolateral K+ conductance inhibited by charybdotoxin (ChT), but also activate a population of apical K+ channels that may at least be partially sensitive to Ba2+, allowing electrogenic K+ secretion. The existence of these apical channels underlies the distinctive biphasic responses to carbachol that are observed after basolateral blockade by charybdotoxin. In Krebs solution, increases in both the cyclic AMP and Ca2+ ion concentration may also modulate bicarbonate transport (not shown), as described in the text.

Similar articles

Cited by

References

    1. BAJNATH R.B., DEKKER K., VAANDRAGER A.B., DE JONGE H.R., GROOT J.A. Biphasic increase of apical Cl− conductance by muscarinic stimulation of HT-29cl.19A human colon carcinoma cell line: evidence for activation of different Cl− conductances by carbachol and forskolin. J. Membr. Biol. 1992;127:81–94. - PubMed
    1. BINDER H.J., SANDLE G.I.Electrolyte transport in the mammalian colon Physiology of the Gastrointestinal Tract 1994New York, Raven Press; 2133–2171.ed. Johnson, L.R., Alpers, D.H., Christensen, J., Jacobsen, E.D. & Walsh, J.H. pp
    1. BLEICH M., RIEDEMANN N., WARTH R., KERSTAN D., LEIPZIGER J., HÖR M., VAN DRIESSCHE W., GREGER R. Ca2+ regulated K+ and non-selective cation channels in the basolateral membrane of rat colonic crypt base cells. Pflügers Arch. 1996;432:1011–1022. - PubMed
    1. BORNSTEIN J.C., FURNESS J.B. Correlated electrophysical and histo-chemical studies of submucous neurons and their contribution to understanding enteric neuronal circuits. J. Autonom. Nerv. System. 1988;25:1–13. - PubMed
    1. BUSCH A.E., SUESSBRICH H. Role of the IsK protein in the IminK channel complex. TiPs. 1997;18:26–29. - PubMed

Publication types

MeSH terms

Substances

LinkOut - more resources