. 1999 Mar 2;96(5):2135-40.
doi: 10.1073/pnas.96.5.2135.

Dynamic and quantitative Ca2+ measurements using improved cameleons

Affiliations

Dynamic and quantitative Ca2+ measurements using improved cameleons

A Miyawaki et al. Proc Natl Acad Sci U S A. .

Abstract

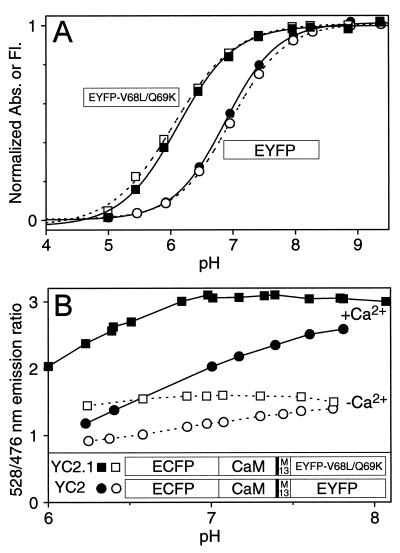
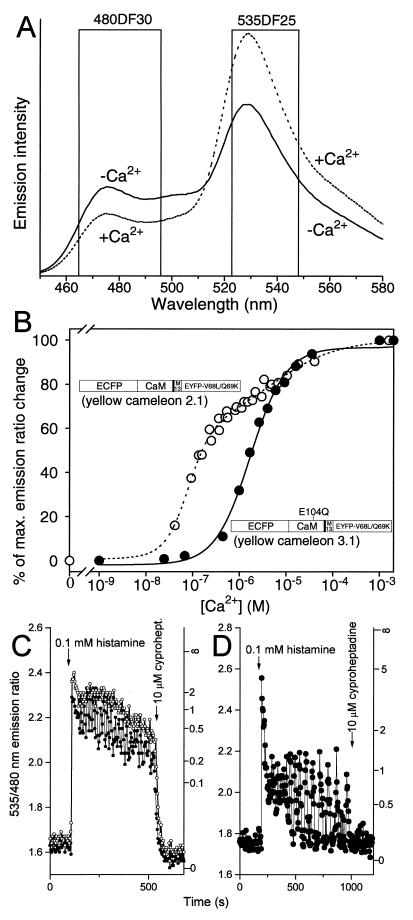
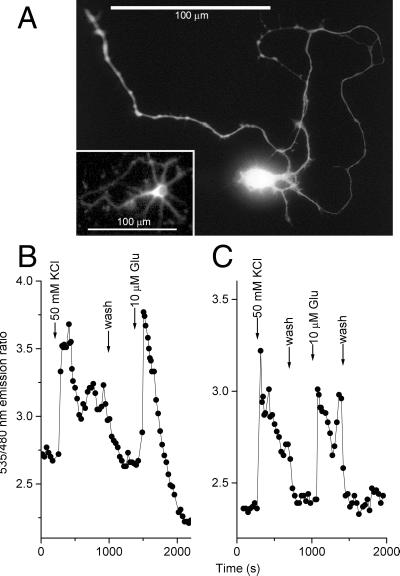
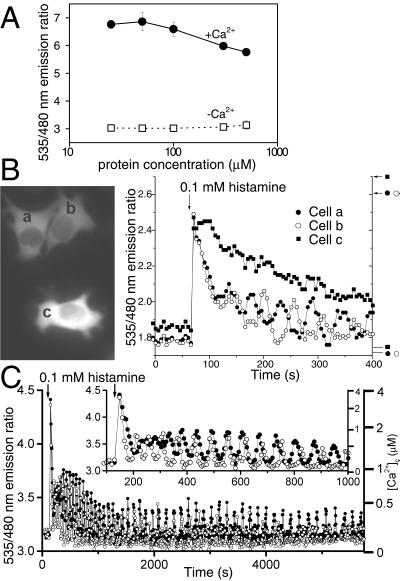
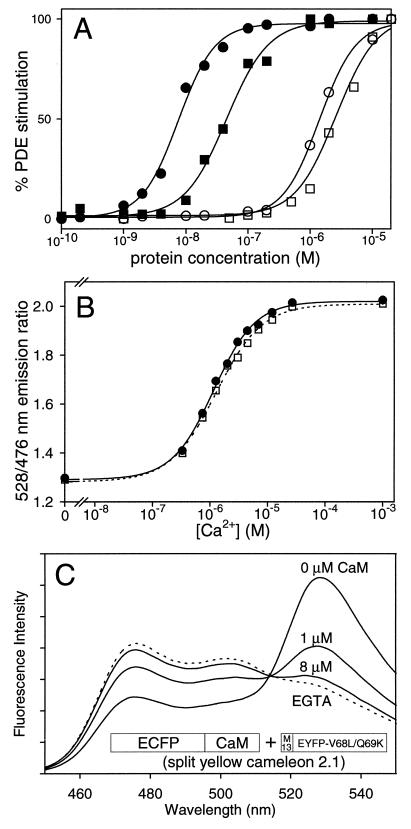
Cameleons are genetically-encoded fluorescent indicators for Ca2+ based on green fluorescent protein variants and calmodulin (CaM). Because cameleons can be targeted genetically and imaged by one- or two-photon excitation microscopy, they offer great promise for monitoring Ca2+ in whole organisms, tissues, organelles, and submicroscopic environments in which measurements were previously impossible. However, the original cameleons suffered from significant pH interference, and their Ca2+-buffering and cross-reactivity with endogenous CaM signaling pathways was uncharacterized. We have now greatly reduced the pH-sensitivity of the cameleons by introducing mutations V68L and Q69K into the acceptor yellow green fluorescent protein. The resulting new cameleons permit Ca2+ measurements despite significant cytosolic acidification. When Ca2+ is elevated, the CaM and CaM-binding peptide fused together in a cameleon predominantly interact with each other rather than with free CaM and CaM-dependent enzymes. Therefore, if cameleons are overexpressed, the primary effect is likely to be the unavoidable increase in Ca2+ buffering rather than specific perturbation of CaM-dependent signaling.


Figures

Figure 1
Figure 1
(A) pH-dependency of normalized amplitudes of 514 nm absorbance (■, ●) and 528 nm emission (□, ○; excitation was at 510 nm) of EYFP (○, ●) and EYFP-V68L/Q69K (■, □). EYFP-V68L/Q69K is synonymous with “10C Q69K” (15). During the titrations, no shift in absorbance or emission maximum was observed. (B) pH-dependency of YC2 (●, ○ ) and YC2.1 (■, □). The emission ratios (528/476 nm) were measured in the presence of 100 μM CaCl2 (■, ●) or 100 μM EGTA (□, ○) at various pHs. (Inset) Schematic structures of YC2.1 and YC2.
Figure 2
Figure 2
(A) Emission spectra of YC2.1 (excited at 432 nm) with 100 μM EGTA (solid line) and 100 μM CaCl2 (dotted line) at pH 7.3. Nominal bandpasses for ECFP (480DF30) and EYFP-V68L/Q69K (535DF25) emission filters are indicated by boxes. (B) Ca2+ titration curves of YC2.1 (○) and YC3.1 (●), with domain structures of these proteins overlaid. E104Q denotes mutation of the conserved bidentate glutamic acid to glutamine at position 12 of the third Ca2+-binding loop of CaM. The data points were from four independent experiments using Ca2+/EGTA and Ca2+/N-(hydroxyethyl)ethylenediamine-N,N′,N′-triacetate buffer systems (30). The changes in emission ratio (528/476 nm) were normalized to the effects of full Ca2+ saturation, which were 90–100% increases in ratio over the value at zero Ca2+. (C and D) Typical Ca2+ transients reported by 40–60 μM YC2.1 (C) and YC3.1 (D) in HeLa cells induced by 0.1 mM histamine. A 480 ± 25 nm bandpass filter was used for ECFP emission. The sampling interval was 4–5 sec. The right-hand ordinates calibrate [Ca2+]c in μM.
Figure 3
Figure 3
Measurement of [Ca2+]c in hippocampal neurons using YCs. (A) Individual neuron expressing YC2.1 for 24 h, digitized from a photomicrograph. (Inset) The actual cell monitored in C; resolution was reduced by the 2 × 2 binning of the camera. (B and C): [Ca2+]c in individual cultured hippocampal neurons (7 days in vitro) 24 h after transfection with YC2 (B) or YC2.1 (C). Note the pH artifact in A after stimulation with 10 μM glutamate, resulting in an apparent drop of the emission ratio.
Figure 4
Figure 4
(A) Concentration effects on emission ratios of YC2.1 in a cuvette at pH 7.3 in the presence of 100 μM CaCl2 (●) and 100 μM EGTA (□). Each data point represents the mean of 10–15 determinations. (B) The effects of two different concentrations of YC3.1 on histamine-induced Ca2+ transients in HeLa cells. Indicator concentrations were estimated to be 150 μM in cells a and b and 500 μM in cell c. (Left) Fluorescence images of the three cells. (Right) Time courses of emission ratios from cells a (●), b (○), and c (■). The arrows and horizontal bars on the right indicate Rmax and Rmin, respectively. (C) Oscillations in [Ca2+]c induced by 0.1 mM histamine in two HeLa cells expressing 40 μM YC3.1. ECFP emission was read with a 480 ± 15 nm filter. (Inset) The initial response on an expanded time scale.
Figure 5
Figure 5
Interaction of intact and split cameleons with PDE and CaM. (A) The relative level of PDE stimulation is shown as a function of the concentration of recombinant CaM (●), split YC2.1 (■), YC2.1 (○), and YC3.1 (□). (B) Ca2+ dependency of YC3.1 (0.3 μM) in the absence (■) and presence (□) of excess CaM (3 μM). The titrations were done by using a Ca2+/N-(hydroxyethyl)ethylenediamine-N, N′,N′-triacetate buffer system (30) at pH 7.1 (C) Emission spectra of split YC2.1 (1 μM) with 100 μM EGTA (dotted line), and with 1 mM CaCl2 (solid lines) when preincubated with 0, 1, and 8 μM CaM. Also shown is the schematic structure of split YC2.1, the equimolar mixture of ECFP-CaM and M13-EYFP-V68L/Q69K.

References

    1. Tsien R Y. Annu Rev Neurosci. 1989;12:227–253. - PubMed
    1. Brini M, Marsault R, Bastianutto C, Alvarez J, Pozzan T, Rizzuto R. J Biol Chem. 1995;270:9896–9903. - PubMed
    1. Miyawaki A, Llopis J, Heim R, McCaffery J M, Adams J A, Ikura M, Tsien R Y. Nature (London) 1997;388:882–887. - PubMed
    1. Porumb T, Yau P, Harvey T S, Ikura M. Protein Eng. 1994;7:109–115. - PubMed
    1. Ikura M, Clore G M, Gronenborn A M, Zhu G, Klee C B, Bax A. Science. 1992;256:632–638. - PubMed

Publication types

MeSH terms

LinkOut - more resources