. 1999 Mar 2;96(5):2333-8.
doi: 10.1073/pnas.96.5.2333.

Imaging adenoviral-directed reporter gene expression in living animals with positron emission tomography

Affiliations

Imaging adenoviral-directed reporter gene expression in living animals with positron emission tomography

S S Gambhir et al. Proc Natl Acad Sci U S A. .

Abstract

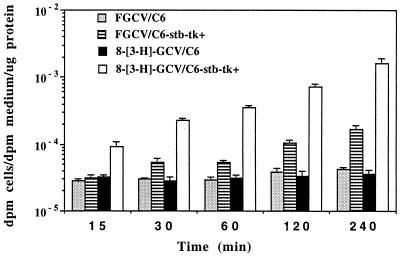
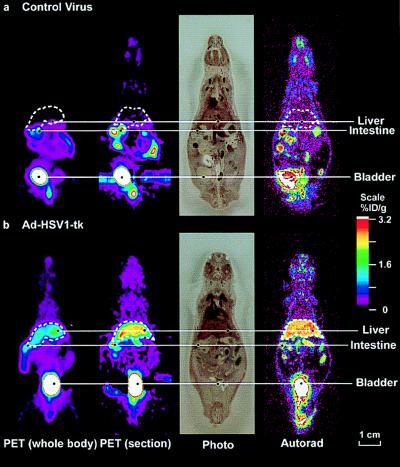
We are developing quantitative assays to repeatedly and noninvasively image expression of reporter genes in living animals, using positron emission tomography (PET). We synthesized positron-emitting 8-[18F]fluoroganciclovir (FGCV) and demonstrated that this compound is a substrate for the herpes simplex virus 1 thymidine kinase enzyme (HSV1-TK). Using positron-emitting FGCV as a PET reporter probe, we imaged adenovirus-directed hepatic expression of the HSV1-tk reporter gene in living mice. There is a significant positive correlation between the percent injected dose of FGCV retained per gram of liver and the levels of hepatic HSV1-tk reporter gene expression (r2 > 0.80). Over a similar range of HSV1-tk expression in vivo, the percent injected dose retained per gram of liver was 0-23% for ganciclovir and 0-3% for FGCV. Repeated, noninvasive, and quantitative imaging of PET reporter gene expression should be a valuable tool for studies of human gene therapy, of organ/cell transplantation, and of both environmental and behavioral modulation of gene expression in transgenic mice.


Figures

Figure 1
Figure 1
8-[3H]GCV and FGCV accumulation in cells expressing HSV1-tk. C6 control cells and C6-stb-tk+ were incubated with either 8-[3H]GCV or FGCV for up to 240 min. Results are for net accumulation of each tracer (log scale) in both cell types as a function of time. Bars represent SE based on triplicate determinations.
Figure 2
Figure 2
FGCV metabolites present in livers of mice expressing HSV1-tk. A mouse was injected with 1.0 × 10⁹ pfu of AdCMV-HSV1-tk virus followed by injection of FGCV 48 h later and sacrifice 180 min later. HPLC analysis of the liver sample shows peaks corresponding to ≈3, ≈9, ≈16, and ≈32 min, which likely represent FGCV, FGCV-monophosphate, FGCV-diphosphate, and FGCV-triphosphate, respectively. Thirty percent of the radioactivity retained in the liver was present in the DNA/RNA fraction (not shown).
Figure 3
Figure 3
MicroPET and DWBA images of mice after AdCMV-HSV1-tk and control virus administration. Swiss–Webster mice were injected via the tail vein with 1.5 × 10⁹ pfu of control virus (a) or 1.5 × 10⁹ pfu of AdCMV-HSV1-tk virus (b). For each mouse, a whole-body mean coronal projection image of the fluorine-18 activity distribution is displayed on the left. The liver outline, in white, was determined from both the FGCV signal and cryostat slices. The second images from the left are coronal sections, approximately 2-mm thick, from the microPET. After their PET scans, the mice were killed, frozen, and sectioned. The next images are photographs of the tissue sections (45-μm thickness) corresponding to approximately the midthickness of the microPET coronal section. The images on the right are DWBA of these tissue sections. The color scale represents the FGCV %ID/g. Images are displayed on the same quantitative color scale to allow signal intensity comparisons among them.
Figure 4
Figure 4
FGCV retention in liver as a function of HSV1-tk gene expression. Fourteen adult Swiss–Webster mice were injected by tail vein with 0–2.0 × 10⁹ pfu of AdCMV-HSV1-tk virus and additional control virus to maintain the total viral burden to be fixed to 2.0 × 10⁹ pfu. Forty-eight (±1) hours later, animals received a tail vein injection of FGCV. Animals were sacrificed 180 min later. Livers were removed and liver samples were analyzed for (i) fluorine-18 retained in tissue, (ii) HSV1-tk mRNA levels normalized to glyceraldehyde-3-phosphate dehydrogenase, and (iii) HSV1-TK enzyme levels. (A) HSV1-TK enzyme levels vs. HSV1-tk mRNA levels (y = 0.76x + 0.30, r2 = 0.81). (B) FGCV %ID/g liver vs. HSV1-tk mRNA levels (y = 0.71x + 0.44, r2 = 0.81). (C) FGCV %ID/g liver vs. HSV1-TK enzyme activity (y = 0.79x + 0.31, r2 = 0.71). Each point represents data from a different mouse.

References

    1. Jacobs W R, Barletta R G, Udani R, Chan J, Kalkut G, Sosne G, Kieser T, Sarkis G J, Hatfull G F, Bloom B R. Science. 1993;260:819–822. - PubMed
    1. Misteli T, Spector D. Nat Biotechnol. 1997;15:961–964. - PubMed
    1. Barrio J R. Biochemical Principles in Radiopharmaceutical Design and Utilization. New York: Raven; 1986.
    1. Phelps M E. Neurochem Res. 1991;16:929–940. - PubMed
    1. Gambhir, S. S., Barrio, J. R., Herschman, H. R. & Phelps, M. E. (1999) J. Nucl. Cardiol., in press. - PubMed

Publication types

MeSH terms

LinkOut - more resources