. 1999 Mar 15;19(6):1895-911.
doi: 10.1523/JNEUROSCI.19-06-01895.1999.

Differential distribution of three members of a gene family encoding low voltage-activated (T-type) calcium channels

Affiliations

Differential distribution of three members of a gene family encoding low voltage-activated (T-type) calcium channels

E M Talley et al. J Neurosci. .

Abstract

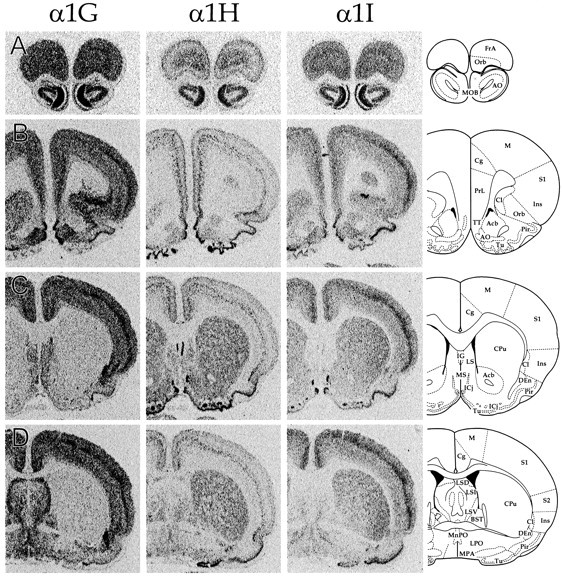
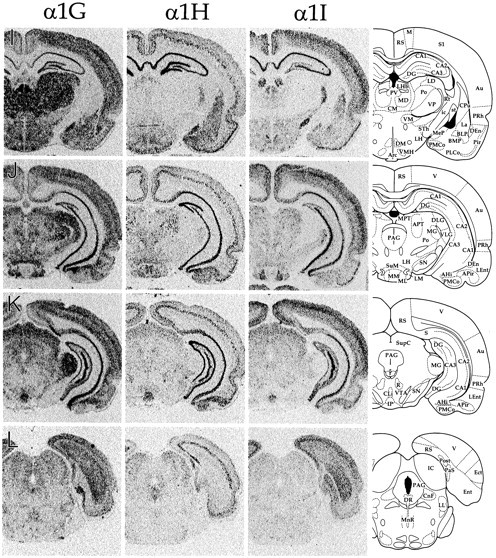
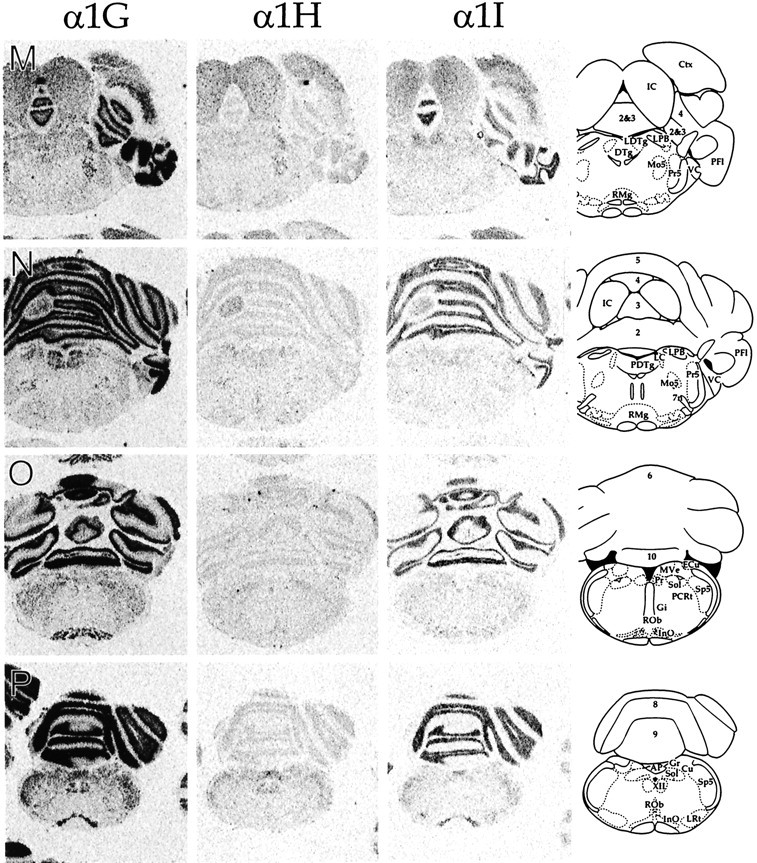
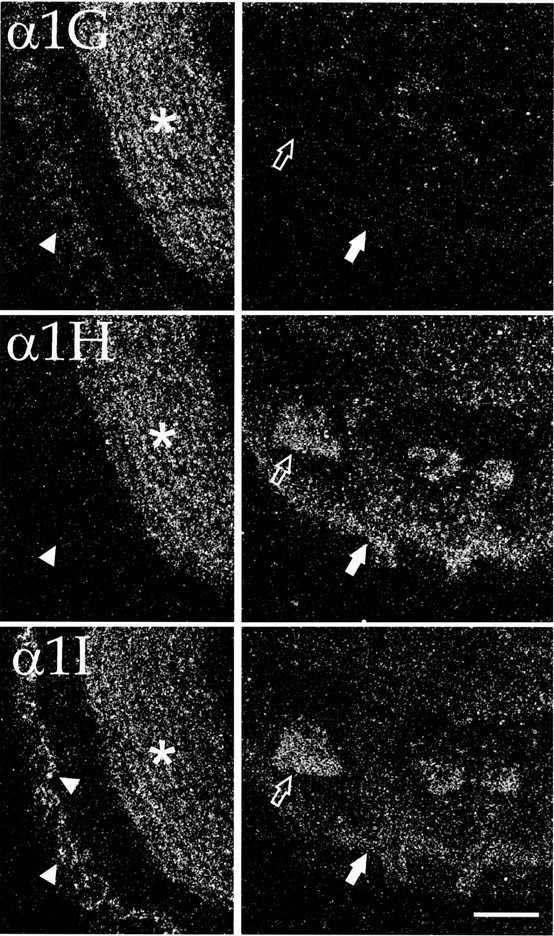
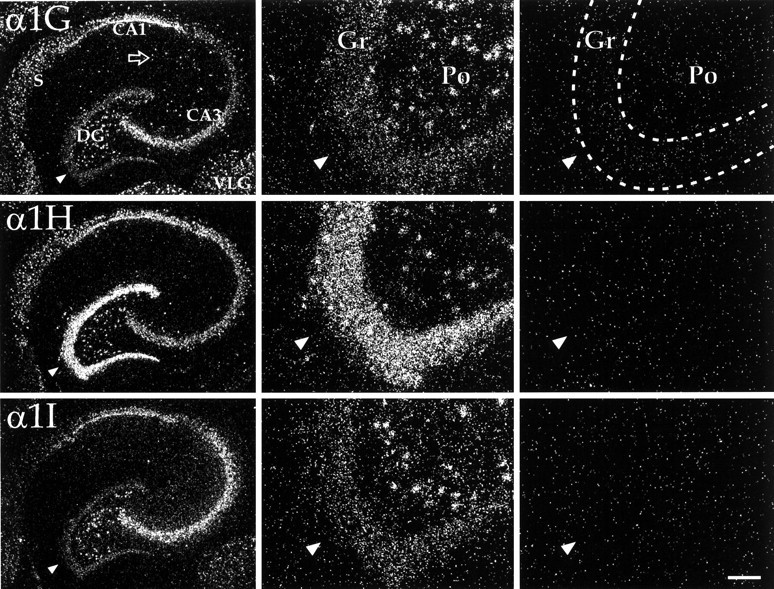
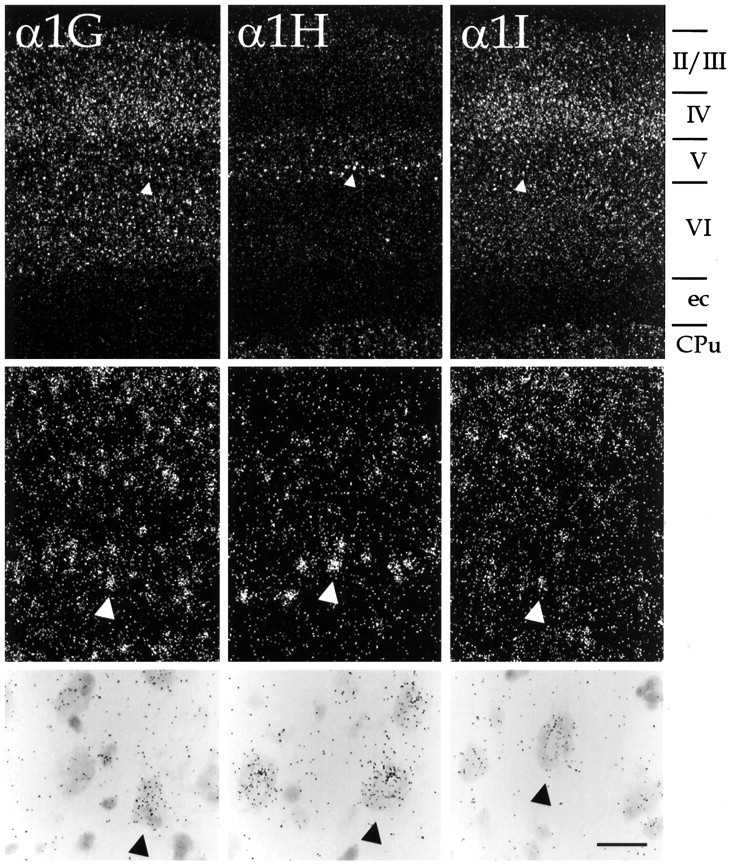
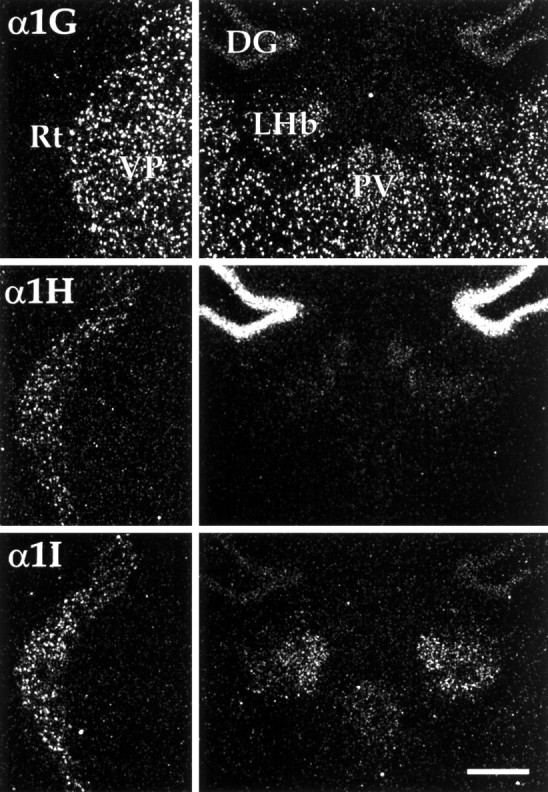
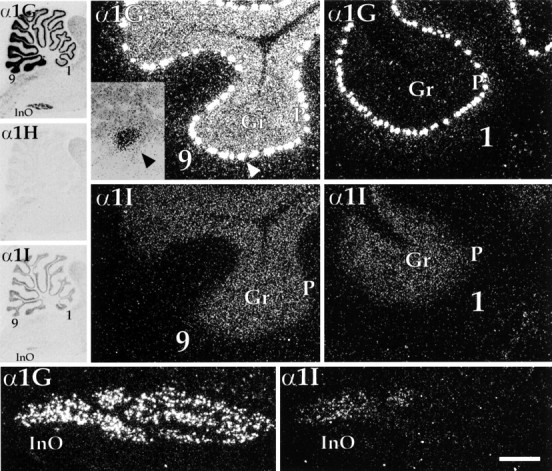
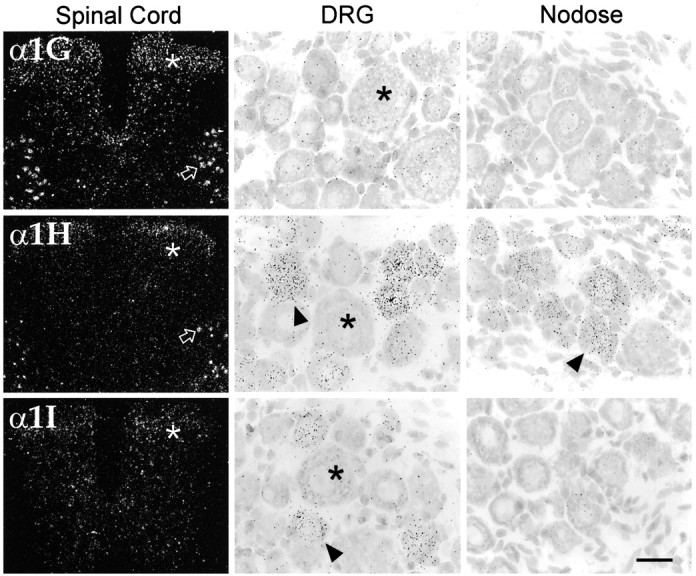
Low voltage-activated (T-type) calcium currents are observed in many central and peripheral neurons and display distinct physiological and functional properties. Using in situ hybridization, we have localized central and peripheral nervous system expression of three transcripts (alpha1G, alpha1H, and alpha1I) of the T-type calcium channel family (CaVT). Each mRNA demonstrated a unique distribution, and expression of the three genes was largely complementary. We found high levels of expression of these transcripts in regions associated with prominent T-type currents, including inferior olivary and thalamic relay neurons (which expressed alpha1G), sensory ganglia, pituitary, and dentate gyrus granule neurons (alpha1H), and thalamic reticular neurons (alpha1I and alpha1H). Other regions of high expression included the Purkinje cell layer of the cerebellum, the bed nucleus of the stria terminalis, the claustrum (alpha1G), the olfactory tubercles (alpha1H and alpha1I), and the subthalamic nucleus (alpha1I and alpha1G). Some neurons expressed high levels of all three genes, including hippocampal pyramidal neurons and olfactory granule cells. Many brain regions showed a predominance of labeling for alpha1G, including the amygdala, cerebral cortex, rostral hypothalamus, brainstem, and spinal cord. Exceptions included the basal ganglia, which showed more prominent labeling for alpha1H and alpha1I, and the olfactory bulb, the hippocampus, and the caudal hypothalamus, which showed more even levels of all three transcripts. Our results are consistent with the hypothesis that differential gene expression underlies pharmacological and physiological heterogeneity observed in neuronal T-type calcium currents, and they provide a molecular basis for the study of T-type channels in particular neurons.


Figures

Fig. 1.
Fig. 1.
CNS distribution of CaVT gene expression. Sections were hybridized with oligonucleotides specific for α1G (left panels), α1H (middle panels), and α1I (right panels) and exposed to autoradiographic film. Line drawings on the far rightare adapted from Paxinos and Watson (1997; reproduced with permission) and indicate the relevant labeled areas. For abbreviations, refer to Table 2.
Fig. 1.
Fig. 1.
CNS distribution of CaVT gene expression. Sections were hybridized with oligonucleotides specific for α1G (left panels), α1H (middle panels), and α1I (right panels) and exposed to autoradiographic film. Line drawings on the far rightare adapted from Paxinos and Watson (1997; reproduced with permission) and indicate the relevant labeled areas. For abbreviations, refer to Table 2.
Fig. 2.
Fig. 2.
Dark-field micrographs demonstrating cellular labeling of olfactory structures. Slides were exposed to autoradiographic emulsion; silver grains were imaged using dark-field microscopy. Left panels show silver grains over cells of the main olfactory bulb. Note that whereas all three transcripts were present in the granule cell layer (asterisks), labeling of small neurons in the glomerular layer (arrowheads) was limited to α1G and α1I. Right panels show the olfactory tubercles. Labeling for α1H and α1I was very high in the cell islands of Calleja (open arrows); labeling was also high for α1H but only moderate for α1I in the dense cell layer of the tubercles (closed arrows). Scale bar, 500 μm.
Fig. 3.
Fig. 3.
Dark-field micrographs of horizontal sections through the ventral portion of the hippocampus. Left panels show cross sections in the horizontal plane through the ventral hippocampus. Note that whereas all three transcripts were present, each had a different relative distribution through the various hippocampal fields. Fields CA1 and CA3 are indicated, as are the dentate gyrus (DG), the subiculum (S), and the ventral lateral geniculate nucleus (VLG) of the thalamus. Open arrow points to α1G-labeled (presumably nonpyramidal) cells in stratum radiatum. The dentate gyrus is shown at higher magnification in the middle panels. Note that the granule cell layer (Gr,arrowheads in all three sets of panels) shows particularly strong labeling for α1H, whereas cells of the polymorph layer (Po) show more even levels of the three transcripts. Right panels show images of the dentate gyrus from control sections hybridized in the presence of ∼500-fold excess cold oligonucleotide. Note that this nonspecific labeling was uniformly low. Scale bar, 400 μm (left panels); 100 μm (middle and right panels).
Fig. 4.
Fig. 4.
Differential hybridization to neurons in the cerebral cortex. Distribution of α1G, α1H, and α1I mRNA in the primary somatosensory cortex is shown at increasing levels of magnification. Top panels demonstrate laminar distribution of labeling; the relevant cortical layers (layers II-VI) are indicated to the right of these panels, as are the external capsule (ec) and the striatum (CPu). Arrowheads indicate large (presumably pyramidal) neurons in layer V. The same neurons are depicted at higher magnification in the middle panels(using dark-field optics) and at still higher magnification inbottom panels (using bright-field optics). Note that α1G and α1I were found in all cortical layers, but expression of α1H was for the most part restricted to layer V. Scale bar, 400 μm (top panels); 100 μm (middle panels); 25 μm (bottom panels).
Fig. 5.
Fig. 5.
Distribution of CaVT expression in the thalamus. Left panels show differential labeling of the thalamic reticular nucleus (Rt) and ventral posterior thalamic nucleus (VP). Note that neurons of the reticular nucleus contained α1H and α1I mRNA, whereas α1G expression was limited to thalamic relay nuclei, including VP.Right panels show labeling in the habenulae and midline thalamic nuclei. Neurons of the lateral habenular nucleus (LHb) expressed α1G and α1I mRNA (see Results for details). DG, Dentate gyrus; PV, paraventricular thalamic nucleus. Scale bar, 250 μm.
Fig. 6.
Fig. 6.
Parasagittal sections demonstrating labeling of the cerebellum and inferior olivary nucleus. Left panelsshow bright-field images of film autoradiograms exposed to sagittal sections through the brainstem and cerebellum. Lobules 9 and 1 of the cerebellar vermis are indicated and correspond to higher magnification dark-field micrographs of emulsion-dipped sections shown on theright. Note that for α1G, the granule cell layer (Gr) of the cerebellum displayed a rostrocaudal gradient of expression, with lobule 9 labeled intensely and lobule 1 showing very low levels. In contrast, expression of α1I in the granule cell layer was fairly uniform throughout the cerebellum and showed similar levels in both lobules. Probes for α1G labeled Purkinje neurons (P) at extremely high levels. One of these neurons (arrowhead) is depicted at higher power using bright-field optics (inset). The inferior olivary nucleus (InO) also is indicated in the autoradiograms and corresponds to dark-field images in the bottom panels. Labeling of this structure also was heterogeneous: α1G was uniformly high; labeling for α1I was limited to the caudal part of the nucleus. Scale bar, ∼4.8 mm (left panels); 250 μm (right panels); 50 μm (inset); 400 μm (bottom panels).
Fig. 7.
Fig. 7.
Differential accumulation of CaVT transcripts in the spinal cord and sensory ganglia. Left panels show low-power dark-field images of transverse sections through the lumbar spinal cord. All three transcripts were present in the dorsal horn (asterisks), with α1H mRNA limited to neurons of the external lamina. Note also that α1G and α1H were expressed in motor neurons in the ventral horn (open arrows). Middle panels show high-power bright-field images of dorsal root ganglia (DRG) neurons. Probes for α1H and α1I labeled small- and medium-sized neurons (arrowheads); in contrast, large neurons (asterisks) were unlabeled. In the nodose ganglia (right panels) expression was for the most part limited to α1H (arrowhead). Scale bar, 400 μm (left panels); 25 μm (middle and right panels).

References

    1. Akaike N. T-type calcium channels in mammalian CNS neurones. Comp Biochem Physiol. 1991;98C:31–40. - PubMed
    1. Bal T, McCormick DA. Mechanisms of oscillatory activity in guinea-pig nucleus reticularis thalami in vitro: a mammalian pacemaker. J Physiol (Lond) 1993;468:669–691. - PMC - PubMed
    1. Bhalla US, Bower JM. Exploring parameter space in detailed single neuron models: simulations of the mitral and granule cells of the olfactory bulb. J Neurophysiol. 1993;69:1948–1965. - PubMed
    1. Catterall WA. Structure and function of voltage-gated ion channels. Annu Rev Biochem. 1995;64:493–531. - PubMed
    1. Coulter DA, Huguenard JR, Prince DA. Calcium currents in rat thalamocortical relay neurones: kinetic properties of the transient, low-threshold current. J Physiol (Lond) 1989a;414:587–604. - PMC - PubMed

Publication types

LinkOut - more resources