. 1999 Mar 15;19(6):1912-21.
doi: 10.1523/JNEUROSCI.19-06-01912.1999.

Cloning and expression of a novel member of the low voltage-activated T-type calcium channel family

Affiliations

Cloning and expression of a novel member of the low voltage-activated T-type calcium channel family

J H Lee et al. J Neurosci. .

Abstract

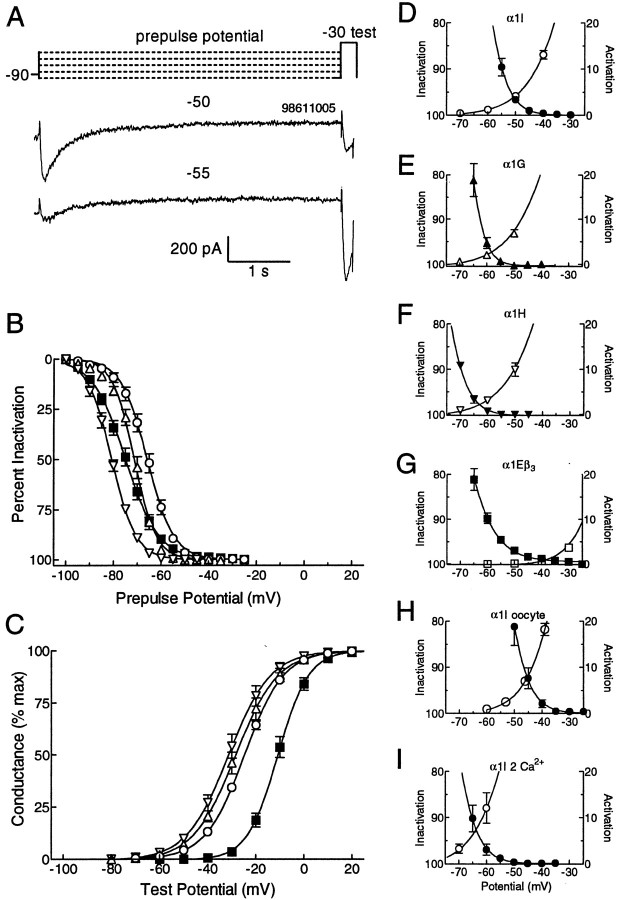
Low voltage-activated Ca2+ channels play important roles in pacing neuronal firing and producing network oscillations, such as those that occur during sleep and epilepsy. Here we describe the cloning and expression of the third member of the T-type family, alpha1I or CavT.3, from rat brain. Northern analysis indicated that it is predominantly expressed in brain. Expression of the cloned channel in either Xenopus oocytes or stably transfected human embryonic kidney-293 cells revealed novel gating properties. We compared these electrophysiological properties to those of the cloned T-type channels alpha1G and alpha1H and to the high voltage-activated channels formed by alpha1Ebeta3. The alpha1I channels opened after small depolarizations of the membrane similar to alpha1G and alpha1H but at more depolarized potentials. The kinetics of activation and inactivation were dramatically slower, which allows the channel to act as a Ca2+ injector. In oocytes, the kinetics were even slower, suggesting that components of the expression system modulate its gating properties. Steady-state inactivation occurred at higher potentials than any of the other T channels, endowing the channel with a substantial window current. The alpha1I channel could still be classified as T-type by virtue of its criss-crossing kinetics, its slow deactivation (tail current), and its small (11 pS) conductance in 110 mM Ba2+ solutions. Based on its brain distribution and novel gating properties, we suggest that alpha1I plays important roles in determining the electroresponsiveness of neurons, and hence, may be a novel drug target.


Figures

Fig. 1.
Fig. 1.
Primary structure and predicted topology of the rat α1I (CavT.3). A, Schematic showing the location of the restriction enzyme sites and clones used for constructing the full-length cDNA. The cDNA construct was assembled from the following clones: λgt10 clone RF17, NgoM1 (−124)/AvrII (1354); PCR clone number 13,AvrII (1354)/BglII (1893); PCR clone number 2, BglII (1893)/BamHI (3357); a synthetic pair of oligonucleotides, BamHI (3357)/HindIII(3386); PCR clone b,HindIII(3386)/ApaLI (4327); and λgt10 clone ME4, ApaLI (4327)/EcoRI (polylinker). B, Deduced amino acid sequence of the rat α1I T-type calcium channel. Residues conserved among the rat α1I, rat α1G, and the human α1H are shown in capitalized bold letters. Putative membrane-spanning regions are markedabove the sequence. Analysis of the α1I protein sequence with a modified Prosite database identified the following: four cAMP-dependent protein kinase phosphorylation motifs (R/K-R/K-x-S/T or R/K-R/K-x-x-S/T) all located in the intracellular loops (marked above site with the lettera); 18 protein kinase C motifs (S/T-x-R/K), eight of which are located intracellularly (marked with c); one tyrosine phosphorylation motif (R/K-x-x-x-D-x-x-Y) located at the start of IIS1 (marked with y), and seven N-linked glycosylation motifs (N-x-S/T), five of which are in extracellular loops (marked with n). C, Schematic of the α1I channel showing relationship of loops to the plasma membrane. Each amino acid residue is represented by a circle. For diagrammatic purposes, the membrane-spanning regions are modeled as α helices.
Fig. 2.
Fig. 2.
Distribution of α1I mRNA by Northern blot analysis. A rat multiple-tissue blot was probed with32P-labeled α1I (nucleotides 5142–6197) and exposed for 5 d. Size markers are indicated on the right in kilobases. The faint 8 kb bands in kidney and liver were only observed in one experiment and may be caused by contamination of the probe with sequence encoding repeat IV leading to cross-hybridization with α1H (Cribbs et al., 1998). Alternatively, these bands may represent cross-hybridization with a distinct mRNA.
Fig. 3.
Fig. 3.
Comparison of the α1I currents to cloned α1G, α1H, and α1Eβ3 channel currents. Currents were evoked by step depolarizations to varying test potentials from a holding potential of −90 mV. Currents were measured in stably transfected HEK-293 cells using the ruptured patch-clamp method with 10 mm Ba2+ as the charge carrier. Also shown are results from Xenopus oocytes expressing α1I.A, α1I currents expressed in HEK-293 cells andXenopus oocytes were compared with α1G and α1H currents expressed in HEK-293 cells. Currents from the peak of the current–voltage relationship have been scaled and superimposed. Data were taken from the same cells shown in panelsBF. B, Representative current traces recorded from oocytes injected with α1I-cRNA. Currents were evoked during test pulses that incremented 7 mV with each episode.CF, Representative currents from HEK-293 cells stably transfected with either α1I (C), α1G (D), α1H (E), or α1Eβ3(F). Currents were elicited by depolarizing 10 mV steps from −90 mV.
Fig. 4.
Fig. 4.
Comparison of the current–voltage (IV) relationships of α1I to those of α1G, α1H, and α1Eβ3. Symbols representing each cloned channel are the same in Figures 4-6: α1G (▵), α1H (▿), α1I (○), and α1Eβ3 (▪). A, Average peak currents elicited during test pulses to the indicated potentials. Data represent the mean ± SEM from the following number of cells: α1G (n = 8), α1H (n = 6), α1I (n = 10), and α1Eβ3(n = 10). B, The data inA were normalized to the peak current observed for each cell then averaged. Also shown is the average data obtained with oocytes injected with α1I (●; n = 12).C, Integral of the current measured during each test pulse is plotted as a function of test potential. Representative cells were chosen that each expressed 1 nA current at the peak of theI–V.
Fig. 5.
Fig. 5.
Comparison of the kinetic properties of α1I with those of α1G, α1H, α1I, and α1Eβ3.A, B, Currents elicited during theI–V protocol were fit with two exponentials. Average activation (A) and inactivation (B) tau values are plotted as a function of test potential. All currents were recorded from HEK-293 cells, except for the data represented by ●, which are from oocytes injected with α1I. Data represent the mean ± SEM from the following number of cells: α1G (▵, n = 8), α1H (▿,n = 6), α1I (○, n = 10), α1I in oocytes (●, n = 15), and α1Eβ3 (▪, n = 14).C, D, Representative tail currents from cells expressing either α1I (C) or α1Eβ3 (D). Currents were evoked by test pulses to either −20 (α1I) or 0 (α1Eβ3) mV, followed by repolarization to −100 mV. Vertical scale bar represents 1 (C) or 5 nA (D).E, Data obtained in C andD were fit with a single exponential. Average deactivation time constants of α1I (n = 4) and α1Eβ3 (n = 4) tail currents were plotted as a function of repolarization potential.
Fig. 6.
Fig. 6.
Comparison of steady-state inactivation, activation, and window currents of α1I to those of α1G, α1H, and α1Eβ3. A, The voltage protocol used to measure inactivation is shown above representative traces obtained during prepulses to −50 and −55 mV. The protocol also included a short 5 msec repolarization to −90 mV at the end of the prepulse. The time between episodes was 15 sec. B, Average percent inactivation was plotted as a function of prepulse voltage. The average data were fit with the Boltzmann equation (smooth curves). Data represent the mean ± SEM from the following number of observations: α1G (▵,n = 6), α1H (▿, n = 8), α1I (○, n = 7), and α1Eβ3 (▪,n = 12). C, Conductance was calculated using the Goldman–Hodgkin–Katz equation. The data were averaged, then fit with the Boltzmann equation (smooth curves). Data represent the mean ± SEM from the following number of observations: α1G (n = 8), α1H (n = 6), α1I (n = 8), and α1Eβ3 (n = 14).D–I, Activation and inactivation curves shown inB and C were overlapped and expanded to show window currents. Data for α1I (D), α1G (E), α1H (F), α1Eβ3 (G), and α1I expressed in oocytes (H) were recorded in 10 mm Ba2+ solutions. Also shown are data obtained using 2 mm Ca2+ as the charge carrier from HEK-293 cells stably transfected with α1I (I). Smooth curvesrepresent Boltzmann fits to the all the activation data points and to inactivation data points that were >50%.
Fig. 7.
Fig. 7.
Single-channel currents of α1I measured fromXenopus oocytes using the cell-attached patch-clamp method. A, Representative traces from a single patch displaying full and subconductance openings of α1I. The voltage protocol contained a prepulse to +20 mV followed by a test pulse to −30 mV. B, Channel openings and closings were idealized using Transit to determine the amplitude of channel openings. Data are taken from the same patch shown in A. C, Single-channel conductance of α1I currents. The amplitudes of single channels were obtained from Gaussian fits to amplitude histograms of idealized openings. The amplitudes were plotted against test potential. Slope conductances were calculated by linear regression through all the data points. Data were obtained from five patches on four oocytes.Filled symbols represent full conductance states, whereas open symbols represent subconductance states measured from the same patch.

References

    1. Altschul SF, Gish W, Miller W, Myers EW, Lipman DJ. Basic local alignment search tool. J Mol Biol. 1990;215:403–410. - PubMed
    1. Bech-Hansen NT, Naylor MJ, Maybaum TA, Pearce WG, Koop B, Fishman GA, Mets M, Musarella MA, Boycott KM. Loss-of-function mutations in a calcium-channel α1-subunit gene in Xp11.23 cause incomplete X-linked congenital stationary night blindness. Nat Genet. 1998;19:264–267. - PubMed
    1. Bourinet E, Zamponi GW, Stea A, Soong TW, Lewis BA, Jones LP, Yue DT, Snutch TP. The α1E calcium channel exhibits permeation properties similar to low-voltage-activated calcium channels. J Neurosci. 1996;16:4983–4993. - PMC - PubMed
    1. Carbone E, Lux HD. Single low-voltage-activated calcium channels in chick and rat sensory neurones. J Physiol (Lond) 1987;386:571–601. - PMC - PubMed
    1. Catterall WA. Structure and function of voltage-gated ion channels. Annu Rev Biochem. 1995;64:493–531. - PubMed

Publication types

Associated data