Ion binding and permeation through the lepidopteran amino acid transporter KAAT1 expressed in Xenopus oocytes
- PMID: 10066900
- PMCID: PMC2269195
- DOI: 10.1111/j.1469-7793.1999.729ab.x
Ion binding and permeation through the lepidopteran amino acid transporter KAAT1 expressed in Xenopus oocytes
Abstract
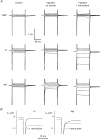
1. The transient and steady-state currents induced by voltage jumps in Xenopus oocytes expressing the lepidopteran amino acid co-transporter KAAT1 have been investigated by two-electrode voltage clamp. 2. KAAT1-expressing oocytes exhibited membrane currents larger than controls even in the absence of amino acid substrate (uncoupled current). The selectivity order of this uncoupled current was Li+ > Na+ approximately Rb+ approximately K+ > Cs+; in contrast, the permeability order in non-injected oocytes was Rb+ > K+ > Cs+ > Na+ > Li+. 3. KAAT1-expressing oocytes gave rise to 'pre-steady-state currents' in the absence of amino acid. The characteristics of the charge movement differed according to the bathing ion: the curves in K+ were strongly shifted (> 100 mV) towards more negative potentials compared with those in Na+, while in tetramethylammonium (TMA+) no charge movement was detected. 4. The charge-voltage (Q-V) relationship in Na+ could be fitted by a Boltzmann equation having V of -69 +/- 1 mV and slope factor of 26 +/- 1 mV; lowering the Na+ concentrations shifted the Q-V relationship to more negative potentials; the curves could be described by a generalized Hill equation with a coefficient of 1.6, suggesting two binding sites. The maximal movable charge (Qmax) in Na+, 3 days after injection, was in the range 2.5-10 nC. 5. Addition of the transported substrate leucine increased the steady-state carrier current, the increase being larger in high K+ compared with high Na+ solution; in these conditions the charge movement disappeared. 6. Applying Eyring rate theory, the energy profile of the transporter in the absence of organic substrate included a very high external energy barrier (25.8 RT units) followed by a rather deep well (1.8 RT units).
Figures


Similar articles
-
K+ amino acid transporter KAAT1 mutant Y147F has increased transport activity and altered substrate selectivity.J Exp Biol. 2003 Jan;206(Pt 2):245-54. doi: 10.1242/jeb.00065. J Exp Biol. 2003. PMID: 12477895
-
Ionic selectivity of the coupled and uncoupled currents carried by the amino acid transporter KAAT1.Pflugers Arch. 1999 Nov;438(6):788-96. doi: 10.1007/s004249900132. Pflugers Arch. 1999. PMID: 10591067
-
Simultaneous measurements of ionic currents and leucine uptake at the amino acid cotransporter KAAT1 expressed in Xenopus laevis oocytes.Biochim Biophys Acta. 2000 Jan 10;1495(1):34-9. doi: 10.1016/s0167-4889(99)00143-3. Biochim Biophys Acta. 2000. PMID: 10634930
-
Molecular characteristics of mammalian and insect amino acid transporters: implications for amino acid homeostasis.J Exp Biol. 1997 Jan;200(Pt 2):269-86. doi: 10.1242/jeb.200.2.269. J Exp Biol. 1997. PMID: 9050235 Review.
-
System y+L: the broad scope and cation modulated amino acid transporter.Exp Physiol. 1998 Mar;83(2):211-20. doi: 10.1113/expphysiol.1998.sp004105. Exp Physiol. 1998. PMID: 9568481 Review.
Cited by
-
Glutamate 268 regulates transport probability of the anion/proton exchanger ClC-5.J Biol Chem. 2012 Mar 9;287(11):8101-9. doi: 10.1074/jbc.M111.298265. Epub 2012 Jan 20. J Biol Chem. 2012. PMID: 22267722 Free PMC article.
-
The Lepidopteran KAAT1 and CAATCH1: Orthologs to Understand Structure-Function Relationships in Mammalian SLC6 Transporters.Neurochem Res. 2022 Jan;47(1):111-126. doi: 10.1007/s11064-021-03410-1. Epub 2021 Jul 24. Neurochem Res. 2022. PMID: 34304372 Free PMC article.
-
Effect of substrate on the pre-steady-state kinetics of the Na(+)/glucose cotransporter.Biophys J. 2007 Jan 15;92(2):461-72. doi: 10.1529/biophysj.106.092296. Epub 2006 Oct 27. Biophys J. 2007. PMID: 17071656 Free PMC article.
-
Electrogenic kinetics of a mammalian intestinal type IIb Na(+)/P(i) cotransporter.J Membr Biol. 2006;212(3):177-90. doi: 10.1007/s00232-006-0016-3. Epub 2007 Mar 6. J Membr Biol. 2006. PMID: 17342377
-
Amino acid transporter B(0)AT1 (slc6a19) and ancillary protein: impact on function.Pflugers Arch. 2016 Aug;468(8):1363-74. doi: 10.1007/s00424-016-1842-5. Epub 2016 Jun 2. Pflugers Arch. 2016. PMID: 27255547
References
-
- Cammack JN, Rakhilin SV, Schwartz EA. A GABA transporter operates asymmetrically and with variable stoichiometry. Neuron. 1994;13:949–960. - PubMed
-
- Dascal N, Lotan I. Expression of exogenous ion channels and neurotransmitter receptors in RNA-injected Xenopus oocytes. In: Longstaff A, Revest P, editors. Methods in Molecular Biology, Protocols in Molecular Neurobiology. Vol. 13. NJ, USA: The Humana Press; 1992. pp. 205–225.
-
- Dow JAT, Peacock JM. Microelectrode evidence for the electrical isolation of goblet cell cavities in Manduca sexta middle midgut. Journal of Experimental Biology. 1989;143:101–114.
MeSH terms
Substances
LinkOut - more resources
Full Text Sources

