. 1999 Mar 15;515 ( Pt 3)(Pt 3):799-811.
doi: 10.1111/j.1469-7793.1999.799ab.x.

Activity-dependent slowing of conduction differentiates functional subtypes of C fibres innervating human skin

Affiliations

Activity-dependent slowing of conduction differentiates functional subtypes of C fibres innervating human skin

J Serra et al. J Physiol. .

Abstract

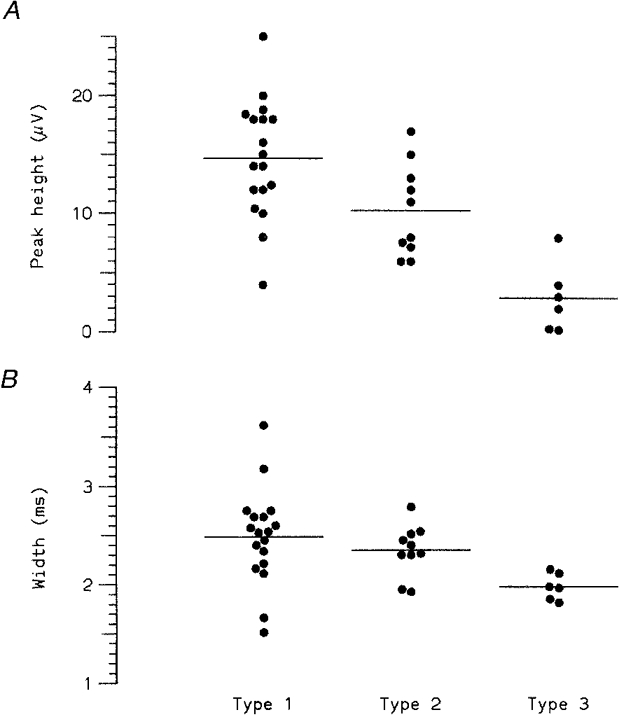
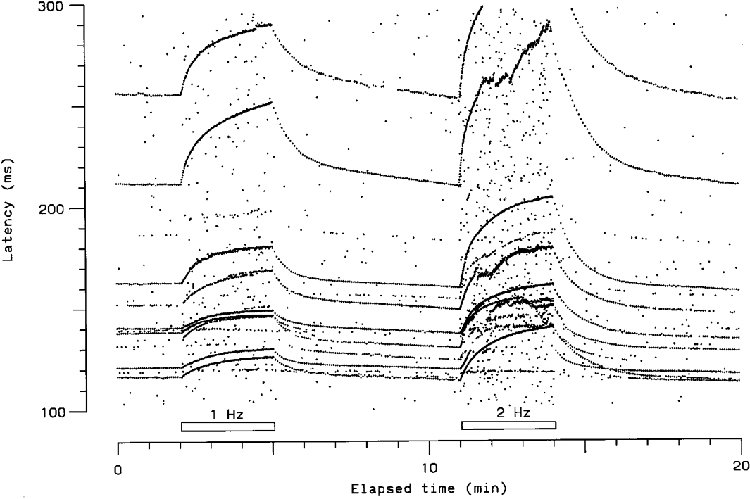
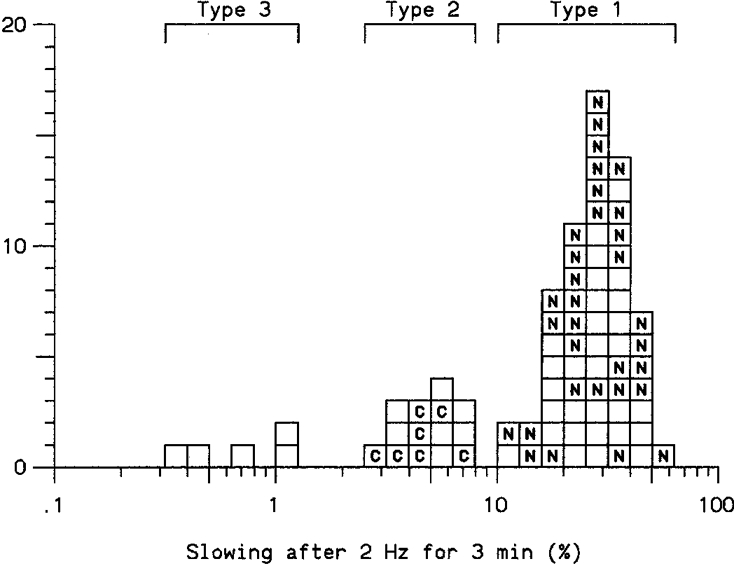
1. The effects of impulse activity on conduction in cutaneous C fibres have been examined in 46 microneurographic recordings from 11 normal subjects and 11 diabetic patients with normal nerve conduction. A tungsten microelectrode was inserted into a cutaneous nerve, usually the superficial peroneal close to the ankle, and intraneural microstimulation was used to identify an area of skin innervated. Three minute trains of 0.25 ms stimuli at 1, 2 and 4 Hz were then delivered to the surface of the skin, separated by intervals of 6 min with stimulation at 0.25 Hz. Slowing and block of conduction were measured from the nerve responses for up to seven C units per stimulation sequence. 2. Three types of C unit were distinguished by their responses to repetitive stimulation: type 1 units slowed progressively during the 3 min trains; slowing of type 2 units reached a plateau within 1 min; while type 3 units hardly slowed at all. Data from normal and diabetic subjects did not differ and were pooled. After 3 min at 2 Hz, the percentage increases in latency were for type 1, 28.3 +/- 9.7 (n = 63 units, mean +/- s.d.); for type 2, 5.2 +/- 1.6 (n = 14); and for type 3, 0.8 +/- 0.5 (n = 5), with no overlap. After 3 min at 4 Hz, 58 % of type 1 units (but no type 2 or 3 units) blocked intermittently. Recovery of latency after stimulation was faster for type 2 than for type 1 units, but conduction velocities of the three types were similar. 3. Type 1 units were identified as nociceptors and 7 type 2 units were identified as 'cold' fibres, activated by non-noxious cold, with no overlap in modality. None of the units tested was activated by weak mechanical stimuli or reflex sympathetic activation. 4. Spike waveforms were averaged for 18 type 1, 10 type 2 and 6 type 3 units. All units had predominantly triphasic action potentials with a major negative peak, but those of type 3 units were on average both smaller and briefer than those of type 1 and type 2 units. 5. It is concluded that repetitive electrical stimulation reliably differentiates nociceptive from cold-specific C fibres innervating human hairy skin, as has previously been shown for the rat. Cold fibres can propagate impulses continuously at much higher rates than nociceptive fibres. The nature of the type 3 units is unclear.


Figures

Figure 1
Figure 1. Schematic diagram of method of tracking latency changes in single human C fibres
Constant current stimuli triggered by the computer are applied to the skin in the receptive field of C fibres recorded by microneurography from superficial peroneal nerve at the ankle (bottom). Computer display during experiment, 1 min after second 3 min period of repetitive stimulation (top). Latency to positive peak of filtered and inverted response waveform occurring within window (short horizontal line in upper trace) is recorded and displayed (lower trace). The window is recentred on peak after each stimulus, so that a single unit may be tracked in the presence of other large units. Raw responses are recorded so that latencies may be remeasured off-line (for large units), or multiple units displayed on a raster plot (Fig. 2).
Figure 2
Figure 2. Latency changes displayed as a raster plot
A, responses (filtered and inverted) from 100–200 ms after stimuli were applied at indicated elapsed times, before, during and after stimulation at 4 Hz for 3 min. * indicates one unit, which slowed much more than a second unit, so the order was briefly reversed at 14 min. B, raster display of all peaks above an arbitrary level, in all recorded responses in the same experiment. The different behaviour of the two units is readily resolved from each other and distinguished from background noise. (At 4 Hz, only alternate responses could be recorded.)
Figure 5
Figure 5. Examples of three types of response to standard repetitive stimulation protocol
Latencies tracked during 3 min periods of stimulation at 1, 2 and 4 Hz, separated by 6 min periods at 0.25 Hz. From top to bottom: type 1 units progressively increase in latency and often block, type 2 units soon reach a plateau, while type 3 units change little in latency (< 2 % at 2 Hz).
Figure 9
Figure 9. Functional characterization of units by ‘marking’ with natural stimuli
A, a type 1 unit is stimulated at aby a metal rod (ca 25 °C), at b by ice, at c by Von Frey hair (24 bar) and at d by heating to 48 °C for 5 s. B, a type 2 unit is excited at a and b by a metal rod (ca 25 °C), confirming that it is a ‘cold’ fibre. Note that rates of recovery after natural stimulation resemble those after repetitive electrical stimulation.
Figure 13
Figure 13. Spike waveforms for different types of C fibre
A, representative waveforms of the three types of C fibre, scaled to same peak-to-peak height. (Top row: type 1; middle row: type 2; bottom row: type 3.) B, waveforms as in A, plotted to same scale. C, means ±s.d. of measured amplitudes of 18 type 1 (top row), 10 type 2 (middle row) and 6 type 3 (bottom row) units, plotted at mean measured separations. Scale bars at bottom right apply to all traces in B and C.
Figure 14
Figure 14. Individual spike waveform measurements
A, amplitude of major (negative) peak of spike waveform for 18 type 1, 10 type 2 and 6 type 3 units. B, widths of same action potentials. Horizontal lines indicate mean values, corresponding to measurements plotted in Fig. 13C. Both amplitude and width of action potentials appeared to vary systematically between C fibre types (see also Table 2).
Figure 3
Figure 3. Raster display of multiple units
Recordings from another experiment displayed as a raster plot of latencies as in Fig. 2. At least nine different units were recorded at this site.
Figure 4
Figure 4. ‘Jumping’ and ‘blocking’
A, tracked latency changes in a single, large amplitude C unit, showing two common features: latency jumps and blocking or failure of conduction. Latency jumps typically occur at similar latencies during repetitive stimulation and recovery, and are interpreted as due to failure of excitation at one site, so that fibre is excited at a more distal site or on another, longer branch. If no branch is excited, conduction fails, and increase in latency is interrupted. B, detail of latency changes in another fibre, which started to fail at 2 Hz, showing alternation between periods when excitation predominantly failed and latency declined, and periods when fibre was excited and latency continued to increase.
Figure 6
Figure 6. Effect of duration of repetitive stimulation on slowing in individual C fibres
Slowing (i.e. increase in latency, expressed as percentage of control) measured at 1 and 3 min after start of repetitive stimulation, showing increasing separation of three types of unit with increasing frequency: type 1 (•), type 2 (▴) and type 3 (▪). 1 at 1 min indicates that the unit fails before 3 min. Symbols connected by lines denote same unit.
Figure 7
Figure 7. Effect of frequency of repetitive stimulation on slowing in individual C fibres
Degree of slowing after repetitive stimulation at 3 min illustrated for 31 type 1, 10 type 2 and 5 type 3 units for which a complete stimulation sequence was recorded. Symbols as in Fig. 6. ^ indicates unit starts to fail at next higher frequency.
Figure 8
Figure 8. Effects of repetitive stimulation on three subpopulations of C fibre
Cumulative percentage distributions of degree of slowing after 3 min of stimulation at different frequencies. Same data as in Fig. 6, with slowing plotted on a logarithmic scale to show the greater than 100-fold range. Type 1 curves (2 and 4 Hz) cross the right-hand axis below 100 % because the remaining units fail to conduct every impulse for 3 min. The only overlap between the three subpopulations occurs between types 1 and 2 at 1 Hz.
Figure 10
Figure 10. Relationship between response to repetitive stimulation and function of C fibres
Each square represents a single unit and its degree of slowing after stimulation at 2 Hz for 3 min. N, identified as nociceptor; C, fibre activated by non-noxious cold. Blank squares indicate fibres of unknown function.
Figure 11
Figure 11. Relationship between rate of recovery from repetitive stimulation and type of C fibre
A, time for recovery to 50 % of resting latency after stimulation at 2 Hz for 3 min. B, percentage recovery 30 s after same train. Horizontal bars indicate mean values. Differences between type 1 and type 2 fibres were significant in each case (see Table 2).
Figure 12
Figure 12. Rate of recovery depends on type of C fibre but is unrelated to extent of slowing
Data for type 1 (0) and type 2 (8) fibres from Fig. 11A plotted on logarithmic scale against the degree of slowing of the fibre after 3 min at 2 Hz. Ellipses are 95 % confidence limits for individuals from the two subpopulations (if distributed as bi(log)normal deviates). The subpopulations differ with respect to both variables, but there is no correlation between recovery and slowing within either subpopulation.

Comment in

Similar articles

Cited by

References

    1. Baker M, Bostock H, Grafe P, Martius P. Function and distribution of three types of rectifying channel in rat spinal root myelinated axons. The Journal of Physiology. 1987;383:45–67. - PMC - PubMed
    1. Bergmans J. The Physiology of Single Human Nerve Fibres. Vander, Belgium: University of Louvain; 1970.
    1. Bostock H, Cikurel K, Burke D. Threshold tracking techniques in the study of human peripheral nerve. Muscle and Nerve. 1998;21:137–158. - PubMed
    1. Bostock H, Grafe P. Activity-dependent excitability changes in normal and demyelinated rat spinal root axons. The Journal of Physiology. 1985;365:229–257. - PMC - PubMed
    1. Davis KD, Meyer RA, Campbell JN. Chemosensitivity and sensitization of nociceptive afferents that innervate the hairy skin of monkey. Journal of Neurophysiology. 1993;69:1071–1081. - PubMed

Publication types

MeSH terms

LinkOut - more resources