. 1999 Mar 15;515 ( Pt 3)(Pt 3):813-28.
doi: 10.1111/j.1469-7793.1999.813ab.x.

Properties and functional roles of hyperpolarization-gated currents in guinea-pig retinal rods

Affiliations

Properties and functional roles of hyperpolarization-gated currents in guinea-pig retinal rods

G C Demontis et al. J Physiol. .

Abstract

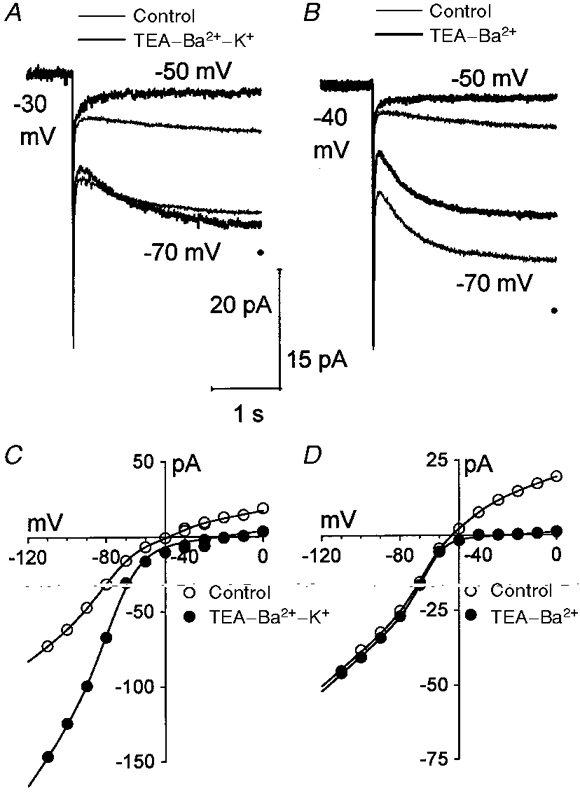
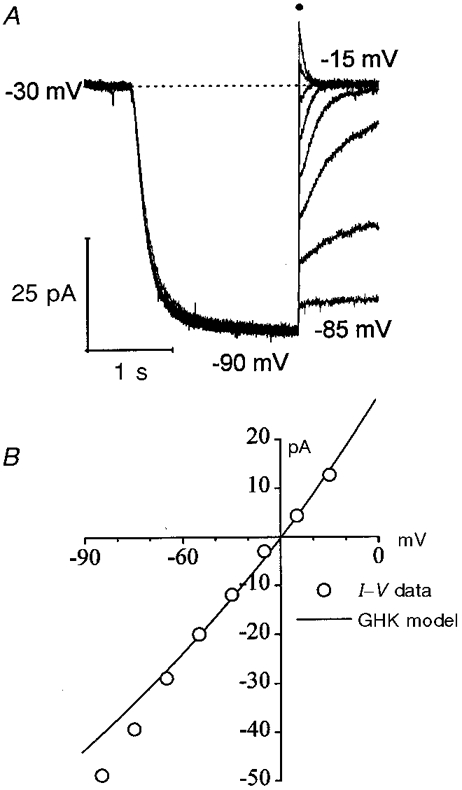
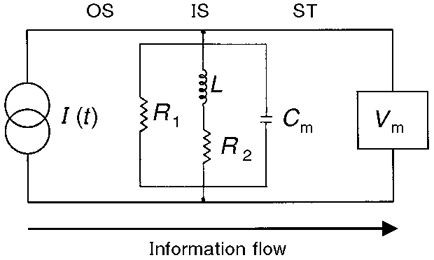
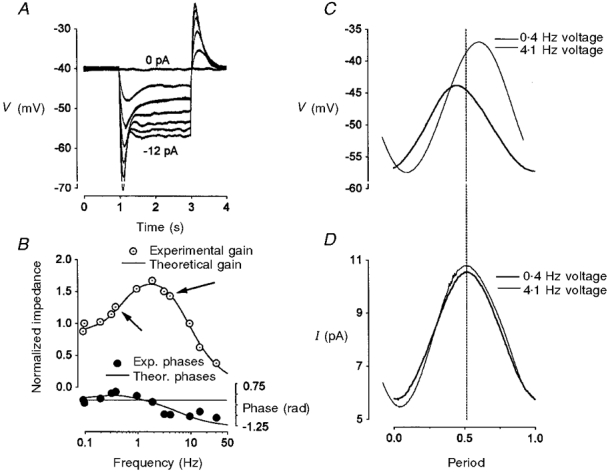
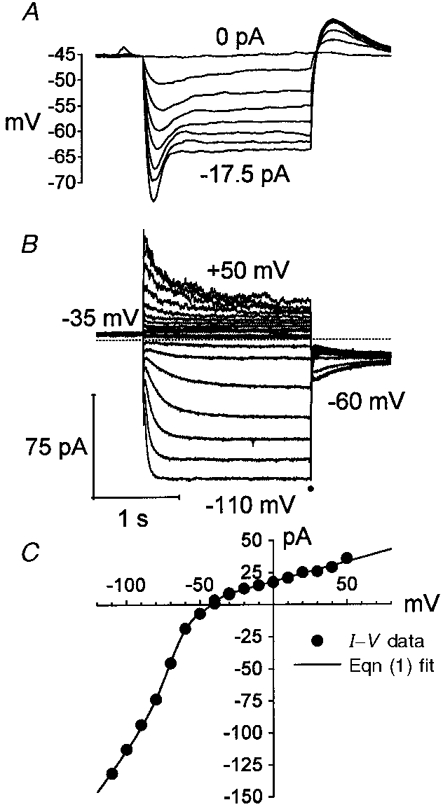
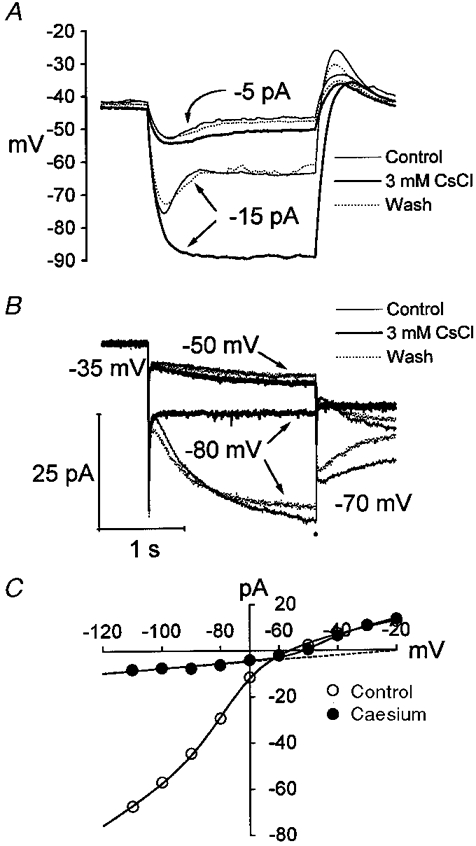
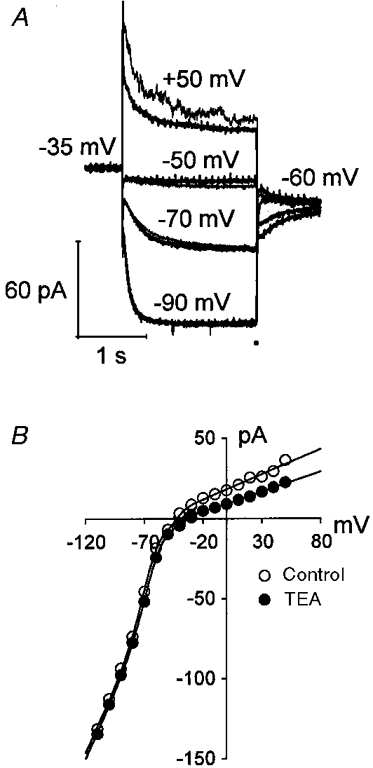
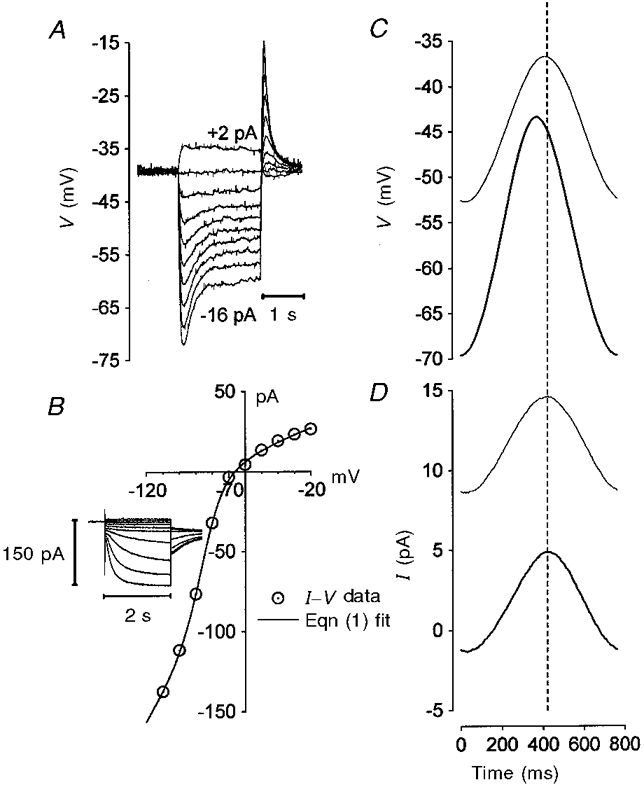
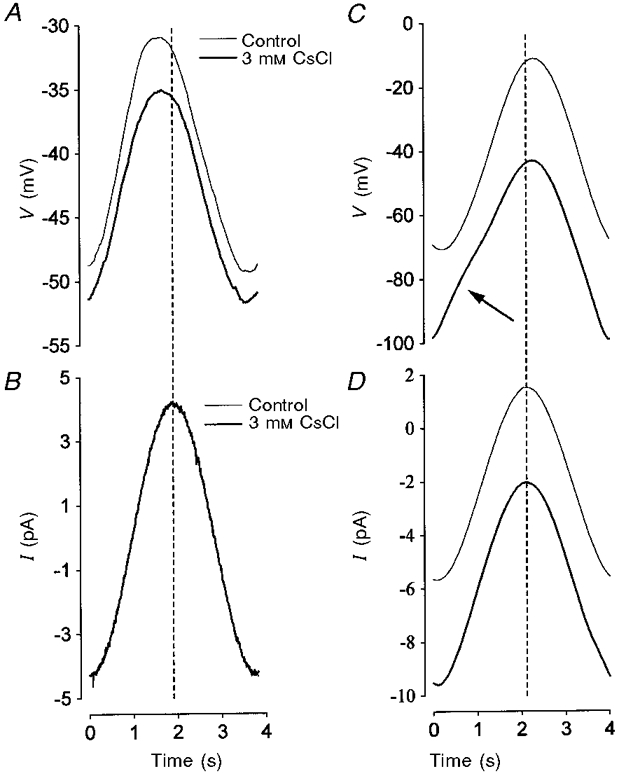
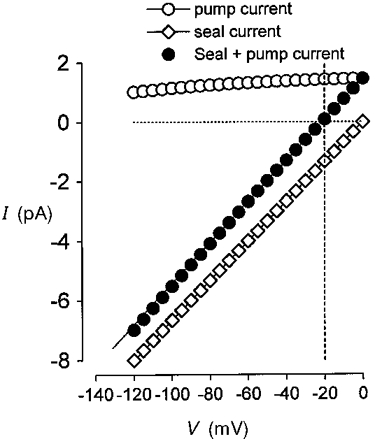
1. The inward rectification induced by membrane hyperpolarization was studied in adult guinea-pig rods by the perforated-patch-clamp technique. 2. CsCl blocked the rectification observed in both voltage- and current-clamp recordings at voltages negative to -60 mV, while BaCl2 blocked the inward relaxation observed at voltages positive to -60 mV. The current activated at -90 mV had a low selectivity between sodium and potassium and reversed at -31.0 mV. 3. These observations suggest that two inward rectifiers are present in guinea-pig rods: a hyperpolarization-activated (Ih) and a hyperpolarization-deactivated (Ikx) current. The functional roles of Ih and Ikx were evaluated by stimulating rods with currents sinusoidally modulated in time. 4. Rods behave like bandpass amplifiers, with a peak amplification of 1.5 at about 2 Hz. For hyperpolarizations that mainly gate Ikx, amplification and phase shifts are fully accounted for by a rod membrane analogue model that includes an inductance. For hyperpolarizations that also gate Ih, a harmonic distortion became apparent. 5. Bandpass filtering and amplification of rod signals, associated with Ih and Ikx gating by membrane hyperpolarization, are strategically located to extend, beyond the limits imposed by the slow phototransductive cascade, the temporal resolution of signals spreading to the rod synapse.


Figures

Figure 4
Figure 4. Effects of 20 mM TEA and 1 mM Ba2+ on the inward rectification of guinea-pig rods
A, response to voltage steps to −70 and −50 mV, from holding values of −30 mV, in Locke's solution (thin traces) and in the presence of saline containing (mM): 120 NaCl, 20 TEA, 1 BaCl2, 6 KCl, 1.2 CaCl2, 5 Hepes, pH 7.4 (TEA-Ba2+-K+ saline) (thick traces). B, response to voltage steps to −70 and −50 mV, from holding values of −40 mV, in Locke's solution (thin traces) and in the presence of saline containing (mM): 120 NaCl, 20 TEA, 1 BaCl2, 3.6 KCl, 1.2 CaCl2, 5 Hepes, pH 7.4 (TEA-Ba2+ saline) (thick traces). The recordings in A and B have been aligned for clarity; the holding current was 9.6 pA in controls and −6.2 pA in the presence of TEA-Ba2+-K+ in A and 7.6 pA in controls and −0.1 pA in TEA-Ba2+ in B. Two points have been removed from the capacity transients in A and B. The vertical calibration bar is 20 pA for A and 15 pA for B. C and D, current amplitudes, averaged over the last 10 ms of the 2 s voltage steps (thick dots in A and B), are plotted for controls (^) and TEA-Ba2+-K+ (• in C) or TEA-Ba2+ (• in D) saline, respectively. The smooth curves in C are best fits of eqn (1) to data with: Gh, 0.85 nS; V½h, −74.7 mV; Sh, 9.4 mV; Gkx, 0.18 nS; V½kx, −44.9 mV; Skx, 5.0 mV; GL, 0.057 nS; VL, −20 mV. The parameters in TEA-Ba2+-K+ are: Gh, 1.61 nS; V½h, −74.6 mV; Sh, 8.6 mV; Gkx, 0.1 nS; V½kx, −14.0 mV; Skx, 5.5 mV; GL, 0.166 nS; VL, −20 mV. The values of Eh and Ek in TEA-Ba2+-K+ are −30 and −78 mV, respectively. T= 23°C. The smooth curves in D are best fits of eqn (1) to data with: Gh, 0.65 nS; V½h, −64.6 mV; Sh, 6.6 mV; Gkx, 0.22 nS; V½kx, −47.4 mV; Skx, 7.1 mV; GL, 0.03 nS, VL, −20 mV. The parameters in TEA-Ba2+ are: Gh, 0.55 nS; V½h, −65.1 mV; Sh, 5.6 mV; Gkx, 0.1 nS; V½kx, −7.4 mV; Skx, 7.0 mV; GL, 0.03 nS, VL, −20 mV. T= 22°C.
Figure 5
Figure 5. Ionic selectivity of the inward rectification gated by membrane hyperpolarization in TEA-Ba2+-K+ solution
A, the voltage was stepped for 2 s to −90 mV, before stepping back to voltages ranging from −85 to −15 mV, in 10 mV steps. Holding voltage was −30 mV. Traces have been leak-subtracted on-line by a P/5 protocol. The dotted line is the zero current level. B, ^, average current amplitudes measured between 10 and 20 ms (indicate by a thick dot in A) after the end of the 2 s activating steps, and plotted as a function of the variable voltage (•). The smooth line through the experimental points is the best fit of eqn (2) to data, with a reversal potential of −29.9 mV and a PNa/PK ratio of 0.33. Ion activities were 5, 90, 5 and 100 mM for internal sodium, external sodium, external potassium and internal potassium, respectively. The [Na+]i value was obtained from eqn (A5) in the Appendix. T= 24°C.
Figure 9
Figure 9. Electrical model of guinea-pig rods
OS, IS and ST indicate the outer segment, the inner segment and the synaptic terminal, respectively. I(t) denotes that the outer segment generated current changes with time, but is independent of voltage (constant current generator). R1, R2, L and Cm are the elements of the LRC circuit of the inner segment. Vm is the presynaptic voltage, originating from the filtering by the LRC circuit at the inner segment of the current generated at the outer segment level. The arrow at the bottom indicates the flow of information, spreading from the outer segment to the synaptic terminal via the inner segment.
Figure 7
Figure 7. Effect of stimulation frequency on the voltage response of rods to sinusoidal current injections
A, current-clamp responses to 2 s inward current steps ranging from Φ to −12 pA, in 2 pA steps. The cell was depolarized from −56 to −40.1 mV by a steady-current injection of 8 pA. The thick continuous line is a single exponential fit to the response to the −4 pA stimulus, with a time constant of 286 ms, whose value was used to compute the parameter L as described in Methods. B, ^, impedance values normalized to the value at 0.2 Hz (2.7 GΩ), when stimuli were applied from starting potentials close to −56 mV. Arrows pointing to the open circles indicate the normalized impedance values for the traces in C and D. The thick continuous line has been drawn from the modulus of the complex impedance in accordance with eqn (3). Parameters were R1= 3.68 GΩ; R2= 4.04 GΩ; L= 2.21 GH; Cm= 6 pF. •, the experimental phase for this rod and the continuous line is the theoretical phase, computed in accordance with eqn (4) with the above parameters. The dotted line was drawn for reference at zero phase difference. C, the thick and the thin traces correspond to stimulation frequencies of 0.4 and 4.1 Hz, respectively. Stimuli were applied from membrane potentials of −56.6 and −57.4 mV for the thick and thin traces, respectively. D, stimulus amplitudes were 4.8 and 5.3 pA for the thick and the thin traces, respectively. In both C and D, each trace is the average of 16 sweeps. Data in panels C and D were sampled at 1 kHz and 100 Hz and filtered at 200 Hz and 40 Hz for the thin and the thick traces, respectively. T= 21.3°C.
Figure 1
Figure 1. Inward rectification of the I-V relationship of guinea-pig rods recorded in response to membrane hyperpolarization
A, current-clamp responses to 2 s current injections, ranging in amplitude from 0 to 17.5 pA in 2.5 pA increments. Membrane potential in bright light was −45.5 mV. B, voltage-clamp responses to 2 s hyperpolarizing and depolarizing voltage steps, from the same cell as in A. Holding voltage was −35 mV; voltage stimuli ranged from −110 to +50 mV in 10 mV increments, before stepping back to −60 mV for 1 s. Time calibration applies to both A and B. The dotted line in B is the zero current level. Two points have been removed from the capacity transients. C, •, current amplitudes at the end of the 2 s voltage steps (thick dot in B), averaged over the last 5 points. The smooth line through the experimental points is the best fit of eqn (1) (see Methods) to the I-V data, with: Gh, 1.45 nS; V½h, −66.0 mV; Sh, 7.2 mV; Gkx, 0.17 nS; V½kx, −42.0 mV; Skx, 3.3 mV; GL, 0.14 nS; VL, −20 mV. T= 25°C.
Figure 2
Figure 2. Effects of CsCl on the inward rectification of guinea-pig rods
A, current-clamp responses to 2 s inward current steps of −5 and −15 pA, before (thin traces), during (thick traces) and after (dotted traces) application of 3 mM CsCl. The resting potential in bright light was −53 mV and was brought to −41 mV by the injection of a steady outward current of 5.1 pA. B, voltage-clamp responses to 2 s voltage steps to −50 and −80 mV, before stepping back to −70 mV, from the same cell as in A. Holding voltage was −35 mV. Control (thin traces), during application of 3 mM CsCl (thick traces) and after washing out CsCl (dotted traces) sweeps are plotted. Two points have been removed from the capacity transients. C, open and filled symbols are average current amplitudes, measured during the last 10 ms of the 2 s voltage steps (thick dot in B) in control and CsCl, respectively. The smooth line through the experimental points in control is a best fit of eqn (1) with: Gh, 0.76 nS; V½h, −75.7 mV; Sh, 7.3 mV; Gkx, 0.18 nS; V½kx, −58.9 mV; Skx, 8.8 mV; GL, 0.068 nS; VL, −20 mV. The data in CsCl were fitted by setting Gh to 0 nS; the best-fit values for the other parameters are: Gkx, 0.19 nS; V½kx, −48.3 mV; Skx, 5.6 mV; GL, 0.102 nS; VL, −20 mV. T= 23°C.
Figure 3
Figure 3. Effects of TEA on the inward rectification of guinea-pig rods
A, the responses to 2 s voltage steps to −90, −70, −50 and +50 mV from a holding voltage of −35 mV are shown before (thin traces) and during (thick traces) exposure to 10 mM TEA chloride. Two points have been removed from the capacity transients. B, ^, current amplitudes in controls averaged over the last 10 ms of the 2 s steps (thick dot in A). The smooth line through the open symbols is a best fit of eqn (1) with: Gh, 1.45 nS; V½h, −66.0 mV; Sh, 7.2 mV; Gkx, 0.17 nS; V½kx, −42.0 mV; Skx, 3.3 mV; GL, 0.14 nS; VL, −20 mV. •, current amplitudes in TEA averaged over the last 10 ms of the 2 s steps. The smooth line through the filled symbols is a best fit of eqn (1) with: Gh, 1.45 nS; V½h, −63.3 mV; Sh, 7.4 mV; Gkx, 0.07 nS; V½kx, −36.5 mV; Skx, 3.5 mV; GL, 0.18 nS; VL, −20 mV. T= 25°C.
Figure 6
Figure 6. Effect of membrane potential on the voltage response of rods to sinusoidal current injections
A, current-clamp responses to 2 s inward current steps ranging from +2 to −16 pA, in 2 pA steps. The cell was depolarized from −65 to −39.9 mV by a steady-current injection of 17 pA. B, ^, current amplitudes, from the recordings in the inset, averaged over the last 10 ms of the 2 s voltage steps. The smooth line through the experimental points is the best fit of eqn (1) to the I-V data, with: Gh, 1.72 nS; V½h, −83.6 mV; Sh, 6.7 mV; Gkx, 0.41 nS; V½kx, −68.1 mV; Skx, 9.4 mV; GL, 0.0 nS; VL, −20 mV. In this rod Cm was 2.5 pF. C, current-clamp recordings from the same rod as in A and B, in response to the current stimuli shown in D. The thick trace in C shows the response to the current stimulus indicated by the thick trace in D. The vertical dashed line in both C and D has been drawn for reference at 420 ms, at the peak of the stimuli. In both C and D, each trace is the average of 16 sweeps. The voltage trace at the more hyperpolarized potential peaked in advance of the current by 54 ms (0.44 radians). D, current amplitudes were 6.22 pA (thick trace) and 6.03 pA (thin trace). Stimulus frequency was 1.3 Hz. Data in C and D were sampled at 333 Hz and filtered at 100 Hz. T= 21.7°C.
Figure 8
Figure 8. Effect of CsCl and TEA-Ba2+ saline on the response to current stimuli sinusoidally modulated in time
A, current-clamp responses in control Locke's solution (thin trace) and in the presence of 3 mM CsCl (thick trace), to sinusoidal current stimuli. B, sinusoidal current stimuli frequency was 0.26 Hz. In A and B, traces are the average of 16 stimuli. Individual sweeps were sampled at 67 Hz and filtered at 20 Hz. T= 22°C. C, current-clamp responses recorded in the presence of TEA-Ba2+ saline at two different starting voltages of −70.6 mV (thin trace) and −98.2 mV (thick trace). The arrow points to the harmonic distortion in the response recorded at the more hyperpolarized potential. D, sinusoidal current stimuli frequency was 0.23 Hz. In A and B, traces are the average of 16 stimuli. Individual sweeps were sampled at 31 Hz and filtered at 10 Hz. T= 21°C.
Figure 10
Figure 10. Computation of conductance and reversal potential of leakage from the seal resistance and the estimated Na+-K+ electrogenic current
^, the pump current computed from eqn (A1); ⋄, the current through the seal resistance of 15 GΩ; • the net current resulting from the sum of the seal and the pump current. The straight dotted line through the filled circles is a regression line with a slope of 69 pS and a reversal potential of −21 mV, to be compared with the estimates for GL provided by eqn (1) for the data in Figs 2 and 4. The vertical dotted line has been drawn for reference at −20 mV.

Similar articles

Cited by

References

    1. Attwell D, Borges S, Wu SM, Wilson M. Signal clipping by the rod output synapse. Nature. 1987;328:522–524. 10.1038/328522a0. - DOI - PubMed
    1. Bader CR, Bertrand D. Effect of changes in intra- and extracellular sodium on the inward (anomalous) rectification in salamander photoreceptors. The Journal of Physiology. 1984;347:611–631. - PMC - PubMed
    1. Bader CR, Bertrand D, Schwartz EA. Voltage-activated and calcium-activated currents studied in solitary rod inner segments from the salamander retina. The Journal of Physiology. 1982;331:253–284. - PMC - PubMed
    1. Bader CR, MacLeish PR, Schwartz EA. A voltage-clamp study of the light response in solitary rods of the tiger salamander. The Journal of Physiology. 1979;296:1–26. - PMC - PubMed
    1. Barnes S, Hille B. Ionic channels of the inner segment of tiger salamander cone photoreceptors. Journal of General Physiology. 1989;94:719–743. - PMC - PubMed

Publication types

LinkOut - more resources