. 1999 Mar 15;515 ( Pt 3)(Pt 3):843-57.
doi: 10.1111/j.1469-7793.1999.843ab.x.

Effects of tetracaine on sarcoplasmic calcium release in mammalian skeletal muscle fibres

Affiliations

Effects of tetracaine on sarcoplasmic calcium release in mammalian skeletal muscle fibres

L Csernoch et al. J Physiol. .

Abstract

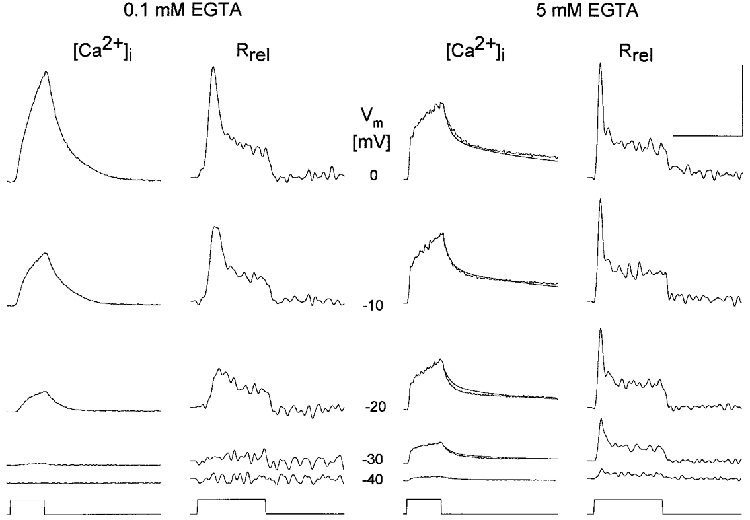
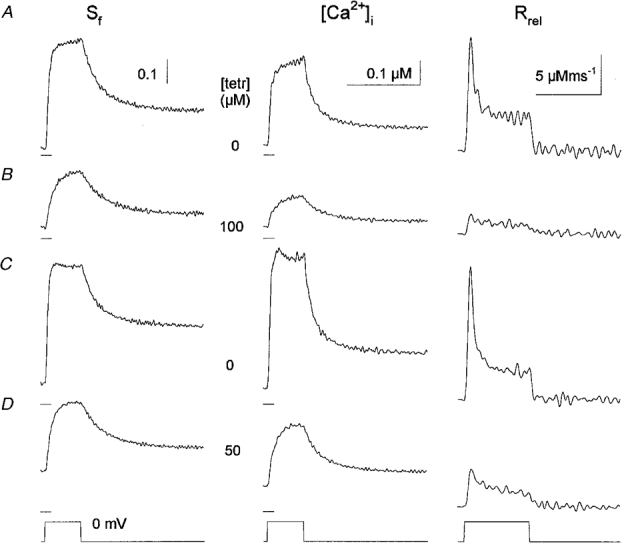
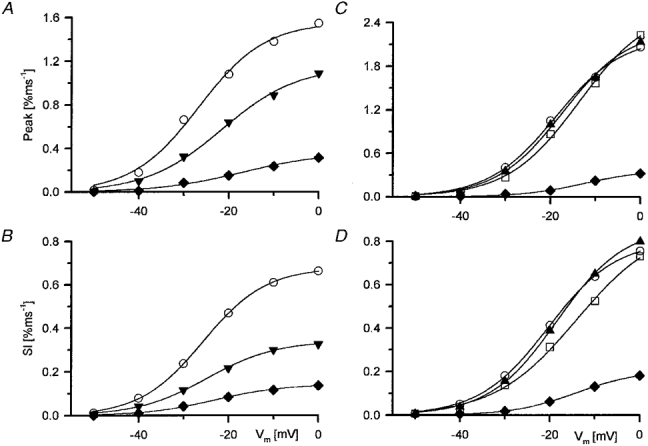
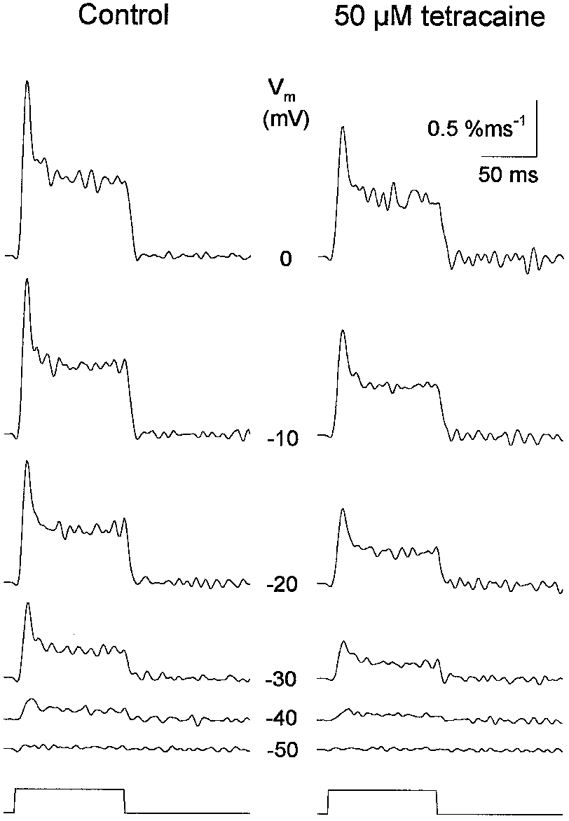
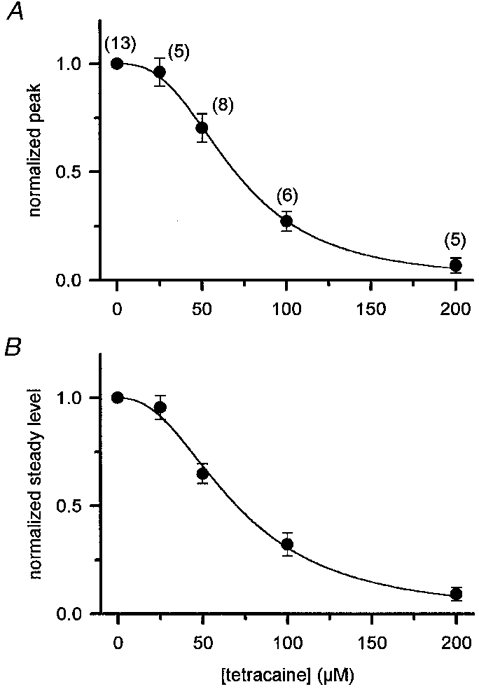
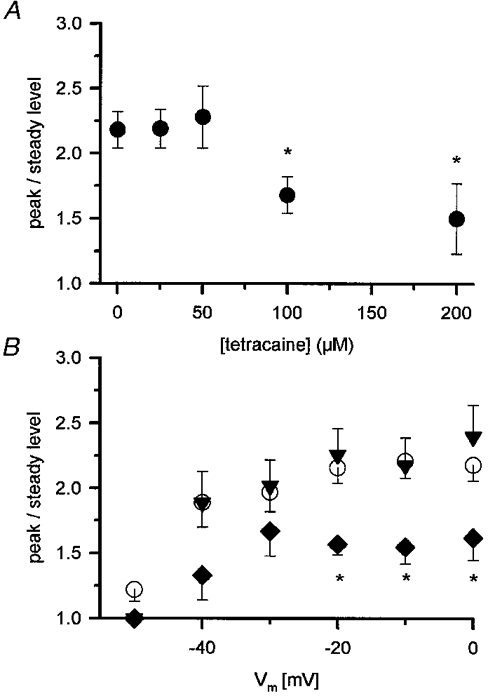
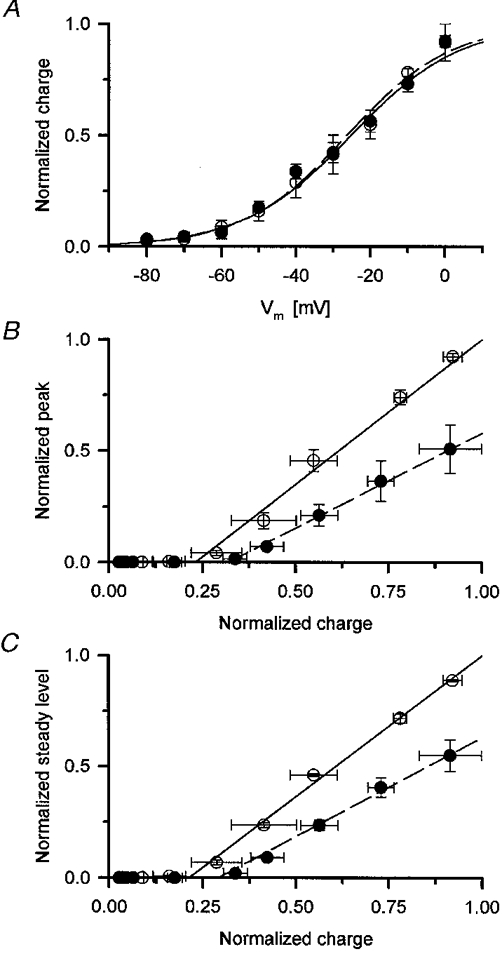
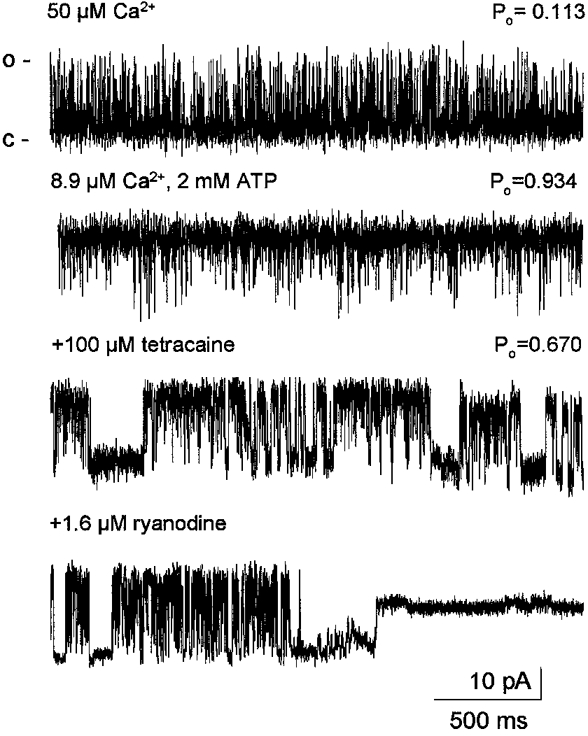
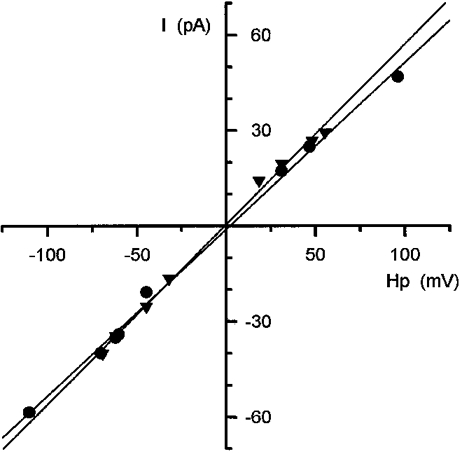
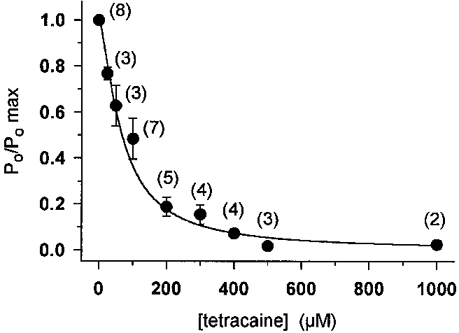
1. Single muscle fibres were dissociated enzymatically from the extensor digitorum communis muscle of rats. The fibres were mounted into a double Vaseline gap experimental chamber and the events in excitation-contraction coupling were studied under voltage clamp conditions in the presence and absence of the local anaesthetic tetracaine. 2. Changes in intracellular calcium concentration ([Ca2+]i) were monitored using the calcium sensitive dyes antipyrylazo III and fura-2 and the rate of calcium release (Rrel) from the sarcoplasmic reticulum (SR) was calculated. Tetracaine decreased the maximal attained [Ca2+]i and suppressed, in a dose-dependent manner, both the early peak and the steady level of Rrel in the voltage range examined. 3. The concentration dependence of the effects on the two kinetic components of Rrel were almost identical with a half-effective concentration (K50) of 70 and 71 microM and a Hill coefficient (nH) of 2.7 and 2.3 for the peak and the steady level, respectively. Furthermore, the drug did not alter the peak to steady level ratio up to a concentration (50 microM) that caused a 35 +/- 5 % reduction in calcium release. Higher concentrations did suppress the ratio but the degree of suppression was voltage independent. 4. Tetracaine (50 microM) neither influenced the total available intramembrane charge nor altered its membrane potential dependence. It shifted the transfer function, the normalized SR permeability versus normalized charge to the right, indicating that similar charge transfer caused a smaller increase in SR permeability. 5. To explore the site of action of tetracaine further the ryanodine receptor (RyR) calcium release channel of the SR was purified and reconstituted into planar lipid bilayers. The reconstituted channel had a conductance of 511 +/- 14 pS (n = 8) in symmetric 250 mM KCl that was not affected by tetracaine. Tetracaine decreased the open probability of the channel in a concentration-dependent manner with K50 = 68 microM and nH = 1.5. 6. These experiments show that tetracaine suppresses SR calcium release in enzymatic isolated mammalian skeletal muscle fibres. This effect is due, presumably, to the decreased open probability of the RyR in the presence of the drug. Since both the inactivating peak and the steady level of Rrel were equally affected by tetracaine, our observations suggest that there is a tight coupling between these kinetic components of SR calcium release in mammalian skeletal muscle.


Figures

Figure 1
Figure 1. Comparison of changes
Comparison of changes in intracellular calcium concentration ([Ca2+]i) and SR calcium release flux (Rrel) from stretched (0.1 mM EGTA) and slack fibres (5 mM EGTA). [Ca2+]i was calculated from changes in APIII absorbance in the presence of 0.1 mM EGTA and from fura-2 fluorescence in the presence of 5 mM EGTA. Rrel was obtained by first fitting the decay of the calcium transient with a removal model that included the buffer. The predicted decay after repolarization is superimposed for the slack fibre (noiseless traces). Membrane potentials during the 100 ms test pulses are shown in each row. APIII concentration ([APIII]), 865–893 and 603–684 μM; fura-2 concentration ([fura-2]), 0 and 67–78 μM; koff,Mg-P, 5.4 and 4.7 s−1; PVmax, 3.19 and 1.86 mM s−1 for the stretched and slack fibre, respectively; kon,Ca-E, 0.93 m−1 s−1 and koff,Ca-E 10.2 s−1. Vertical calibration bar corresponds in case of [Ca2+]i to 4 μM for the stretched and 1 μM for the slack fibre, but to 12 μM ms−1 for Rrel in both fibres. Horizontal calibration is 200 ms for [Ca2+]i and 100 ms for Rrel. Sarcomere length (SL), 3.9 and 2.5 μm in stretched and slack fibres, respectively.
Figure 2
Figure 2. SDS-polyacrylamide gel electrophoresis of the rat HSR and RyR
Rat heavy SR vesicles and solubilized calcium release channels were prepared as described in Methods, while rabbit SR vesicles and calcium release channels were prepared as described previously (Lai & Meissner, 1992). Laemli type, 10 % acrylamide gels were used and approximately 8 μg protein was applied into each lane. Molecular weights are indicated at the right. A, rabbit heavy SR vesicles; B, rat heavy SR vesicles; C, solubilized rabbit RyR calcium release channel; D, solubilized rat RyR; E, molecular weight standards. Note that no difference was found between the mobility of rabbit and rat RyR (565 kDa).
Figure 3
Figure 3. Effects of tetracaine on [Ca2+]i and on SR calcium release
The traces were recorded in the order shown starting in row A with the measurement under reference conditions. Tetracaine (100 μM, B) greatly suppressed the change in [Ca2+]i, also evident from the smaller change in the saturation of fura-2 (Sf). The suppression was more dramatic in the calculated SR calcium release flux (Rrel). The effects of the drug were reversible as shown in C. The subsequent application of 50 μM tetracaine (D) again reduced Sf, [Ca2+]i, and Rrel, however the suppression was not as pronounced as with 100 μM. Note that the resting [Ca2+]i was increased during the last treatment compared with control. Fibre was depolarized to 0 mV for 100 ms. [fura-2], 66–90 μM; koff,Mg-P, 2.2 s−1, PVmax, 2.1 mM s−1, kon,Ca-E, 1.3 m−1 s−1 and koff,Ca-E, 4.5 s−1. Horizontal calibration is 200 ms for Sf and [Ca2+]i and 100 ms otherwise. Horizontal ticks below the traces denote 0.25 for Sf and 0 μM for [Ca2+]i. SL, 2.2 μm.
Figure 5
Figure 5. Voltage dependence of tetracaine action on the two kinetic components of SR permeability
A and C, peak SR permeability in the presence of different concentrations of tetracaine. B and D, steady level (Sl) of SR permeability calculated as the mean of the values during the last 40 ms of the 100 ms long depolarization. A and B correspond to the fibre shown in Fig. 4, whereas C and D represent data from another experiment. Note that although the peak SR permeability varied from fibre to fibre, both the steady permeability and the relative suppression by tetracaine was similar. Open symbols represent measurements in reference solution (^, control; □, wash) while filled symbols correspond to different concentrations of tetracaine (▴, 25 μM; ▾, 50 μM; ♦, 100 μM). The voltage dependence was fitted with eqn (2), the continuous curves were generated with the obtained parameters. A, Peakmax, 1.56, 1.15 and 0.36 % ms−1; V‘, −26.7, −21.5 and −16.9 mV; k, 7.4, 8.4 and 9.2 mV, respectively. B, Slmax, 0.68, 0.34 and 0.14 % ms−1; V‘, −25.6, −24.6 and −22.8 mV; k, 7.0, 7.7 and 7.6 mV in control and in the presence of 50 and 100 μM tetracaine, respectively as A. C, Peakmax, 2.21, 2.32, 2.62 and 0.38 % ms−1; V′, −18.9, −17.4, −13.7 and −12.2 mV; k, 7.4, 7.4, 7.9 and 7.0 mV in control, in the presence of 50 μM tetracaine, after wash and in 100 μM tetracaine, respectively. D, Slmax, 0.81, 0.87, 0.88 and 0.21 % ms−1; V′, −20.4, −18.4, −14.0 and −14.0 mV; k, 7.6, 7.5, 9.1 and 7.1 mV, respectively as C.
Figure 4
Figure 4. The effects of 50 μM tetracaine on the SR permeability at different membrane potentials
The SR permeability displayed an early peak and a maintained steady level both before and after the addition of the drug at every potential tested. Tetracaine suppressed both kinetic components at every voltage. Traces were obtained in response to 100 ms long depolarizations to the potentials indicated in each row. [fura-2], 90–124 μM; koff,Mg-P, 2.5 s; PVmax, 5.1 mM s−1; kon,Ca-E, 3.5 m−1 s−1 and koff,Ca-E, 2.7 s−1. SR calcium content (C0), 1.9 mM; SL, 2.5 μm.
Figure 6
Figure 6. Dose-dependent suppression of the peak and the steady level of Rrel*/C0 by tetracaine
A, the maximal SR permeability at the peak, obtained by fitting the Boltzmann function, was averaged and plotted versus tetracaine concentration. Each value was normalized to the corresponding data in control before averaging. B, the concentration-dependent suppression of the steady level calculated as the peak. The numbers in parentheses show the number of fibres, error bars indicate s.e.m. The continuous curves were generated by fitting eqn (3) to the data points with K50 at 70 and 71 μM and nH 2.7 and 2.3 for the peak and the steady level, respectively.
Figure 7
Figure 7. Effects of tetracaine on the peak-to-steady level ratio of SR permeability
A, the peak-to-steady level ratio plotted versus the tetracaine concentration. The fitted maxima, using eqn (2), from each fibre were taken as the peak and steady values to calculate the ratio. * Significant difference compared with control. B, voltage dependence of the peak-to-steady level ratio in reference solution (^) and in the presence of the drug (▾, 50 μM, ♦, 100 μM). * Significant difference compared with control. Note, that there was no significant difference between the values at different membrane potentials at any given concentration of tetracaine except at −50 mV which was significantly smaller than the rest both in control and in the presence of the drug. Error bars represent s.e.m., same fibres as in Fig. 6.
Figure 8
Figure 8. Effects of 50 μM tetracaine on intramembrane charge and on the transfer function
A, voltage dependence of normalized intramembrane charge movement in the presence (•) and absence (^) of tetracaine. The voltage dependence was fitted with eqn (4), the curves were generated with the obtained parameters V′, −25.2 and −26.3 mV and k, 14.6, and 14.0 mV in control (continuous line) and in the presence of 50 μM tetracaine (dashed line), respectively. B and C, transfer functions in the absence and presence of the drug for the peak (B) and for the steady level (C) of SR permeability. To calculate the transfer function the normalized SR permeability was plotted versus the normalized charge. To indicate the close-to-linear relationship between charge movement and SR permeability above the threshold for detectable permeability increase the last five points in each data set were fitted with a straight line (shown superimposed). The parameters obtained in control were slope (m) 1.30 and 1.27 and x-axis intercept (xi) 0.23 and 0.21 for the peak and for the steady level, respectively. In the presence of the drug the values were m, 0.85 and 0.89 while xi, 0.32 and 0.29. All normalizations used the maximum obtained in control on the given fibre.
Figure 9
Figure 9. Effect of tetracaine on the SR calcium release channel current
Representative records taken from an experiment using K+ as charge carrier. Upward deflections of the current records represent the open state of the channel (o) while downward deflections corresponds to the closed state (c). Concentrations of free Ca2+, total ATP and tetracaine cis as well as the open probabilities (Po) are indicated above each trace. Tetracaine suppressed the Po in a concentration-dependent manner by inducing long closed states in channel gating. At the end of the experiment 1.6 μM ryanodine was added to the cis chamber to demonstrate the characteristic modification in channel behaviour. Holding potential, 44.5 mV.
Figure 10
Figure 10. Voltage dependence of the SR calcium release channel current after incorporation into lipid bilayer
Current values were measured at maximal opening of the channel and were plotted as a function of the holding potential. The charge carrier was K+ and the composition of the medium is described in Methods. Data obtained in the absence (•, 50 μM Ca2+cis) and in the presence of tetracaine (▾, 8.9 μM free calcium concentration, 2 mM total ATP, 200 μM tetracaine, all cis) were fitted with a straight line (shown superimposed). The slopes revealed a conductance value of 524 and 566 pS in the absence and presence of the drug, respectively.
Figure 11
Figure 11. Concentration dependence of the effect of tetracaine on the open probability of the SR calcium release channel
Tetracaine was added to the cis side of the bilayer at concentrations ranging from 25 μM to 1 mM. Open probabilities were calculated from the current records measured in the presence of 2 mM total ATP and were normalized to the value obtained in the absence of the drug. The concentration dependence of the open probabilities was fitted by eqn (3), resulting in a K50 of 68 μM and Hill coefficient of 1.5. Vertical bars indicate s.e.m., the number of experiments are given in parentheses at each point. The superimposed continuous line represents the theoretical concentration dependence with the above parameters.

Similar articles

Cited by

References

    1. Amirsén R, Sierralta J, Vélez P, Naranjo D, Suárez-Isla BA. Modal gating in neuronal and skeletal muscle ryanodine-sensitive Ca2+ release channels. American Journal of Physiology. 1996;271:C144–153. - PubMed
    1. Bianchi CP, Bolton TC. Action of local anaesthetics on coupling systems in muscle. Journal of Pharmacology and Experimental Therapeutics. 1967;157:388–405. - PubMed
    1. Csernoch L, Huang CL-H, Sz´úcs G, Kovács L. Differential effects of tetracaine on charge movements and Ca signals in frog skeletal muscle. Journal of General Physiology. 1988;96:601–612. - PMC - PubMed
    1. Csernoch L, Jacquemond V, Schneider MF. Microinjection of strong calcium buffers suppresses the peak of calcium release in frog skeletal muscle fibres. Journal of General Physiology. 1993;101:297–333. - PMC - PubMed
    1. Dulhunty AF, Gage PW. Asymmetrical charge movement in slow- and fast-twitch mammalian muscle fibres in normal and paraplegic rats. The Journal of Physiology. 1983;341:213–231. - PMC - PubMed

Publication types

MeSH terms

LinkOut - more resources