Review
. 1999 Apr 1;516 ( Pt 1)(Pt 1):1-17.
doi: 10.1111/j.1469-7793.1999.001aa.x.

Contributions of mitochondria to animal physiology: from homeostatic sensor to calcium signalling and cell death

Affiliations
Review

Contributions of mitochondria to animal physiology: from homeostatic sensor to calcium signalling and cell death

M R Duchen. J Physiol. .

Abstract

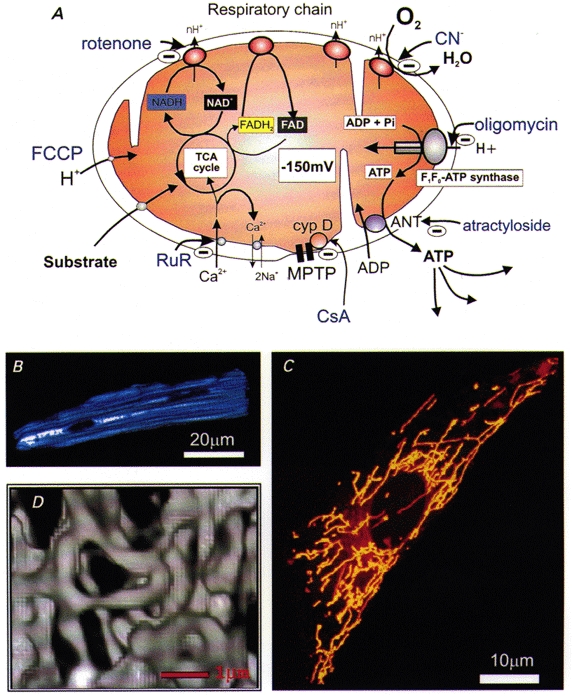
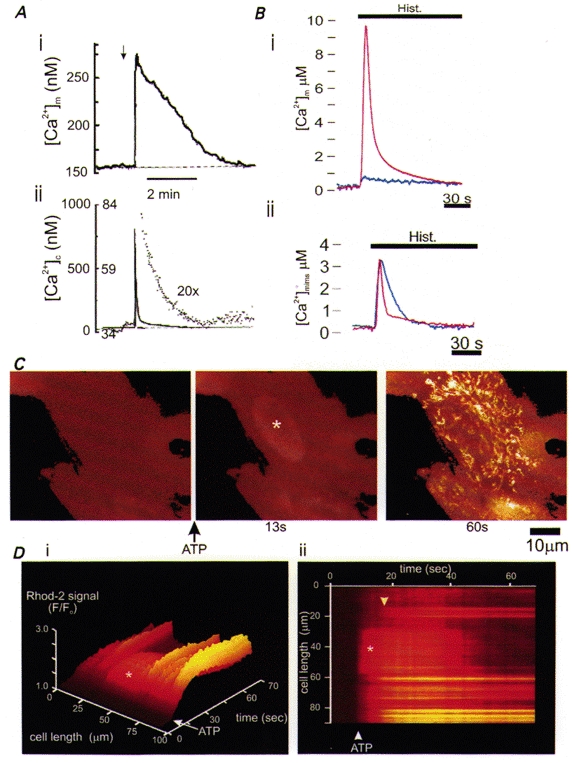
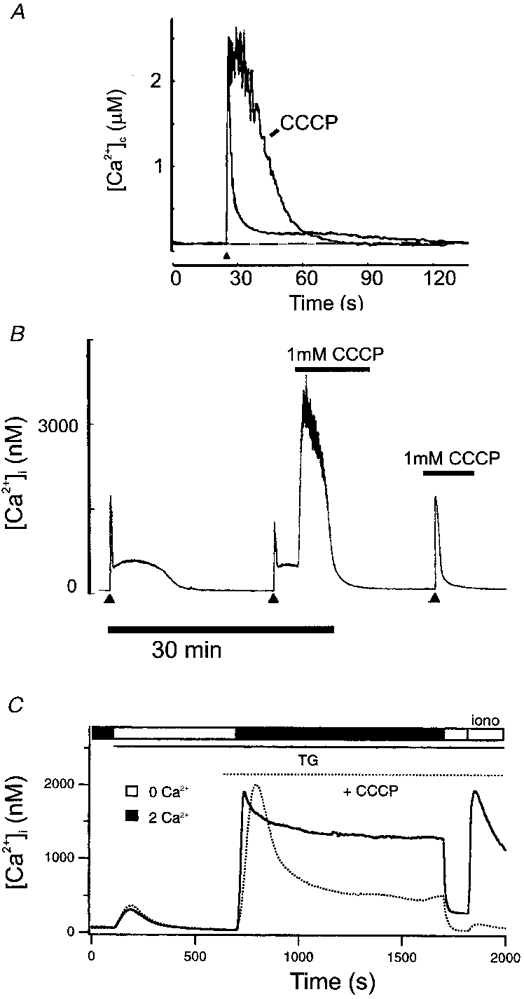
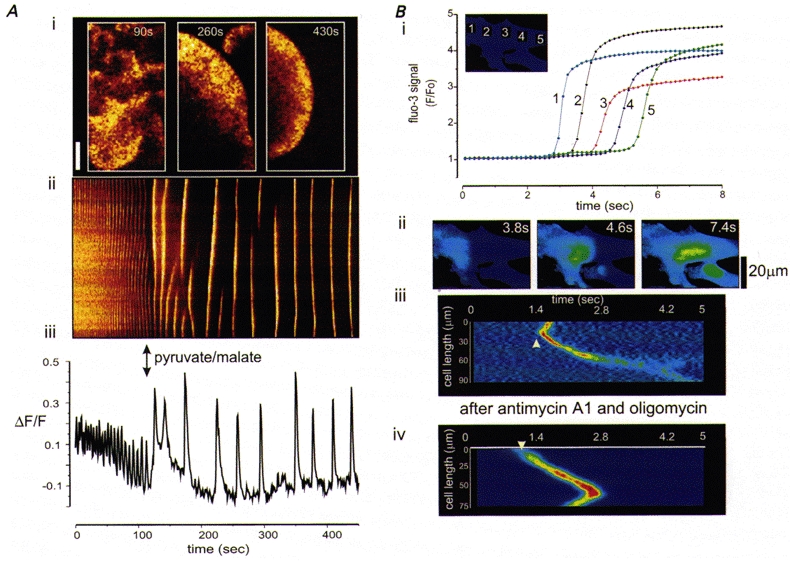
Over recent years, it has become clear that mitochondria play a central role in many key aspects of animal physiology and pathophysiology. Their central and ubiquitous task is clearly the production of ATP. Nevertheless, they also play subtle roles in glucose homeostasis, acting as the sensor for substrate supply in the transduction pathway that promotes insulin secretion by the pancreatic -cell and that modulates the excitability of the hypothalamic glucose-sensitive neurons involved in appetite control. Mitochondria may also act as sensors of availability of oxygen, the other major mitochondrial substrate, in the regulation of respiration. Mitochondria take up calcium, and the high opacity mitochondrial calcium uptake pathway provides a mechanism that couples energy demand to increased ATP production through the calcium-dependent upregulation of mitochondrial enzyme activity. Mitochondrial calcium accumulation may also have a substantial impact on the spatiotemporal dynamics of cellular calcium signals, with subtle differences of detail in different cell types. Recent work has also revealed the centrality of mitochondrial dysfunction as an irreversible step in the pathway to both necrotic and apoptotic cell death. This review looks at recent developments in these rapidly evolving areas of cell physiology in an attempt to draw together disparate areas of research into a common theme.


Figures

Figure 1
Figure 1. Imaging mitochondrial function
A, cartoon of a mitochondrion, illustrating the basic principles of the chemiosmotic basis for oxidative phosphorylation. The supply of substrate (only glucose is shown, but other substrates - ketones and fatty acids - are also used by some cells) to the tricarboxylic acid cycle (TCA or Krebs’ cycle) promotes the reduction of NAD+ to NADH and of FAD to FADH2. As these are re-oxidized, they supply electrons to the respiratory chain. Those electrons are transferred through the enzyme complexes of the respiratory chain to oxygen, with the production of water. In the process, protons are translocated across the inner mitochondrial membrane, generating a potential gradient of approximately -150 to -200 mV (referred to as ΔΨm). ATP synthesis takes place at a separate site, the ATP synthase, which consists of a proton channel (the F0 subunit) and an ATP synthase (the F1 subunit). The enzyme is driven by the downhill movement of protons through the F0 channel and phosphorylates ADP, producing ATP, which is transported out of the mitochondria by the adenine nucleotide translocase (ANT, which also imports ADP). The ANT forms part of the mitochondrial permeability transition pore (MPTP) but has been shown separately for clarity. The sites of action of a number of commonly used reagents are indicated in blue. B-D, images of living mitochondria within single cells. B shows a confocal image to illustrate the distribution of endogenous or ‘auto'fluorescence derived from NADH in a single rat cardiomyocyte illuminated with UV light (at 350 nm). The mitochondria within these cells run longitudinally with the axis of the cell (M. R. Duchen, unpublished observation). In C, the mitochondria of a rat cortical astrocyte have been stained with the potentiometric dye, tetramethyl rhodamine ethyl ester (TMRE), which partitions between the mitochondria and cytosol in response to ΔΨm by virtue of the positive charge on the dye. The image was obtained on a confocal system and shows a reconstruction of a series of confocal slices through the ‘z’ plane (M. R. Duchen, unpublished observations). D shows a 3-dimensional reconstruction of digital fluorescent images of mitochondria expressing targeted green fluorescent protein (GFP) in a HeLa cell, in which the mitochondria appear to form a contiguous but labile network (reproduced from Rizzuto et al. 1998, with permission).
Figure 2
Figure 2. Direct measurements of mitochondrial Ca2+ uptake
A, measurements of mitochondrial [Ca2+] (i) and cytosolic [Ca2+] (ii) in a rat adrenal chromaffin cell following depolarization of the plasma membrane and Ca2+ influx through voltage-gated channels. The brisk [Ca2+]c increase and early recovery (ii) were followed by a prolonged slower decay phase (seen as the dotted and enlarged trace) which coincided with the time course of the slow decline in [Ca2+]m revealed with rhod-2 fluorescence (i) (modified from Babcock et al. 1997, with permission). B: (i) stimulation of a HeLa cell with histamine mobilizes Ca2+ from IP3-sensitive ER stores. The red trace shows the rise in [Ca2+]m revealed with aequorin targeted to the mitochondrial matrix. Note the very large increase in [Ca2+]m which was abolished by pretreatment with FCCP (blue trace), preventing mitochondrial Ca2+ uptake. (ii), an aequorin construct targeted to the mitochondrial intermembrane space (mims) to sense local changes in [Ca2+]c showed a brisk but smaller rise in [Ca2+] in response to the same stimulus. Pretreatment with FCCP had no significant effect on the amplitude of the response but significantly slowed the decay phase, consistent with a role of mitochondrial uptake in removing [Ca2+]c. (These data were obtained from populations of cells; from Rizzuto et al. 1998, with permission.) C shows digital fluorescence images of rat cortical astrocytes loaded with rhod-2, normalized with respect to the first image to reveal relative changes in signal. Stimulation with ATP (100 μM) to mobilize Ca2+ from ER stores raised [Ca2+]c first, best seen over the nucleus (*, at 13 s into the sequence), followed later by a large and sustained increase over the mitochondria. This is illustrated further by the images in D, which show the evolution of the signal with time, measured as an intensity profile along a line selected along the axis of the cell and displayed as a surface plot in (i) and as a ‘line image’, seen as if from above in (ii). The relatively fast and transient increase over the nucleus (*) contrasts with the slower but sustained increase in signal over the mitochondria (downward-pointing arrowhead) (M. R. Duchen & E. Boitier, unpublished observations).
Figure 3
Figure 3. Impact of mitochondrial Ca2+ uptake on global [Ca2+]c signalling in a variety of cell types
A, in a bovine adrenal chromaffin cell, a brief depolarization caused a transient rise and rapid recovery of [Ca2+]c which was followed by a prolonged ‘tail’ phase of slow recovery (cf. Fig. 2A). Preventing mitochondrial Ca2+ uptake by prior depolarization of ΔΨm with CCCP: (i) increased the amplitude of the response; (ii) greatly slowed recovery; and (iii) abolished the slow recovery phase (modified from Herrington et al. 1996, with permission). B, a similar pattern of [Ca2+]c signal was seen in sensory neurons: a large [Ca2+]c load following prolonged depolarization showed a biphasic recovery - a rapid phase followed by a prolonged secondary plateau. Depolarization of ΔΨm by the application of CCCP during the plateau caused a massive increase in [Ca2+]c, suggesting Ca2+ release from Ca2+-loaded mitochondria. Prior application of CCCP abolished the plateau phase completely (modified from Werth & Thayer, 1994, with permission). C, in a population of T lymphocytes, capacitative Ca2+ influx was studied thus: internal stores were emptied by inhibition of the ER Ca2+ ATPase with thapsigargin (TG) in the absence of external Ca2+. Reintroduction of [Ca2+]o caused a large sustained [Ca2+]c signal. If Ca2+ was then again removed, a challenge with ionomycin revealed that an internal store, probably mitochondrial, had now been filled. With mitochondrial uptake disabled with CCCP (dotted line), the sustained component of the capacitative influx signal was much reduced, and the final ionomycin challenge confirmed the lack of mitochondrial Ca2+ accumulation. This, along with other data from the study, showed that mitochondrial uptake helps to define the characteristics of capacitative Ca2+ influx (modified from Hoth et al. 1997, with permission).
Figure 4
Figure 4. Impact of mitochondrial Ca2+ uptake on propagated [Ca2+]c waves
A shows the effect of mitochondrial energization on the properties of [Ca2+]c waves in Xenopus oocytes. [Ca2+]c waves in a Xenopus oocyte triggered by flash photolytic release of a caged, non-hydrolysable analogue of IP3 were initially chaotic and small in amplitude. Following microinjection of the mitochondrial substrates pyruvate and malate (at the time indicated by the arrows), mitochondrial potential increased (measured separately) and the waves became increasingly co-ordinated, larger in amplitude, and the rate of propagation increased. A(i) shows examples of the waves before (90 s) and after (at 240 and 480 s) injection of the substrates. A(ii) shows a line image to illustrate the characteristics of the waves with time, and a plot of amplitude with time for a single point in the cell is shown in (iii) (modified from Jouaville et al. 1995, with permission). B, mitochondrial Ca2+ uptake has opposite effects on the propagation of [Ca2+]c waves in rat cortical astrocytes in culture. B (i) shows a plot of intensity with time at a series of equidistant points through a single cell. The images in B (ii) illustrate the spread of the [Ca2+]c signal through the cell with time. To obtain the images shown in (iii) and (iv), which illustrate the propagating wave front, the image series was differentiated (a process of sequential subtractions that reveals a signal only in pixels in which the signal changed). A line was then selected along the axis of the cell and the colour-coded intensity profile along that line was plotted as a function of time, revealing the wave front as a diagonal band as it progressed across the cell with time. The rate of propagation of the wave clearly increased in cells in which mitochondrial Ca2+ accumulation was abolished by dissipating ΔΨm (iv), using antimycin A1 combined with oligomycin, to limit mitochondrial ATP consumption (M. R. Duchen, R. Rea & E. Boitier, unpublished observations).
Figure 5
Figure 5. Impact of mitochondrial Ca2+ uptake on mitochondrial potential
A, microdomains of high [Ca2+]c due to release from SR or ER cause brief transient depolarizations of mitochondria. These events were seen in single cells loaded with the potentiometric probe, tetramethyl rhodamine ethyl ester (TMRE), involving either clusters of mitochondria or even a single mitochondrion, as shown in (ii) in a neonatal cardiomyocyte in culture. The time course of the event is illustrated in (iii) in which the intensity profile along a line selected through the mitochondrion is shown with time. The mean intensity plotted with time is superimposed. These events were abolished by ryanodine or intracellular calcium chelation. B, a similar process operates during co-ordinated [Ca2+]c signalling, illustrated during a [Ca2+]i wave in a cardiomyocyte (also loaded with TMRE). A [Ca2+]i wave in these cells causes a contractile wave which was associated here with a wave of mitochondrial depolarization, seen as an increase in fluorescence signal. The line image (ii) illustrates the evolution of the signal with time along a line selected along the axis of the cell (shown in (i), white line). The contraction started first at the upper margin (the top left in (i) and propagated along the length of the cell. The contraction can be seen at the edges of the line image (arrows) as the line extended beyond the edges of the cell (modified from Duchen et al. 1998, with permission). Two spontaneous transient events of similar amplitude as the wave were seen later (*). C shows simultaneous measurements of [Ca2+]c and ΔΨm made in rat hippocampal neurons in culture using fura-2 (•) and rhodamine 123 (continuous lines). (i), depolarization of the plasma membrane with 50 mM KCl for 10 min raised [Ca2+]c but caused only a small transient mitochondrial depolarization. (ii), depolarization for 10 min with glutamate under conditions that caused 75 % cell death 24 h later, also raised [Ca2+]c but caused a progressive and very nearly complete dissipation of ΔΨm (note that the response could barely be increased further by application of FCCP; J. Keelan, O. Vergun & M. R. Duchen, unpublished observations, but see Keelan et al. 1998).

References

    1. Acker H. Oxygen sensing in the carotid body: ideas and models. Advances in Experimental Medicine and Biology. 1994;360:21–27. - PubMed
    1. Anichkov SV, Belen'kii ML. Pharmacology of the Carotid Body Chemo-receptors. New York: MacMillan; 1963.
    1. Ashcroft FM, Gribble FM. Correlating structure and function in ATP-sensitive K+ channels. Trends in Neurosciences. 1998;21:288–294. - PubMed
    1. Ashcroft FM, Rorsman P. ATP-sensitive K+ channels: a link between B-cell metabolism and insulin secretion. Biochemical Society Transactions. 1989;18:109–111. - PubMed
    1. Ashford ML, Boden PR, Treherne JM. Glucose-induced excitation of hypothalamic neurones is mediated by ATP-sensitive K+ channels. Pflügers Archiv. 1990;415:479–483. - PubMed

Publication types

LinkOut - more resources