. 1999 Apr 1;516 ( Pt 1)(Pt 1):19-30.
doi: 10.1111/j.1469-7793.1999.019aa.x.

Beta2-adrenergic receptor overexpression in the developing mouse heart: evidence for targeted modulation of ion channels

Affiliations

Beta2-adrenergic receptor overexpression in the developing mouse heart: evidence for targeted modulation of ion channels

R An et al. J Physiol. .

Abstract

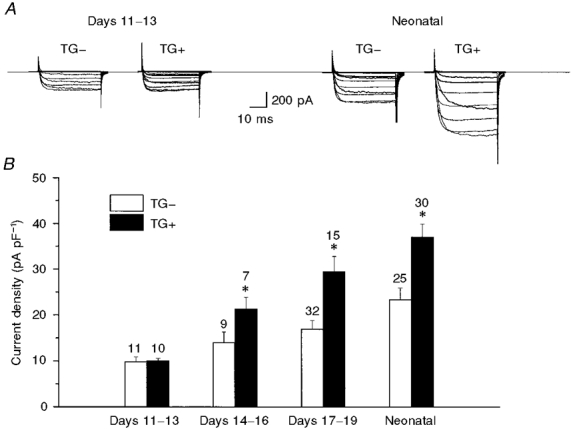
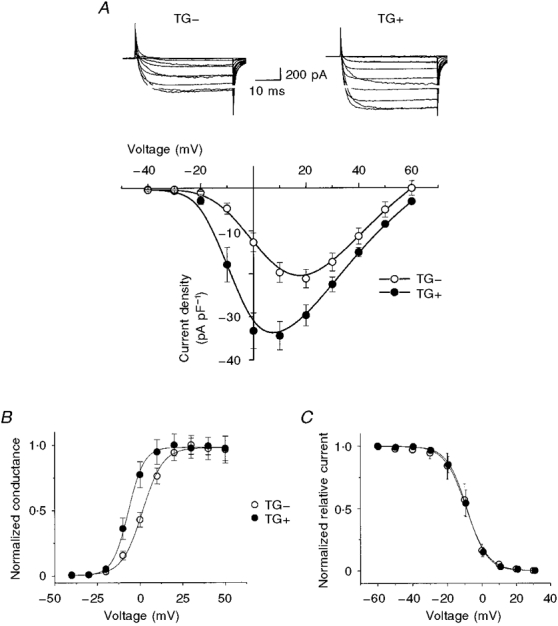
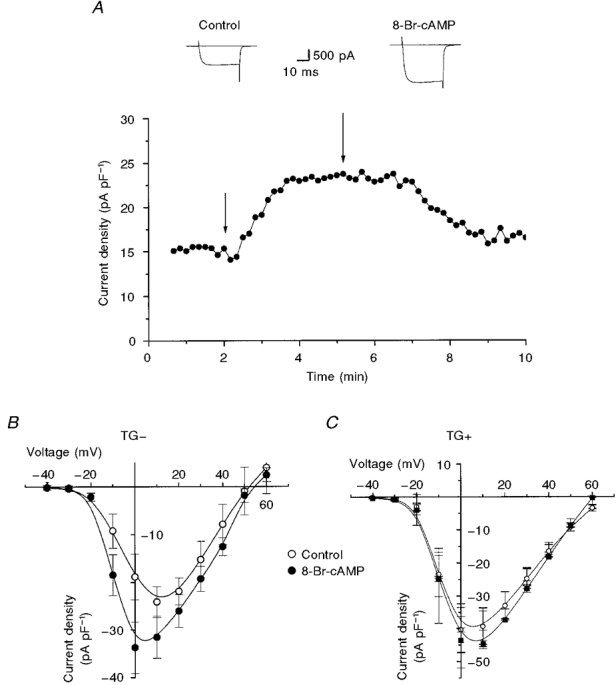
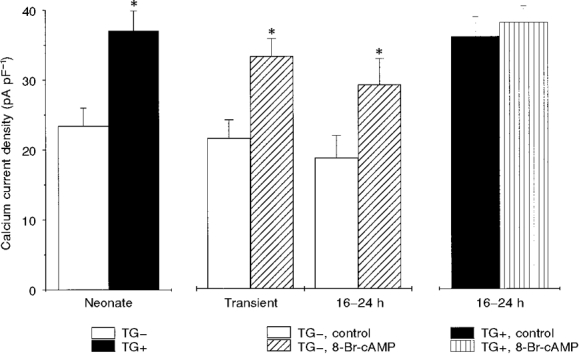
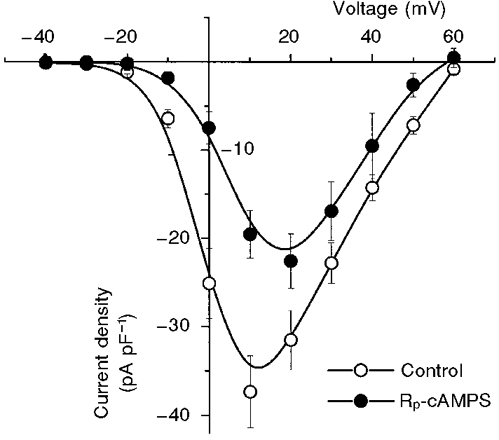
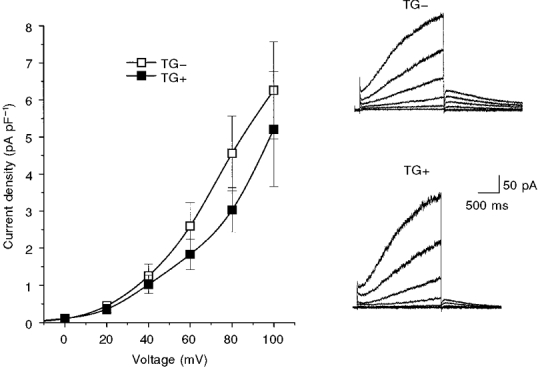
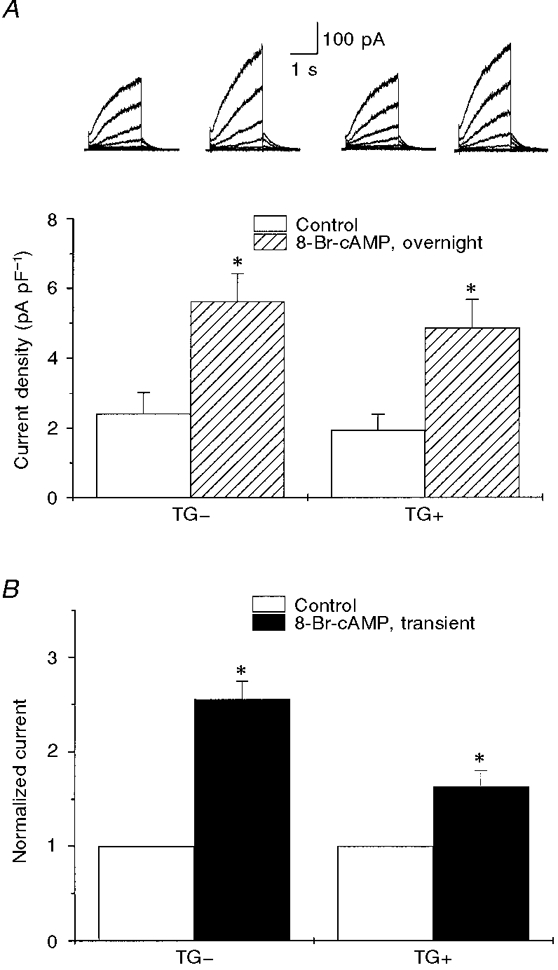
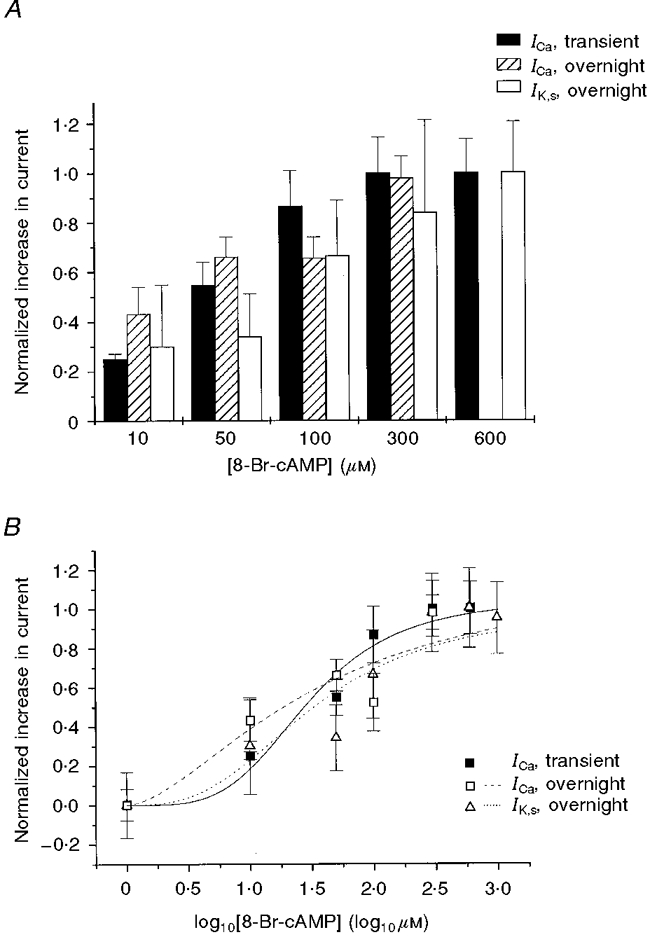
1. We studied the effect of overexpression of the beta2-adrenergic receptor (beta2-AR) in the heart on ion channel currents in single cells isolated from hearts of fetal and neonatal transgenic and wild-type mice. The beta2-AR transgene construct was under the control of the murine alpha-myosin heavy chain (alpha-MHC) promoter, and ion channel activity was measured at distinct developmental stages using whole-cell and perforated patch clamp techniques. 2. We found no change in L-type Ca2+ channel current (ICa) density in early embryonic stages (E11-13) of beta2-AR transgenic positive (TG+) mice, but significant increases in ICa density in intermediate (E14-16, 152 %) and late (E17-19, 173.7 %) fetal and neonatal (1 day post partum, 161 %) TG+ compared with transgenic negative (TG-) mice. This increase in ICa was accompanied by a negative shift in the peak of the current-voltage relationship in TG+ mice. 3. Transient (< 3 min) or prolonged (16-24 h) exposure of TG- neonatal stage myocytes to 8-Br-cAMP (300 microM) increased ICa density and caused a shift in the current-voltage relationship to a similar extent to that seen in TG+ mice. In TG+ myocytes, 8-Br-cAMP had no effect. Exposure of TG+ cells to Rp-cAMPS reversed both the shift in voltage dependence and reduced the peak current density observed in these myocytes. We concluded from these results that the L-type Ca2+ channel is maximally modulated by cAMP-dependent protein kinase (PKA) in TG+ mice and that the alpha-MHC promoter is functional in the ventricle as early as embryonic day 14. 4. In contrast, we found that slow delayed rectifier K+ channels were not changed significantly at any of the developmental stages studied by the overexpression of beta2-ARs compared with TG- mice. The sensitivity of murine slow delayed rectifier K+ channels to cAMP was tested by both transient and prolonged exposure to 8-Br-cAMP (300 microM), which increased the slow delayed rectifier K+ channel current (IK,s) density to a similar extent in both TG- and TG+ neonatal myocytes. In addition, we found that there was no difference in the concentration dependence of the response of ICa and IK,s to 8-Br-cAMP. 5. Thus, overexpression of the beta2-AR in the heart results in distinct modulation of ICa, but not IK,s, and this is not due to differences in the 8-Br-cAMP sensitivity of the two channels. Instead, these results are consistent with both compartmentalization of beta2-AR-controlled cAMP and distinct localization of L-type Ca2+ and slow delayed rectifier K+ channels. This cAMP is targeted preferentially to the L-type Ca2+ channel and is not accessible to the slow delayed rectifier K+ channel.


Figures

Figure 1
Figure 1. β2-AR overexpression increases ICa in the developing mouse heart
A, current traces illustrating families of currents (for voltages, see Methods) measured in cells from TG- and TG+ early stage embryonic (left) and neonatal (right) hearts. B, bar graph summarizing peak ICa density recorded at +10 mV from a large number of cells (indicated above each bar) for three embryonic stages and for neonatal cells. * Significant difference compared with TG-, P < 0.01.
Figure 2
Figure 2. Voltage-dependent changes in ICa in TG+ cells
A, mean peak current-voltage relationships for TG+ ( n = 25) and TG- ( n = 20) cells. Note that the peak of the relationship occurred near +5 mV for TG+ and near +15 mV for TG- cells. The current traces (top) illustrate typical TG- (left) and TG+ (right) recordings (see Methods for voltage protocol). B, conductance- voltage relationships determined from A by normalizing currents to driving force. The smooth curves are Boltzmann fits to the data with the following parameters: potential at half-maximal activation (V½) = -7 mV, slope factor (VK) = 5.2 mV (TG+); V½ = 1.8 mV, VK = 6.5 mV (TG-). C, β2-AR overexpression did not affect ICa steady-state inactivation. Steady-state inactivation was measured using 5 s conditioning pulses for TG+ and TG- cells. The smooth curves are Boltzmann relationships: potential at half-maximal inactivation (V½) = -8.6 mV; VK = 5.8 mV.
Figure 3
Figure 3. Influence of 8-Br-cAMP on ICa in TG- and TG+ cells
A, transient exposure to 8-Br-cAMP (300 μM) reversibly increased the peak ICa (activated by repeated 40 ms depolarizations to +10 mV) in a TG- cell. Typical Ca2+ channel currents shown above the plot were sampled at the points indicated by the arrows. B, mean current-voltage relationships for ICa in TG- cells before (Control) and after overnight (16-24 h) exposure to 8-Br-cAMP (n = 4-6). C, mean current-voltage relationships for ICa in TG+ cells in which overnight exposure to 8-Br-cAMP had no significant effect (P > 0.05; n = 6-18).
Figure 4
Figure 4. Comparison of the effects of β2-AR overexpression and 8-Br-cAMP (300 μM) on peak ICa
Bar graphs summarizing peak current densities recorded at +10 mV. Left, peak currents in TG- (n = 26) vs. TG+ (n = 30) cells. Middle, peak current density in TG- cells before and after transient (< 3 min; middle left, n = 6 each) and prolonged (16-24 h; middle right, n = 8 each) exposure to 8-Br-cAMP. * There was no significant difference between the enhancement of peak ICa in the TG+ cells (left) and that produced by 8-Br-cAMP in TG- cells (middle; unpaired t test, P > 0.05). Right, peak current density before and after prolonged exposure of TG+ cells to the same concentration of 8-Br-cAMP.
Figure 5
Figure 5. Effect of Rp-cAMPS on ICa recorded from TG+ cells
Mean ( n = 6) peak current-voltage relationships for currents measured in TG+ cells before (Control) and after exposure to Rp-cAMPS (300 μM). Steady-state effects which were obtained within 3-5 min of exposure to the PKA inhibitor are shown. Note that the peak of the current-voltage relationship was shifted to positive voltages and reduced in amplitude.
Figure 6
Figure 6. β2-AR overexpression did not affect IK,s
Right, representative traces of IK,s (activated by isochronal 2 s depolarizations from -40 to +60 mV in 20 mV increments from a holding potential of -40 mV) recorded from TG- (top) and TG+ (bottom) cells. Left, the mean current-voltage relationships for time-dependent IK,s activated during depolarization for TG- ( n = 19) and TG+ ( n = 20) cells (neonatal stage). There was no significant difference between TG- and TG+ currents at any voltage.
Figure 7
Figure 7. Effects of 8-Br-cAMP on IK,s in TG+ and TG- cells
A shows mean IK,s density measured at +40 mV in TG- and TG+ cells in the absence of 8-Br-cAMP (Control) and after 16-24 h incubation in the presence of 8-Br-cAMP (300 μM), n = 5-18. Representative IK,s traces (at +60 mV) before and after exposure to cAMP in TG- and TG+ cells are shown above the bars. * Significant difference compared with control, P < 0.01. B shows the relative IK,s amplitude before (Control) and after transient (< 3 min) exposure to 300 μM 8-Br-cAMP in TG- and TG+ cells. Currents were normalized to those in control (n = 2-6). * Significant difference compared with control, P < 0.01.
Figure 8
Figure 8. Concentration dependence of IK,s and ICa response in TG- cells to 8-Br-cAMP
A, bar graph summarizing the normalized change in ICa (measured at +10 mV) following transient and 16-24 h (overnight) exposures to 8-Br-cAMP and the change in IK,s following 16-24 h exposure to 8-Br-cAMP (measured at +40 mV) as a function of [8-Br-cAMP]. There was no significant difference between groups at each 8-Br-cAMP concentration (P > 0.3). B, log concentration-response curves for ICa and IK,s (normalized change in peak ICa for transient and 16-24 h exposures and in peak IK,s for 16-24 h exposure plotted against [8-Br-cAMP]).

References

    1. Aass H, Skomedal T, Osnes JB. Increase of cyclic AMP in subcellular fractions of rat heart muscle after β-adrenergic stimulation: prenalterol and isoprenaline caused different distribution of bound cyclic AMP. Journal of Molecular and Cellular Cardiology. 1988;20:847–860. - PubMed
    1. An RH, Davies MP, Doevendans PA, Kubalak SW, Bangalore R, Chien KR, Kass RS. Developmental changes in β-adrenergic modulation of L-type calcium channels in embryonic mouse heart. Circulation Research. 1996;78:371–378. - PubMed
    1. Bond RA. Do recent operational studies indicate that a single state model is no longer applicable to G protein-coupled receptors? Annals of the New York Academy of Sciences. 1997;812:92–97. - PubMed
    1. Bond RA, Leff P, Johnson TD, Milano CA, Rockman HA, McMinn TR, Apparsundaram S, Hyek MF, Kenakin TP, Allen LF. Physiological effects of inverse agonists in transgenic mice with myocardial overexpression of the β2-adrenoceptor. Nature. 1995;374:272–276. - PubMed
    1. Bristow MR, Ginsburg R, Minobe W, Cubicciotti RS, Sageman WS, Lurie K, Billingham ME, Harrison DC, Stinson EB. Decreased catecholamine sensitivity and β-adrenergic-receptor density in failing human hearts. New England Journal of Medicine. 1982;307:205–211. - PubMed

Publication types

MeSH terms

LinkOut - more resources