. 1999 Apr 1;516 ( Pt 1)(Pt 1):31-43.
doi: 10.1111/j.1469-7793.1999.031aa.x.

Feedback inhibition of rat amiloride-sensitive epithelial sodium channels expressed in Xenopus laevis oocytes

Affiliations

Feedback inhibition of rat amiloride-sensitive epithelial sodium channels expressed in Xenopus laevis oocytes

H Abriel et al. J Physiol. .

Abstract

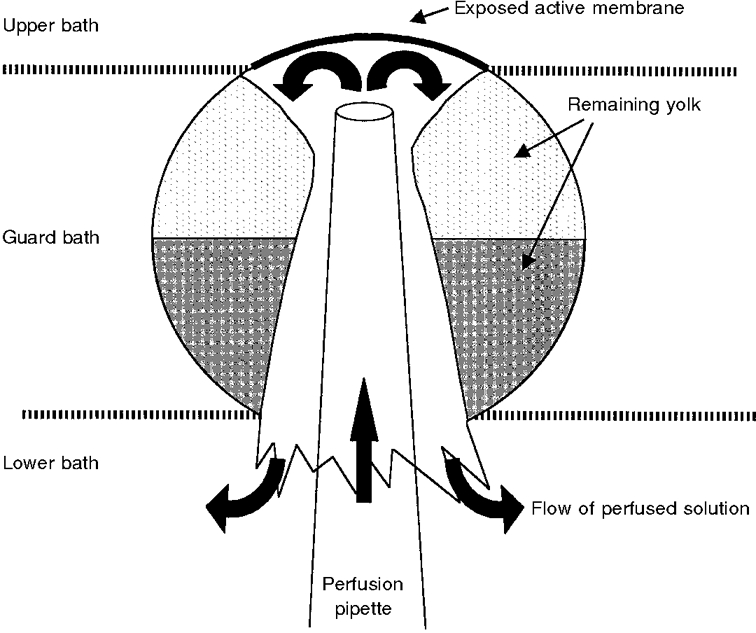
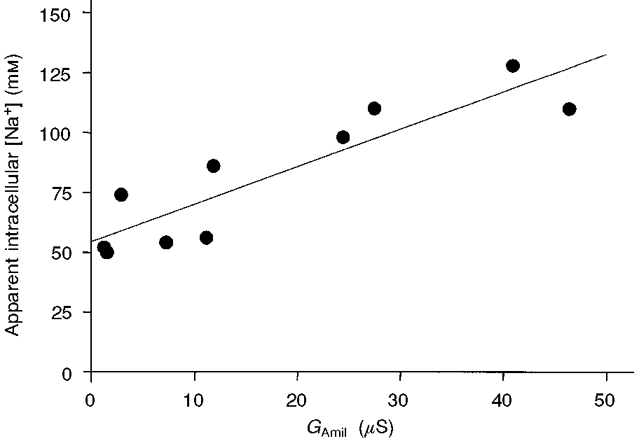
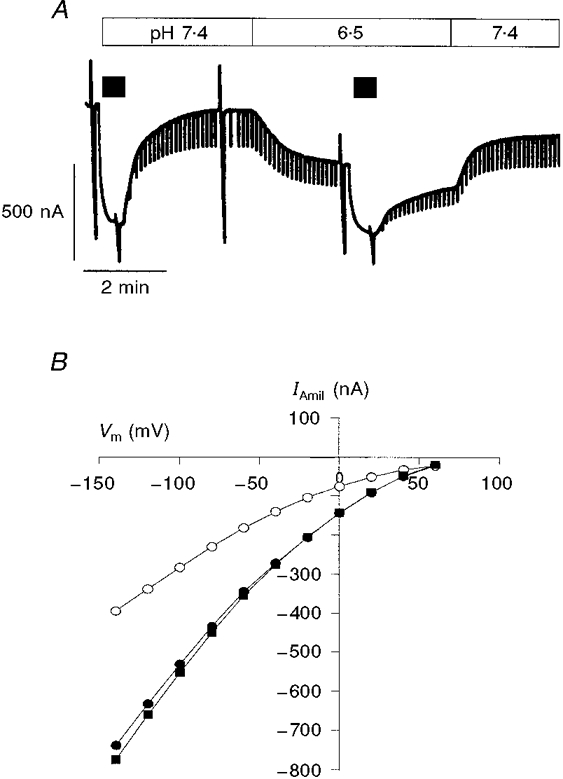
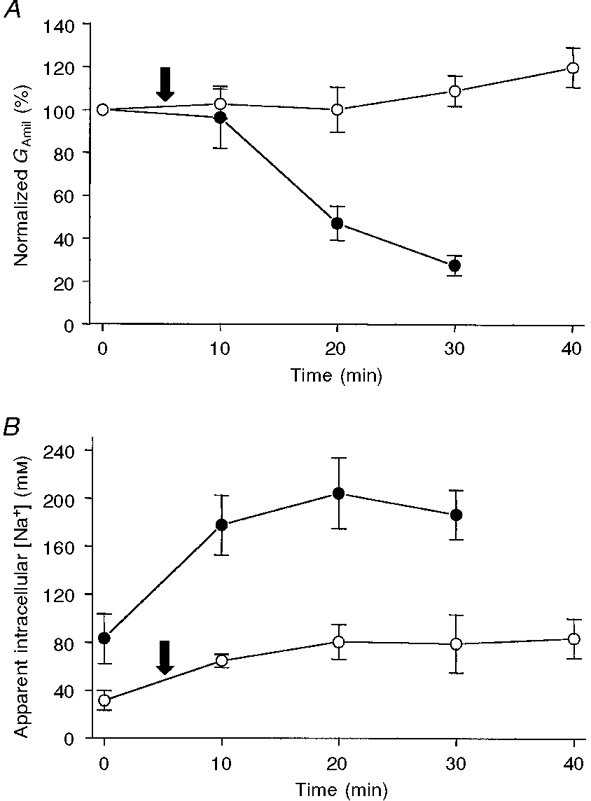
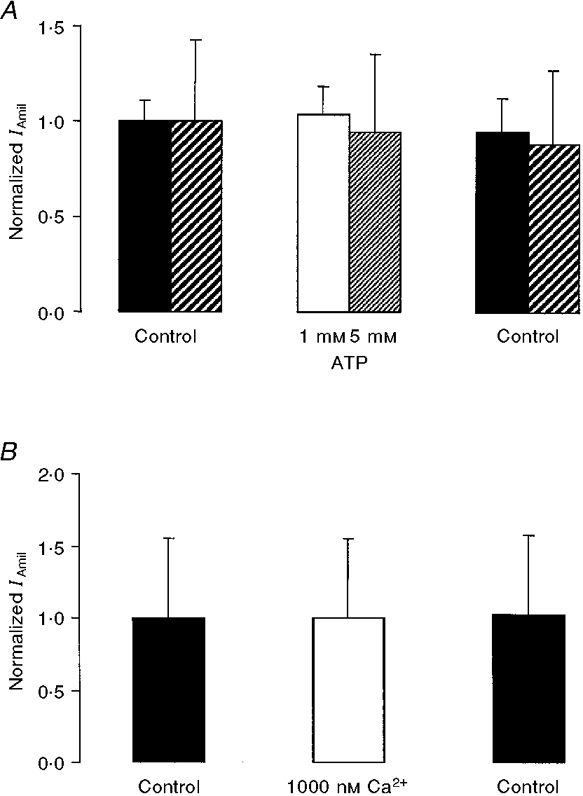
1. Regulation of the amiloride-sensitive epithelial sodium channel (ENaC) is essential for the control of body sodium homeostasis. The downregulation of the activity of this Na+ channel that occurs when the intracellular Na+ concentration ([Na+]i) is increased is known as feedback inhibition. Although intracellular Na+ is the trigger for this phenomenon, its cellular and molecular mediators are unknown. 2. We used the 'cut-open oocyte' technique to control the composition of the intracellular milieu of Xenopus oocytes expressing rat ENaCs to enable us to test several factors potentially involved in feedback inhibition. 3. The effects of perfusion of the intracellular space were demonstrated by an electromicrographic study and the time course of the intracellular solution exchange was established by observing the effect of intracellular pH: a decrease from pH 7.4 to 6.5 reduced the amiloride-sensitive current by about 40 % within 2 min. 4. Feedback inhibition was observed in non-perfused oocytes when Na+ entry induced a large increase in [Na+]i. Intracellular perfusion prevented feedback regulation even though the [Na+]i was allowed to increase to values above 50 mM. 5. No effects on the amiloride-sensitive current were observed after changes in the concentration of Na+ (from 1 to 50 mM), Ca2+ (from 10 to 1000 nM) or ATP (from nominally free to 1 or 5 mM) in the intracellular perfusate. 6. We conclude that feedback inhibition requires intracellular factors that can be removed by intracellular perfusion. Although a rise in [Na+]i may be the trigger for the feedback inhibition of the ENaC, this effect is not mediated by a direct effect of Na+, Ca2+ or ATP on the ENaC protein.


Figures

Figure 1
Figure 1. Schematic illustration of oocyte intracellular perfusion by the cut-open oocyte technique
Illustration of an oocyte (≈1 mm in diameter) mounted in the cut-open oocyte chamber (not shown). The chamber consisted of three compartments, of which the upper/extracellular compartment was continually perfused and was in contact with the exposed membrane of the oocyte through a hole of ≈500 μm diameter. The guard compartment allowed for electrical isolation between the upper bath and the lower/intracellular bath. For details of the electrical circuit, see Taglialatela et al. (1992) and Costa et al. (1994). The pipette for perfusion and voltage recording (tip ≈100 μm) was inserted into the animal (dark) pole of the oocyte and advanced to just below (100-300 μm below) the membrane. The flow of solution (filled arrows) removed almost all visible yolk platelets below the studied membrane and formed a yolk-free ‘cone’ in the middle of the cell. The solution flowed back and around the pipette and through the opening made by the impalement.
Figure 2
Figure 2. Electron micrograph of the plasma membrane of control and perfused oocytes
A, cortical region of one representative oocyte expressing ENaCs, which was voltage clamped at -100 mV for 20 min using the two-electrode voltage-clamp technique. The microvilli of the plasma membrane, just below the vitelline membrane (VM) surrounding the oocyte, can be easily recognized. Yolk platelets (Y) and cortical (C) and pigment (P) granules can be seen below the membrane. Dense ferritine patches are attached to the vitelline membrane. B, electron micrograph of the membrane of an oocyte which had been perfused using the cut-open oocyte set-up. The general architecture of the microvilli was not modified. However, the density of the cytosolic granulations below the membrane and within the microvilli was clearly decreased. Despite the perfusion, a layer of cytosolic structures (yolk platelets, cortical and pigment granules) remained attached to the membrane. This micrograph illustrates the three postulated zones within which the intracellular and extracellular perfusions do not cause convectional flux and where the Na+ concentration is influenced only by diffusion: (i) the space between the vitelline and plasma membranes, (ii) the compartment within the microvilli, and (iii) the layer of remaining cytosolic structures. Scale bars, 10 μm.
Figure 3
Figure 3. Current-voltage curves obtained using the cut-open oocyte technique
A, current recordings obtained from a cut-open oocyte perfused with intracellular and extracellular solutions containing 50 mM Na+ during a series of 175 ms square voltage pulses ranging from -140 to +60 mV. The exposed membrane (at the vegetal pole of the oocyte) had a diameter of ≈500 μm. B, current recordings as in A obtained after application of 5 μM amiloride. C, amiloride-sensitive currents (i.e. A - B). D, current-voltage relationships for the whole-membrane current (•), residual current after application of amiloride (▪) and amiloride-sensitive current (IAmil, ○). The currents were measured 150 ms after the beginning of the voltage pulse. Vm, membrane potential.
Figure 4
Figure 4. Relationship between the apparent intracellular sodium concentration, [Na+]i, and the amiloride-sensitive conductance (GAmil) of the exposed membrane
The apparent [Na+]i values were calculated from the reversal potential of the amiloride-sensitive current using a nominal external Na+ concentration of 50 mM. All these values (n = 10) were measured after a 30 min period during which the membrane potential was maintained at -100 mV and the intracellular side was continuously perfused with a 50 mM Na+ solution. During this period, GAmil was stable (i.e. no run-down). The straight line is the linear regression for [Na+]iversusGAmil and demonstrates a statistically significant correlation (r2 = 0.81, P < 0.001). Note that the intercept on the ordinate is close to 50 mM, which is the nominal Na+ concentration of the perfused intracellular solution. This relationship indicates the existence of a compartment just below the membrane, an intracellular unstirred layer, in which [Na+]i is influenced by the inflow of Na+.
Figure 5
Figure 5. Effect of intracellular perfusion: acidification
A, effect on IAmil resulting from acidification of the intracellular perfusion solution from pH 7.4 to 6.5 (filled bars above the current trace represent application of 5 μM amiloride). At a flow rate of 5 μl min−1, acidification decreased IAmil by about 40 %; IAmil reached a new steady state after about 2 min. When the pH was returned to control, in this example, IAmil reached about 85 % of the initial control current. The holding potential was -100 mV and the downward current deflections are due to the voltage steps to -60 mV used to monitor the membrane conductance. B, current-voltage relationships for IAmil before (•), during (○) and after (▪) a 3 min exposure to a pH 6.5 intracellular solution. In this example, the pH effect was fully reversible. The extracellular [Na+] was 50 mM and the perfused [Na+] was 1 mM.
Figure 6
Figure 6. Inhibition of ENaC downregulation during intracellular perfusion
Original current recordings under cut-open oocyte conditions showing the decrease in IAmil when the membrane was clamped at -100 mV (downward deflections are due to voltage pulses to -60 mV). Filled bars above the current traces represent application of 5 μM amiloride. In A, the oocyte was impaled by the pipette but not perfused, the pipette being used only to record the intracellular voltage. The extracellular solution contained 50 mM Na+. B, when the intracellular side of the oocyte was perfused with a solution containing 20 mM Na+ (extracellular [Na+], 20 mM), IAmil remained stable over a 30-40 min period. C, a similar abolition of IAmil run-down was also seen when, after an initial 5-10 min perfusion with a 1 mM Na+ intracellular solution (up to the time indicated by the arrow), the oocyte was perfused with a 50 mM Na+ solution (extracellular [Na+], 50 mM). No significant effect on IAmil or GAmil was observed following this increase in the Na+ concentration of the intracellular perfusate.
Figure 7
Figure 7. Run-down of the amiloride-sensitive conductance (with a concomitant increase in [Na+]i) and its inhibition by intracellular perfusion
A, when the oocytes were not perfused (•; [Na+]o = 50 mM), GAmil decreased to about 30 % of its control value after 30 min of voltage clamping at -100 mV. By contrast, when the cell was perfused (○) with a 50 mM Na+ intracellular solution, GAmil remained stable for at least 40 min. For non-perfused and perfused oocytes, the initial current values were 1.57 ± 0.31 μA ( n = 6) and 1.78 ± 0.65 μA (n = 6), respectively, and the initial conductances were 18.7 ± 7.4 and 16.8 ± 3.5 μS. For the perfused oocytes, note that the first GAmil value was measured when the cell was perfused with 1 mM Na+; the Na+ concentration was changed to 50 mM at the time indicated by the arrow. This change from a 1 to a 50 mM Na+ intracellular perfusion did not lead to a modification in GAmil. B, in non-perfused oocytes (•), even though the oocytes were incubated in 1 mM Na+, the values of the apparent [Na+]i had already reached 80 mM at the time of the first measurement. The apparent [Na+]i then increased to a mean value of about 200 mM. When the oocyte was intracellularly perfused with 50 mM Na+ (○; first 5 min with 1 mM: arrow; see A), the mean apparent [Na+]i reached a plateau at about 80 mM. The actual values were between 59 and 128 mM after 40 min and were a function of the measured GAmil (see Fig. 4).
Figure 8
Figure 8. Effect of acute change in intracellular ATP and Ca2+ concentrations
A, ATP at 1 or 5 mM did not influence IAmil (absolute initial values for 1 and 5 mM ATP, respectively: 0.4 ± 0.05 μA, n = 3 and 1.0 ± 0.4 μA, n = 3). B, when the calculated free Ca2+ concentration was increased from less than 10 nM to 1000 nM, no change in IAmil was observed (absolute initial value: 1.2 ± 0.7 μA, n = 3). Note: in both cases, the nominal extracellular Na+ concentration was 90 mM and the intracellular Na+ concentration was 20 mM. IAmil values for Ca2+ or ATP (normalized with respect to Control) were obtained 4-5 min or 3 min, respectively, after the intracellular solution exchange, the flow rate being 5 μl min−1 in each case.

References

    1. Benos DJ, Fuller CM, Shlyonsky VG, Berdiev BK, Ismailov II. Amiloride-sensitive Na+ channels - insights and outlooks. News in Physiological Sciences. 1997;12:55–61.
    1. Carmeliet E. A fuzzy subsarcolemmal space for intracellular Na+ in cardiac cells? Cardiovascular Research. 1992;26:433–442. - PubMed
    1. Chang D, Hsieh PS, Dawson DC. Calcium: a program in BASIC for calculating the composition of solutions with specified free concentrations of calcium, magnesium and other divalent cations. Computers in Biology & Medicine. 1988;18:351–366. - PubMed
    1. Chang SS, Grunder S, Hanukoglu A, Rosler A, Mathew PM, Hanukoglu I, Schild L, Lu Y, Shimkets RA, Nelson-Williams C, Rossier BC, Lifton RP. Mutations in subunits of the epithelial sodium channel cause salt wasting with hyperkalaemic acidosis, pseudohypoaldosteronism type 1. Nature Genetics. 1996;12:248–253. - PubMed
    1. Chraïbi A, Vallet V, Firsov D, Kharoubi-Hess S, Horisberger J-D. Protease modulation of the activity of the epithelial sodium channel expressed in Xenopus oocytes. Journal of General Physiology. 1998;111:127–138. - PMC - PubMed

Publication types

MeSH terms

LinkOut - more resources