. 1999 Apr 1;516 ( Pt 1)(Pt 1):163-78.
doi: 10.1111/j.1469-7793.1999.163aa.x.

The cAMP transduction cascade mediates the PGE2-induced inhibition of potassium currents in rat sensory neurones

Affiliations

The cAMP transduction cascade mediates the PGE2-induced inhibition of potassium currents in rat sensory neurones

A R Evans et al. J Physiol. .

Abstract

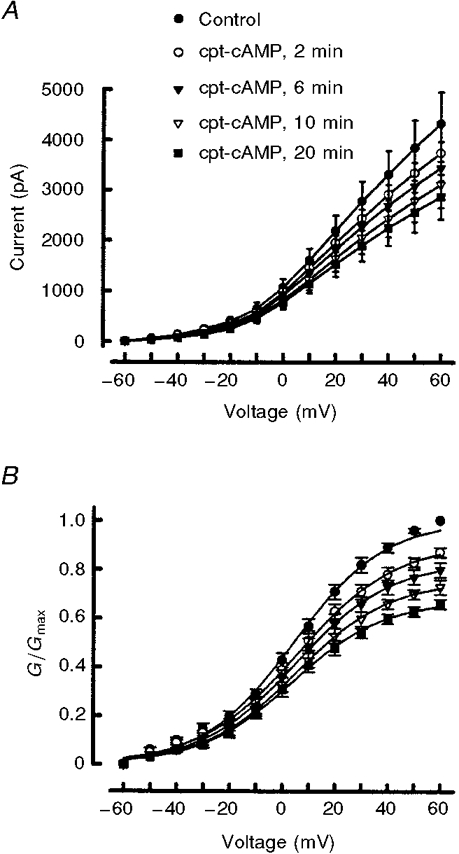
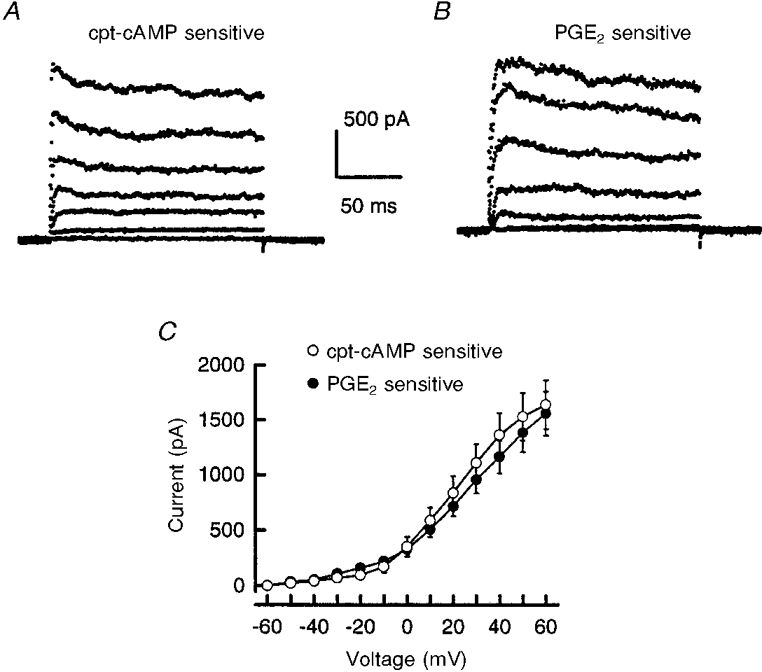
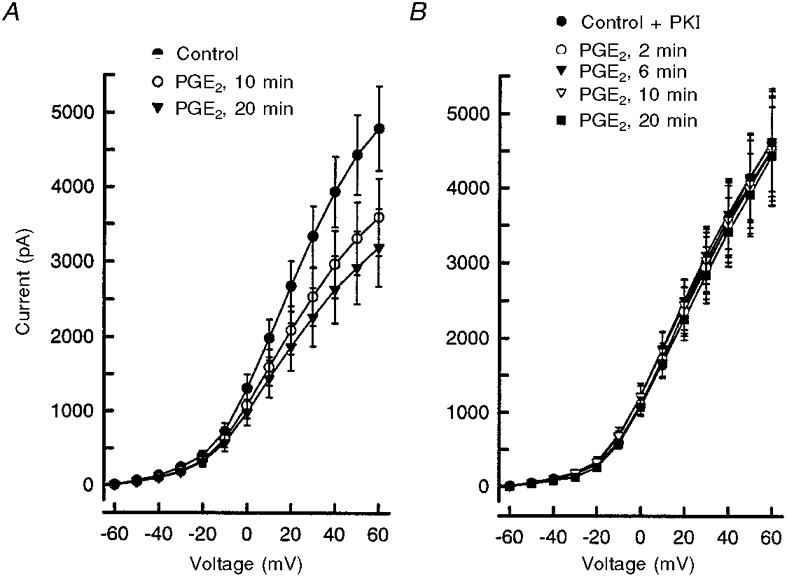
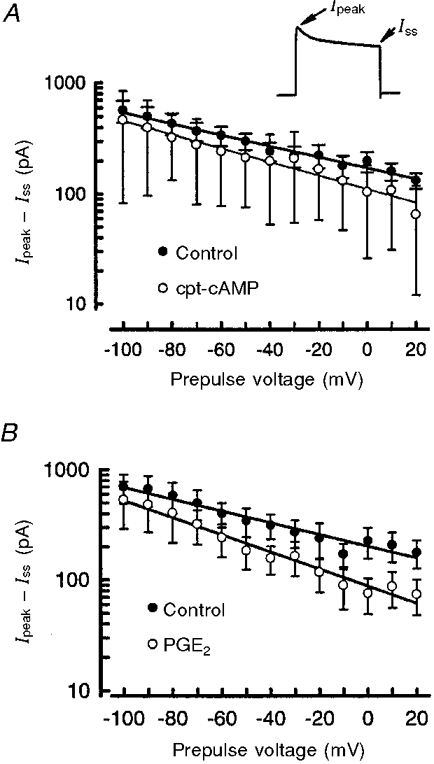
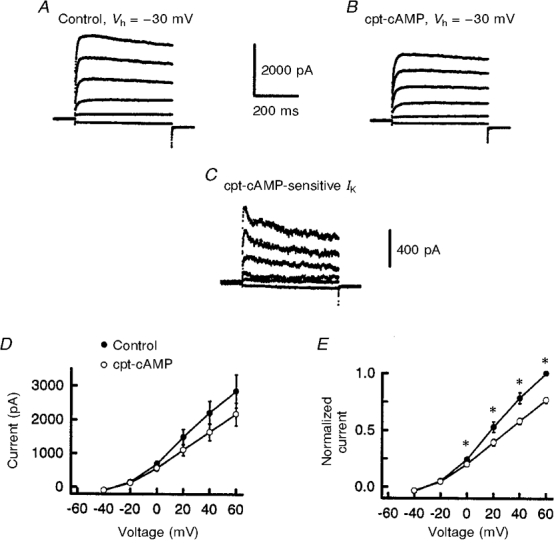
1. The role of the cyclic AMP (cAMP) transduction cascade in mediating the prostaglandin E2 (PGE2)-induced decrease in potassium current (IK) was investigated in isolated embryonic rat sensory neurones using the whole-cell patch-clamp recording technique. 2. Exposure to 100 microM chlorophenylthio-adenosine cyclic 3', 5'-monophosphate (cpt-cAMP) or 1 microM PGE2 caused a slow suppression of the whole-cell IK by 34 and 36 %, respectively (measured after 20 min), without a shift in the voltage dependence of activation for this current. Neither of these agents altered the shape of the voltage-dependent inactivation curve indicating that the suppression of IK did not result from alterations in the inactivation properties. 3. To determine whether the PGE2-mediated suppression of IK depended on activation of the cAMP pathway, cells were exposed to this prostanoid in the presence of the protein kinase A (PKA) inhibitor, PKI. The PGE2-induced suppression of IK was prevented by PKI. In the absence of PGE2, PKI had no significant effect on the magnitude of IK. 4. Results obtained from protocols using different conditioning prepulse voltages indicated that the extent of cpt-cAMP- and PGE2-mediated suppression of IK was independent of the prepulse voltage. The subtraction of control and treated currents revealed that the cpt-cAMP- and PGE2-sensitive currents exhibited little time-dependent inactivation. Taken together, these results suggest that the modulated currents may be delayed rectifier-like IK. 5. Exposure to the inhibitors of IK, tetraethylammonium (TEA) or 4-aminopyridine (4-AP), reduced the control current elicited by a voltage step to +60 mV by 40-50 %. In the presence of 10 mM TEA, treatment with cpt-cAMP did not result in any further inhibition of IK. In contrast, cpt-cAMP reduced IK by an additional 25-30 % in the presence of 1 mM 4-AP. This effect was independent of the conditioning prepulse voltage. 6. These results establish that PGE2 inhibits an outward IK in sensory neurones via activation of PKA and are consistent with the idea that the PGE2-mediated sensitization of sensory neurones results, in part, from an inhibition of delayed rectifier-like IK.


Figures

Figure 1
Figure 1. cpt-cAMP inhibits an outward potassium current in sensory neurones
Outward potassium currents are shown from a representative sensory neurone in the absence (left panels) and presence (right panels) of 100 μM cpt-cAMP. In the top panels, IK was activated by incremental 20 mV steps from a holding potential of -60 mV (see inset). The bottom panels represent the currents obtained from this neurone using the steady-state inactivation protocol (see inset) before (left) and 20 min after (right) application of cpt-cAMP. In the bottom panels, the beginnings of the traces are the last 300 ms of the conditioning prepulses.
Figure 2
Figure 2. cpt-cAMP reduces the activation of an outward potassium current
A, time-dependent suppression of IK after exposure to 100 μM cpt-cAMP. Currents were obtained in response to incremental 10 mV steps from a holding potential of -60 mV. B illustrates the currents shown in A after they were converted to conductance (G) values and fitted by the Boltzmann relation as described in the Methods section. In A and B, each point represents the mean ±s.e.m. from ten neurones. For those points appearing to lack error bars, the size of the bar is smaller than the symbol.
Figure 3
Figure 3. The cpt-cAMP- and PGE2-sensitive currents are similar
The currents inhibited by 100 μM cpt-cAMP (A) or 1 μM PGE2 (B) were obtained from representative neurones by subtracting the currents remaining after a 20 min exposure to these agents from those currents recorded under control conditions. The currents were obtained from incremental 20 mV steps from a holding potential of -60 mV. C shows the current-voltage curves for the cpt-cAMP- and PGE2-sensitive currents. Each data point represents the mean ±s.e.m. from ten neurones.
Figure 4
Figure 4. PKA mediates the PGE2-induced suppression of IK
A, treatment with 1 μM PGE2 elicited a time-dependent suppression of IK. Currents were elicited by incremental 10 mV steps from a holding potential of -60 mV. Each point represents the mean ±s.e.m. from ten neurones. B shows that 20 μM PKI abolished the inhibition of IK produced by PGE2. Data points represent means ±s.e.m. from seven neurones. For those data points appearing to lack error bars, the size of the bars is smaller than the symbol.
Figure 5
Figure 5. cpt-cAMP reduces IK but does not alter the shape of the steady-state inactivation profile
A, the peak IK obtained for the +60 mV step in the steady-state inactivation protocol was suppressed after 20 min treatment with 100 μM cpt-cAMP. The current values obtained after treatment with cpt-cAMP were significantly different from the controls at all voltage steps (paired t test). These values for IK were then used to determine the Boltzmann parameters that described the inactivation of this current and are shown in B. The lines drawn through the data points represent the Boltzmann fits to the control data and and data obtained after 20 min treatment with cpt-cAMP. In A and B, data points represent means ±s.e.m. from ten neurones.
Figure 6
Figure 6. Inhibition of IK by cpt-cAMP or PGE2 does not depend on the conditioning prepulse voltage
The current (Ipeak - Iss) was measured as the difference between the peak (Ipeak) and steady-state (Iss) currents for the voltage step to +60 mV using the steady-state inactivation protocol and is shown in the inset in A. A, the value of (Ipeak - Iss) was determined in the absence and presence of 100 μM cpt-cAMP (20 min treatment) as a function of the conditioning prepulse voltage. The points represent means ±s.e.m. from ten neurones. Note that the ordinate is a logarithmic scale. The lines drawn through the data points are linear regression lines wherein the correlation coefficients (r2) for the control and cpt-cAMP treatments were 0.98 and 0.99, respectively. B shows the value of (Ipeak - Iss) in the absence and presence of 1 μM PGE2 (20 min treatment) as a function of the conditioning prepulse voltage. The points represent means ±s.e.m. from ten neurones. The lines drawn through the data points are linear regression lines; the correlation coefficients (r2) for the control and PGE2 treatments were 0.94 and 0.97, respectively.
Figure 7
Figure 7. The cpt-cAMP-sensitive current obtained for a -100 mV conditioning prepulse
A illustrates representative currents obtained in response to 20 mV incremental steps from a prepulse voltage of -100 mV (Vh, holding potential). B shows these currents after a 20 min exposure to 100 μM cpt-cAMP. Subtraction of the respective traces in B from those in A yield the cpt-cAMP-sensitive currents for these different voltage steps (C). The calibration bar for time is the same for all three panels. D shows the effect of 100 μM cpt-cAMP on the current-voltage relation of IK for the prepulse voltage of -100 mV. In E, the currents have been normalized to their respective control values obtained for the step to +60 mV. In D and E, the data points represent means ±s.e.m. obtained from four neurones. For those points appearing to lack error bars, the size of the bar is smaller than the symbol. * P < 0.05 vs. cpt-cAMP.
Figure 8
Figure 8. The cpt-cAMP-sensitive current obtained for a -30 mV conditioning prepulse
A illustrates representative currents elicited from the -30 mV prepulse voltage. These currents were obtained from the same neurone shown in Fig. 7. B shows those currents resulting after a 20 min exposure to 100 μM cpt-cAMP. The cpt-cAMP-sensitive current (C) was then determined by subtracting IK remaining after a 20 min exposure to 100 μM cpt-cAMP (B) from its respective control IK(A). The calibration bar for time is the same for all three panels. D shows the effect of 100 μM cpt-cAMP on the current-voltage relation of IK for the prepulse voltage of -100 mV. In E, the currents have been normalized to their respective control values obtained for the step to +60 mV. In D and E, the data points represent means ±s.e.m. obtained from four neurones. For those points appearing to lack error bars, the size of the bar is smaller than the symbol. * P < 0.05 vs. cpt-cAMP.
Figure 9
Figure 9. The effects of TEA or 4-AP and cpt-cAMP on IK at the -30 mV conditioning prepulse voltage
These representative current traces illustrate the effects of either TEA or 4-AP and 100 μM cpt-cAMP in the presence of TEA or 4-AP. A shows currents obtained under control conditions from a prepulse of -30 mV (top). The middle panel represents the suppression of these currents by 10 mM TEA. The bottom panel shows the currents remaining after a 20 min exposure to cpt-cAMP in the presence of 10 mM TEA. B illustrates the effects of 4-AP, where the top panel shows the currents obtained under control conditions from a prepulse of -30 mV. The middle panel represents the suppression of these currents by 1 mM 4-AP. The bottom panel shows the currents remaining after a 20 min exposure to cpt-cAMP in the presence of 1 mM 4-AP. The calibration bar for time is the same for all six panels.
Figure 10
Figure 10. The effects of TEA or 4-AP on the inhibition of IK by cpt-cAMP
A and B summarize the inhibition produced by 10 mM TEA and 100 μM cpt-cAMP in the presence of TEA for the peak IK recorded for the -100 mV (A) and the -30 mV (B) prepulses. Values represent means ±s.e.m. from five neurones. C and D summarize the inhibition produced by 1 mM 4-AP and 100 μM cpt-cAMP in the presence of 4-AP for the peak IK recorded for the -100 mV (C) and the -30 mV (D) prepulses. Values represent means ±s.e.m. from six neurones. The cpt-cAMP-sensitive currents (voltage step to +60 mV) obtained under these different conditions are illustrated in the insets in each respective panel. The calibration bars apply to each trace. * Significant difference (ANOVA with repeated measures, P < 0.05) between the control and TEA or 4-AP treatments; † significant difference between the 4-AP and 4-AP + cpt-cAMP treatments.

References

    1. Akins PT, McCleskey EW. Characterization of potassium currents in adult rat sensory neurons and modulation by opioids and cyclic AMP. Neuroscience. 1993;56:759–769. 10.1016/0306-4522(93)90372-M. - DOI - PubMed
    1. Alloatti G, Serazzi L, Levi RC. Prostaglandin I2 (PGI2) enhances calcium current in guinea-pig ventricular heart cells. Journal of Molecular and Cellular Cardiology. 1991;23:851–860. 10.1016/0022-2828(91)90218-B. - DOI - PubMed
    1. Andreeva L, Rang HP. Effect of bradykinin and prostaglandins on the release of calcitonin gene-related peptide-like immunoreactivity from the rat spinal cord in vitro. British Journal of Pharmacology. 1993;108:185–190. - PMC - PubMed
    1. Ansanay H, Dumuis A, Sebben M, Bockaert J, Fagni L. cAMP-dependent, long-lasting inhibition of a K+ current in mammalian neurons. Proceedings of the National Academy of Sciences of the USA. 1995;92:6635–6639. - PMC - PubMed
    1. Baccaglini PI, Hogan PG. Some rat sensory neurons in culture express characteristics of differentiated pain sensory cells. Proceedings of the National Academy of Sciences of the USA. 1983;80:594–598. - PMC - PubMed

Publication types

MeSH terms

LinkOut - more resources