. 1999 Apr 1;516 ( Pt 1)(Pt 1):227-48.
doi: 10.1111/j.1469-7793.1999.227aa.x.

Quantal amplitude and quantal variance of strontium-induced asynchronous EPSCs in rat dentate granule neurons

Affiliations

Quantal amplitude and quantal variance of strontium-induced asynchronous EPSCs in rat dentate granule neurons

J M Bekkers et al. J Physiol. .

Abstract

1. Excitatory postsynaptic currents (EPSCs) were recorded from granule cells of the dentate gyrus in acute slices of 17- to 21-day-old rats (22-25 C) using tissue cuts and minimal extracellular stimulation to selectively activate a small number of synaptic contacts. 2. Adding millimolar Sr2+ to the external solution produced asynchronous EPSCs (aEPSCs) lasting for several hundred milliseconds after the stimulus. Minimally stimulated aEPSCs resembled miniature EPSCs (mEPSCs) recorded in the same cell but differed from them in ways expected from the greater range of dendritic filtering experienced by mEPSCs. aEPSCs had the same stimulus threshold as the synchronous EPSCs (sEPSCs) that followed the stimulus with a brief latency. aEPSCs following stimulation of distal inputs had a slower mean rise time than those following stimulation of proximal inputs. These results suggest that aEPSCs arose from the same synapses that generated sEPSCs. 3. Proximally elicited aEPSCs had a mean amplitude of 6.7 +/- 2.2 pA (+/- s.d., n = 23 cells) at -70 mV and an amplitude coefficient of variation of 0. 46 +/- 0.08. 4. The amplitude distributions of sEPSCs never exhibited distinct peaks. 5. Monte Carlo modelling of the shapes of aEPSC amplitude distributions indicated that our data were best explained by an intrasite model of quantal variance. 6. It is concluded that Sr2+-evoked aEPSCs are uniquantal events arising at synaptic terminals that were recently invaded by an action potential, and so provide direct information about the quantal amplitude and quantal variance at those terminals. The large quantal variance obscures quantization of the amplitudes of evoked sEPSCs at this class of excitatory synapse.


Figures

Figure 1
Figure 1. Stimulation, recording and analysis procedures
A, schematic diagram of the hippocampal slice preparation showing the relative locations of the electrodes and the tissue cut (not to scale). The stimulator was placed at the border of the cell body layer, 290-470 μm from the recording electrode and 40-160 μm from the cut, on the opposite side from the postsynaptic neuron. Region CA3 was also isolated by a cut (not shown) made just distal to the leftmost extent of the dentate cell body layer. B, plot of mean peak amplitude of the electrically evoked EPSC versus stimulus intensity for one cell, showing the existence of a stimulus plateau. Each point is the mean (±s.e.m.) of 4 separate measurements of the mean EPSC amplitude (each an average of 30 episodes) at each stimulus setting. The non-zero mean amplitude below the stimulus threshold is an artefact of the on-line peak detection algorithm used to measure the amplitudes. The arrow indicates the stimulus strength used in this experiment (8.5 μA). C, examples of aEPSCs that were detected by the sliding template algorithm but were rejected by eye because of overlapping events. The second aEPSC in the middle trace was accepted. D, examples of fits of the exponential product function given in Methods, in order to estimate the rise times and decay time constants of accepted aEPSCs. Horizontal lines indicate the intervals over which the baseline was adjusted (2 ms) and the peak was averaged (1 ms).
Figure 8
Figure 8. aEPSCs following stimulation of distal inputs have slower rise times than those following proximal stimulation
Aa, schematic diagram of the arrangement of the electrodes. In addition to the usual cut isolating a proximal input, a second cut was made, leaving a short (≈50 μm) tissue bridge between the end of the cut and the hippocampal fissure. The distal stimulator was placed close to the fissure. An additional cut, not shown, isolated CA3. Ab, superimposed averages of 200 aEPSCs recorded in the same cell following stimulation of either distal (open symbol) or proximal (closed symbol) afferents. B, plot of the 20-80 % rise time of aEPSCs, obtained from the averaged aEPSCs, versus the series resistance measured in that cell. In two cells (joined by vertical dashed lines) both distal and proximal data were obtained; all other points were from different cells. The horizontal interrupted lines and error bars represent the mean ±s.d. of data from the two kinds of stimulation: 1.04 ± 0.26 ms (distal) and 0.52 ± 0.10 ms (proximal). C, histograms of 20-80 % rise time for aEPSCs following distal and proximal stimulation (left panel) and for spontaneous EPSCs (right panel), all recorded in the same cell. The aEPSC histograms have been corrected by subtracting the histogram for spontaneous EPSCs, after scaling the latter to allow for the different rates of occurrence of the events. The mean rise times (±s.d.) and numbers of entries in the histograms, after correction, were 0.34 ± 0.10 ms and 507 (proximal aEPSCs), 0.99 ± 0.33 ms and 162 (distal aEPSCs), 0.72 ± 0.31 ms and 572 (spon EPSCs).
Figure 3
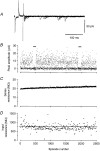
Figure 3. Stability of the stimulus and recording conditions
All data were obtained from the same granule cell in 4Sr-1Ca external solution. A, eight superimposed episodes recorded near the middle of the experiment, showing raw data before the stimulus artefact is subtracted. The test pulse was 2 mV and the stimulator was set at 6 μA. B, each point is the peak amplitude of the early (synchronous) EPSC in each episode, measured as described in the Methods to correctly include failures. The bars mark intervals during which the stimulus was turned off. C, each point is the series resistance, corrected to the value measured from the peak of the capacitance charging transient with the filter set at 10 kHz, for each episode. D, plot of the input resistance (RN) versus episode number, where each point is the mean of RN measured in 10 consecutive episodes. The horizontal line shows the mean input resistance of this cell, 760 MΩ.
Figure 4
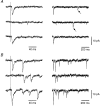
Figure 4. Extracellular strontium enhances the appearance of asynchronous EPSCs
A and B show episodes on two different time bases. In each case the stimulus artefact has been subtracted; the location of the stimulus is shown by the vertical dashed line. A, EPSCs recorded in 2Ca external solution. Spontaneous EPSCs are indicated by the arrows. Same cell as in Fig. 5A. B, EPSCs recorded in another neuron in 8Sr external solution. Same cell as in Fig. 2.
Figure 5
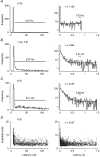
Figure 5. Latency frequency histograms vary with different concentrations of external calcium and strontium, and aEPSC amplitude is weakly dependent on latency
A-C, latency frequency histograms are shown for EPSCs recorded in three different external solutions (2Ca, 4Sr-1Ca and 8Sr). Each panel shows the same data with two different abscissae. The right-hand panels have logarithmic ordinates. The horizontal bar in each panel indicates the 100 ms window over which the rate of occurrence of aEPSCs was measured. The window started at tc (left panels) or at 750 ms after the stimulus (right panels). The rates for these windows are shown above the bars. The superimposed smooth curves are least-squares fits of a constant (A) or a sum of a single exponential and a constant (B and C), starting at a latency of 20 ms. The results of the fits were: A, constant = 0.58 Hz; B, decay = 61 ms, constant = 0.41 Hz; C, decay = 117 ms, constant = 0.43 Hz. Each panel was from a different cell. n is the number of entries in the histograms. The histogram in 2Ca solution is truncated because data were only sampled to 880 ms after the stimulus. D, the peak amplitude of each EPSC was plotted versus its latency from the stimulus (same cell as in C). The superimposed straight lines are unconstrained fits to the points from tc (11.0 ms in this cell) to 0.5 s (left) or 1.5 s (right). They have slopes of -1.96 × 10⁻³ and -0.41 × 10⁻³ pA ms−1, respectively.
Figure 2
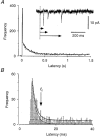
Figure 2. Definition of asynchronous EPSCs
Asynchronous EPSCs were identified by means of a latency frequency histogram compiled for each cell. The latency was measured from the time of the stimulus (vertical dashed line, inset) to the peak of each detected EPSC. A, frequency histogram of latencies measured for one cell in external solution containing 8 mM Sr2+ (8Sr), compiled with a bin width of 10 ms. The superimposed smooth curve is a least-squares fit of a single exponential plus a constant offset; the fit started at 20 ms latency. The fitted decay time constant is 135 ms and the added constant, which corresponds to the background rate of mEPSCs, is 1.4 Hz. The histogram contains 3754 entries. B, the same data shown with an expanded abscissa and a 0.5 ms bin width. The superimposed continuous curve is a least-squares fit of a sum of two exponentials plus a constant offset. The fit started at the peak of the histogram. The three components of the fit are shown separately as dashed lines superimposed on the histogram. The latency at which the amplitudes of the two fitted exponentials was equal was called the cutoff time, tc, here 11.7 ms. Events with latencies < =tc were defined as synchronous, those with latencies > tc as asynchronous.
Figure 10
Figure 10. The rate of aEPSCs is reduced by reductions in transmitter release probability
Each point was obtained from a single cell in which EPSCs were recorded before and after changing the external solution from 4Sr-1Ca to 2Sr-0.5Ca (○) or from 2Sr-0.5Ca to 1Sr-0.25Ca (□). The mean evoked EPSC amplitude in each solution was measured from the average of 500 consecutive episodes (including failures). The aEPSC rate was measured for the 100 ms window starting at tc for each cell, and was corrected for the measured rate of spontaneous EPSCs in the cell. Error bars were calculated using either the ensemble s.e.m. (for the EPSC amplitudes), or the rate multiplied by √n/n (for the aEPSC rates), where n is the number of observations (n = 216-520). The diagonal line is the relation expected if aEPSC rate is proportional to transmitter release probability. The experiment shown in Fig. 9 is the second point from the right. One cell, lying on the diagonal near 1, paradoxically showed little effect of the reduction in Sr2+ and Ca2+ concentrations.
Figure 9
Figure 9. The mean amplitude of aEPSCs is unaltered by changes in transmitter release probability
A, each point is the peak amplitude of the synchronous EPSC in each episode, plotted against episode number. The bar marks the interval during which the stimulus was turned off while the bath solution was changed. B, amplitude histograms for the same cell as in A. Left, histograms of EPSCs obtained in 4Sr-1Ca solution. Right, histograms of EPSCs obtained in 2Sr-0.5Ca solution. Also shown in B are the noise histograms, their vertical ranges arbitrarily adjusted (thin lines; s.d. = 0.77 pA). The mean amplitude, excluding failures, of sEPSCs is significantly reduced (from 12.4 ± 6.8 to 9.3 ± 5.0 pA; ±s.d.) but that of aEPSCs is not significantly affected (from 6.8 ± 3.2 to 6.5 ± 3.0 pA) by reducing release probability. This suggests that aEPSCs result from the release of single vesicles of neurotransmitter, their amplitudes being independent of the probability of synchronously evoked release.
Figure 6
Figure 6. Synchronous and asynchronous EPSCs have the same stimulus threshold
A, peak amplitude of the mean sEPSC measured at different stimulus settings in the same cell. Each point was obtained by averaging 60 episodes. The error bars represent ± ensemble s.e.m. The horizontal line represents the mean suprathreshold response, 3.6 pA. B, aEPSC rate for a 100 ms window starting at tc, obtained from the same data set as in A (60 episodes at each stimulus setting). The error bars were obtained by multiplying the average rate by √n/n, where n is the number of events in the window at each stimulus setting (n = 3-72). The horizontal continuous line represents the mean suprathreshold aEPSC rate, 10.8 Hz. The horizontal dashed line is the rate of occurrence of spontaneous EPSCs measured in this cell during a 4 min period without stimulation (0.64 Hz). C, examples of individual episodes recorded at stimulus settings of 4 μA (left) or 6 μA (right). This experiment used 8Sr external solution.
Figure 7
Figure 7. Proximally evoked aEPSCs resemble mEPSCs measured in the same cell, but are less affected by dendritic filtering
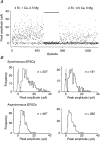
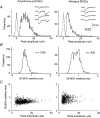
Properties of aEPSCs (left) and mEPSCs (right, in 0.5 μM TTX) recorded in the same neuron. Examples of each kind of EPSC are given in the insets. A, histograms of peak amplitude. The amplitude distribution for aEPSCs is less heavily skewed to small amplitudes than that for mEPSCs, and has a larger mean (11.3 ± 5.0 pA cf. 7.2 ± 3.8 pA; ±s.d.). The noise histogram for the cell is shown (thin line; s.d. = 0.89 pA); its vertical scale has been arbitrarily adjusted. B, histograms of 20-80 % rise time, measured from fits to each EPSC of the exponential product function given in Methods. The rise time distribution is narrower for aEPSCs than mEPSCs, and has a smaller mean (0.69 ± 0.12 ms cf. 0.87 ± 0.19 ms; ±s.d.). C, scatter plots of 20-80 % rise time versus peak amplitude measured from each EPSC. Variability in rise time obscures an expected negative correlation between rise time and amplitude for mEPSCs, if mEPSCs experience a greater range of dendritic filtering because of their more dispersed sites of origin. This experiment used 4Sr-1Ca external solution.
Figure 11
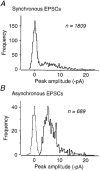
Figure 11. Amplitude histograms for synchronous and asynchronous EPSCs recorded in the same cell are broadly skewed and do not show quantization
Examples of episodes recorded in this cell are shown at the top right (same cell as in Fig. 3). The arrow indicates the stimulus time, the dashed vertical line the cutoff time between synchronous and asynchonous EPSCs (10.7 ms latency). This was a proximal input in 4Sr-1Ca external solution. Left panels, amplitude histograms for both kinds of EPSC. The sEPSC distribution has a mean of 4.1 ± 5.8 pA (±s.d.) including failures, or 10.3 ± 4.3 pA excluding failures. The data in A are shown on two different vertical scales. The noise histogram is shown in B (thin line; s.d. = 0.83 pA); its vertical scale has been arbitrarily adjusted. Right panels, 20-80 % rise time histograms for the same EPSCs; their mean ±s.d. are 0.68 ± 0.44 ms (synchronous) and 0.63 ± 0.33 ms (asynchronous). Their similarity suggests that the synchronous EPSCs are little distorted by latency jitter in the release of synaptic vesicles. The aEPSC amplitude distribution has a mean of 8.0 ± 3.2 pA and a CV of 0.39 (noise subtracted).
Figure 12
Figure 12. Another example of amplitude histograms for synchronous and asynchronous EPSCs, recorded for a distal input
Amplitude histograms for sEPSCs and failures (A) and for aEPSCs (B) recorded in the same cell. The noise histogram is shown (thin line, B; s.d. = 0.72 pA); its vertical scale has been arbitrarily adjusted. This was a distal input recorded in 4 Sr-1Ca. The sEPSC distribution has a mean of 2.6 ± 4.1 pA (±s.d.) including failures, or 8.1 ± 3.6 pA excluding failures. The aEPSC amplitude distribution has a mean of 6.7 ± 3.0 pA (±s.d.) and a CV of 0.43 (noise subtracted).
Figure 13
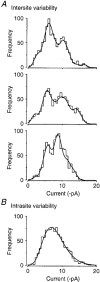
Figure 13
An intrasite model of aEPSC amplitude variability provides a better description of the observed aEPSC amplitude distributions than an intersite model A, the intersite model of aEPSC variability was used to simulate aEPSC amplitude distributions. Three typical examples are shown. Continuous lines show the theoretical distribution which represents 50 randomly selected synaptic terminals. The amplitude histograms were sampled from the theoretical distributions. Clear peaks and inflections are evident in both the theoretical and sampled distributions due to finite sampling. None of the sampled distributions could be fitted by a gamma function. (The peaks and inflections were even more obvious when the number of terminals was reduced to 10, perhaps a more plausible number; not illustrated.) In contrast, most of the experimental aEPSC amplitude distributions could be well fitted by a gamma function. B, simulated aEPSC amplitude histograms were also generated using the intrasite variability model. The theoretical distribution is shown as a continuous line, and was the same for every simulation. Amplitude histograms were sampled from this distribution; a typical result is shown. The sampled distribution is relatively free of peaks and inflections. As expected, all of the sampled distributions could be fitted by a gamma function.

References

    1. Abdul-Ghani MA, Valiante TA, Pennefather PS. Sr2+ and quantal events at excitatory synapses between mouse hippocampal neurons in culture. The Journal of Physiology. 1996;495:113–125. - PMC - PubMed
    1. Amaral DG, Ishizuka N, Claiborne B. Neurons, numbers and the hippocampal network. In: Storm-Mathison J, Zimmer J, Ottersen OP, editors. Progress in Brain Research. New York: Elsevier; 1990. pp. 1–11. - PubMed
    1. Augustine GJ, Eckert R. Divalent cations differentially support transmitter release at the squid giant synapse. The Journal of Physiology. 1984;346:257–271. - PMC - PubMed
    1. Barrett EF, Stevens CF. The kinetics of transmitter release at the frog neuromuscular junction. The Journal of Physiology. 1972;227:691–708. - PMC - PubMed
    1. Bekkers JM. Quantal analysis of synaptic transmission in the central nervous system. Current Opinion in Neurobiology. 1994;4:360–365. 10.1016/0959-4388(94)90097-3. - DOI - PubMed

Publication types

LinkOut - more resources