. 1999 Feb;10(2):239-48.
doi: 10.1016/s1074-7613(00)80024-2.

Antigen-stimulated dissociation of BCR mIg from Ig-alpha/Ig-beta: implications for receptor desensitization

Affiliations

Antigen-stimulated dissociation of BCR mIg from Ig-alpha/Ig-beta: implications for receptor desensitization

B J Vilen et al. Immunity. 1999 Feb.

Abstract

B cell antigen receptor (BCR) ligation leads to receptor desensitization wherein BCR remain competent to bind antigen and yet fail to transduce signals. Desensitized BCR exhibit a defect at the most proximal level of signal transduction, consistent with failed transmission of signals through the receptor complex. We report that antigen stimulation leads to dissociation or destabilization of the BCR reflected by inability to coimmunoprecipitate Ig-alpha/Ig-beta with mIg. This destabilization is temporally correlated with desensitization and occurs in BCR containing mIgM and mIgD. Induction of BCR destabilization requires tyrosine kinase activation but is not induced by phosphatase inhibitors. BCR destabilization occurs at the cell surface and "dissociated" Ig-alpha/Ig-beta complexes remain responsive to anti-Ig-beta stimulation, suggesting that mIg-transducer uncoupling may mediate receptor desensitization.


Figures

Figure 1
Figure 1. Comparative Analysis of mIg-Ig-α/Ig-β Association in K46µ Cells
Cells were either unstimulated, stimulated for 1 hr with NP7BSA (500 ng/5 × 106 cells/ml), or stimulated for 1 hr with biotinylated b-7-6 (10 µg/5 × 106/ml). (Panel 1) Lanes 1 and 2 represent IgM and Ig-α immunoblots of anti-µ immunoprecipitates. (Panel 2) Lanes 3 and 4 represent IgM, Ig-β, and Ig-α immunoblots of anti-Ig-β immunoprecipitates. (Panel 3) Lanes 5 and 6 represent IgM and Ig-α immunoblots of Ig-α immunoprecipitates. (Panel 4) Lanes 7 and 8 represent IgM and Ig-α immunoblots of streptavidin immunoprecipitates. Biotinylated b-7–6 was prebound to unstimulated cells (10 µg/5 × 106 cells/ml) for 2 min at 4°C prior to lysis.
Figure 2
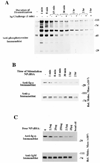
Figure 2. Time Course and Dose Response of BCR Desensitization and Destabilization
(A) Anti-phosphotyrosine immunoblot of K46µ cells that were desensitized with a low dose of NP7BSA (25 ng/5 × 106 cells/ml) for 15 min (lane 5), 30 min (lane 7), 1 hr (lane 9), 2 hr (lane 11), and 3 hr (lane 12), and then challenged with high-dose NP7BSA (2 µg/5 × 106 cells/0.1 ml) for 1 min. Alternatively, control cells were stimulated with the desensitizing dose of NP7BSA (25 ng/5 × 106 cells/ml) for 1 min (lane 2), 8 min (lane 3), 15 min (lane 5), 30 min (lane 6), 1 hr (lane 8), and 2 hr (lane 10) to establish the baseline tyrosine phosphorylation prior to challenge. (B) Anti-Ig-α and anti-µ immunoblots of anti-µ immunoprecipitates from unstimulated K46µ cells (lane 1), cells stimulated for 1 min (lane 2), 8 min (lane 3), 15 min (lane 4), 30 min (lane 5), 1 hr (lane 6), and 2 hr (lane 7) with 500 ng/5 × 106 cells/ml NP7BSA. (C) Anti-Ig-α and anti-µ immunoblots of anti-µ immunoprecipitates from unstimulated K46µ cells (lane 1), cells stimulated for 1 hr with 2.5 ng/5 × 106/ml (lane 2), 25 ng/5 × 106/ml (lane 3), 250 ng/5 × 106/ml (lane 4), 2.5 µg/5 × 106/ml (lane 5), 25 µg/5 × 106/ml (lane 6), or lysates immunoprecipitated with blocked agarose beads (lane 7).
Figure 3
Figure 3. mIg-Ig-α/Ig-β Destabilization Occurs in Both IgM- and IgD-Containing Receptors
Anti-Ig-α, anti-µ, or anti-δ immunoblots of anti-µ or anti-δ immuno-precipitates. IgM and IgD receptors from 3–83µδ transgenic B cells were immunoprecipitated from unstimulated cells (lane 1 and lane 4), cells stimulated for 1 hr with 2 µg/3–83ag150Dex/5 × 106/ml (lane 2 and lane 5), or cells stimulated for 2 hr with 2 µg/3–83ag150Dex/ 5 × 10⁶/ml (lanes 3 and 6).
Figure 4
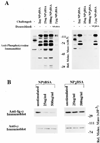
Figure 4. Low Valency Antigens Do Not Induce Receptor Desensitization or BCR Destabilization
(A) Anti-phosphotyrosine immunoblot of K46µ cells desensitized with NP7BSA (left panel, lane 5) or NP2BSA (right, lane 5). Unstimulated cells (lane 1 of each panel), cells stimulated with challenge dose of NP7BSA (2 µg/5 × 106 cells/0.1 ml; lane 2 of each panel), cells stimulated with desensitizing dose (25 ng/5 × 106 cells/ml; lane 3 left panel: NP7BSA, lane 3 right panel: NP2BSA), cells stimulated with 500 ng/5 × 106 cells/ml; lane 4 left panel: NP7BSA, lane 4 right panel: NP2BSA), and cells desensitized with 25 ng/5 × 106 cells/ ml NP7BSA for 2 hr and then challenged with 2 µg/5 × 106 cells/0.1 ml NP7BSA (lane 5 of each panel). (B) Anti Ig-α and anti-µ immunoblots of IgM immunoprecipitates from unstimulated cells (lane 1 of each panel) and cells stimulated with two doses of either NP7BSA or NP2BSA; 25 ng/5 × 106 cells/ml (lane 2 of each panel), 500 ng/5 × 106 cells/ml (lane 3 of each panel).
Figure 5
Figure 5. BCR Destabilization Requires Tyrosine Kinase Activation but Is Not Induced by Phosphate Inhibitors
(A) Inhibition of Protein Tyrosine Kinases Prevents BCR Destabilization. (Upper panels) Anti-phosphotyrosine immunoblots of anti-Lyn (left panel) or anti-Syk (right panel) immunoprecipitates. K46µ cells were either untreated (lanes 1 and 2 of each panel) or herbimycin treated (lane 3 of each panel) and then stimulated with NP7BSA (500 memng/5 × 106 cells/ml) to assess BCR sensitivity. The membrane was then stripped and reprobed with anti-Lyn and anti-Syk, respectively, immuto assess protein levels. (Lower panels) Anti-Ig-α and anti-µ immunoblots of IgM immuno-precipitates from unstimulated cells (lane 1), cells stimulated with antigen for 2 hr (lane 2), cells that were herbimycin treated but unstimulated (lane 3), and cells that were herbimycin treated and antigen stimulated for 2 hr (lane 4). The levels of µ-heavy chain from each immunoprecipitate are shown in the anti-µ immunoblot. (B) Dissociation of the mIg from Ig-α/Ig-β requires a specific signal through the BCR. (Upper left panel) Anti-phosphotyrosine immunoblot of anti-Ig-α immunoprecipitation. Unstimulated cells (lane 1), cells treated with NP7BSA (2 µg/5 × 106 cells/0.1 ml) (lane 2), and cells treated with pervanadate (lane 3). (Upper right panel) The membrane was stripped then sequentially blotted for Ig-α and Ig-β. (Lower panel) Anti-Ig-α (left panel) and anti-µ (right panel) immunoblots of IgM immunoprecipitates. Unstimulated cells (lane 1), NP7BSA (2 µg/5 × 106 cells/0.1 ml) stimulated cells (lane 2), and pervanadate treated cells (lane 3).
Figure 6
Figure 6. BCR Destabilization Occurs on the Cell Surface
(A) Only the membrane pool of BCRs are destabilized following antigen ligation. (upper) schematic representation of the experimental design. (lower left) streptavidin immunoblot of an anti-µ immunoprecipitate from biotinylated cells. Unstimulated cells (lane 1), 37°C stimulated cells (500 ng/5 × 106/ml; lane 2), and RT/4°C stimulated cells (500 ng/5 × 106/ml; 15 min at RT then 45 min at 4°C; lane 3). (lower right) anti-µ or anti-Ig-α immunoblot of biotin-depleted receptors. Unstimulated cells (lane 1), 37°C stimulated cells (500 ng/5 × 106/ml; lane 2), and RT/4°C stimulated cells (500 ng/5 × 106/ml; 15 min at RT then 45 min at 4°C; lane 3). (B) Desensitized cells maintain surface Ig-β and antigen binding BCR. Surface staining with anti-Ig-β (left panel) or NP7BSA (right panel) of antigen-desensitized cells. The solid black line represents staining of naive cells treated with phycoerythrin-streptavidin (left panel) or biotinylated BSA (right panel). The heavy line of each panel represents naive cells stained 10 min on ice with either Ig-β (left panel) or the challenge dose of NP7BSA (2 µg/5 × 106 cells/0.1 ml; right panel). The dotted line represents Ig-β staining (left panel) or NP7BSA staining (2 µg/5 × 106 cells/0.1 ml; right panel) of cells desensitized for 2 hr with NP7BSA (25 ng/5 × 106 cells/ml). Median fluorescence intensity (MFI) of each population is indicated in the upper right of each panel.
Figure 7
Figure 7. Desensitized Cells Remain Competent to Signal through Ig-β
(Upper panel) Antiphosphotyrosine immunoblot of naive K46µ cells (lanes 1–4) or K46µ cells desensitized for 2 hr with NP7BSA (25 ng/5 × 106 cells/ml; lanes 5–7) that were challenged with either anti-λ (2 µg/5 × 106 cells/0.1 ml; lanes 2 and 5), anti-Ig-β (1 µg/5 × 106 excells/ 0.1 ml; lanes 3 and 6), or high dose of NP7BSA (2 µg/5 × 106 cells/0.1 ml; lanes 4 and 7). (Lower panel) Membrane was stripped and reprobed with anti-Ig-α to reveal loading differences.

Similar articles

Cited by

References

    1. Albrecht DL, Noelle RJ. Membrane Ig-cytoskeletal interactions. I. Flow cytofluorometric and biochemical analysis of membrane IgM-cytoskeletal interactions. J. Immunol. 1988;141:3915–3922. - PubMed
    1. Braun J, Hochman PS, Unanue ER. Ligand-induced association of surface immunoglobulin with the detergent-insoluble cytoskeletal matrix of the B lymphocyte. J. Immunol. 1982;128:1198–1204. - PubMed
    1. Brunswick M, June CH, Mond JJ. B lymphocyte immunoglobulin receptor desensitization is downstream of tyrosine kinase activation. Cell. Immunol. 1994;156:240–244. - PubMed
    1. Cambier JC. New nomenclature for the Reth motif (or ARH1/TAM/ARAM/YXXL) Immunol. Today. 1995;16:110. - PubMed
    1. Cambier J, Chen ZZ, Pasternak J, Ransom J, Sandoval V, Pickles H. Ligand-induced desensitization of B-cell membrane immunoglobulin-mediated Ca2+ mobilization and protein kinase C translocation. Proc. Natl. Acad. Sci. USA. 1988;85:6493–6497. - PMC - PubMed

Publication types