. 1999 Apr;73(4):2983-93.
doi: 10.1128/JVI.73.4.2983-2993.1999.

Silencing of the Epstein-Barr virus latent membrane protein 1 gene by the Max-Mad1-mSin3A modulator of chromatin structure

Affiliations

Silencing of the Epstein-Barr virus latent membrane protein 1 gene by the Max-Mad1-mSin3A modulator of chromatin structure

A Sjöblom-Hallén et al. J Virol. 1999 Apr.

Abstract

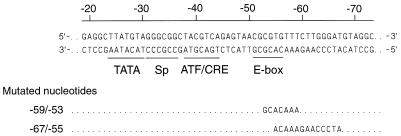
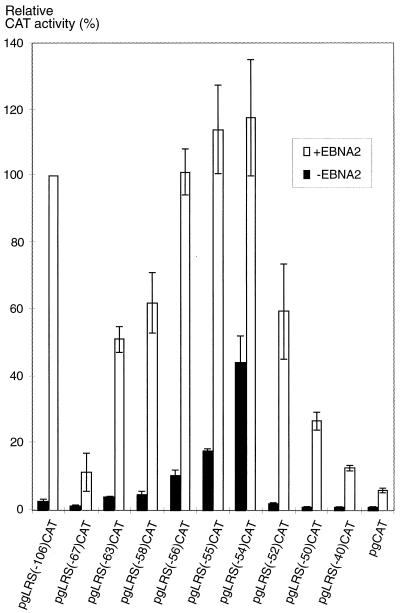
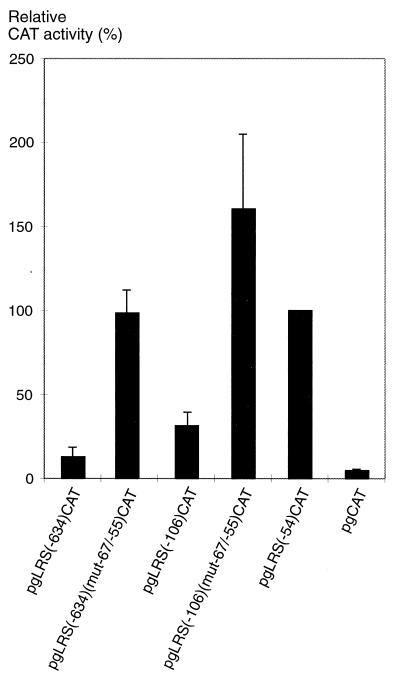
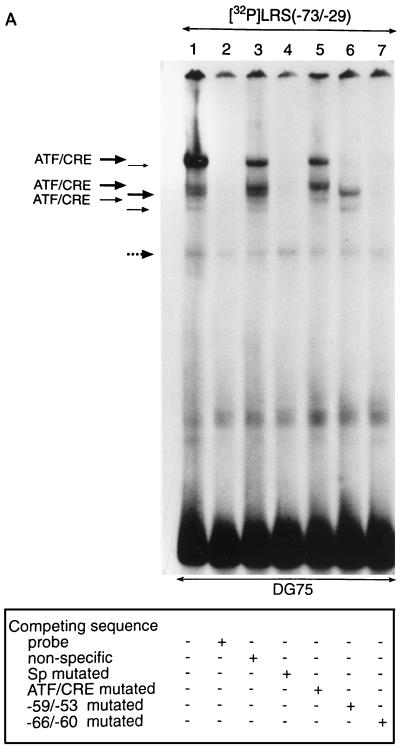
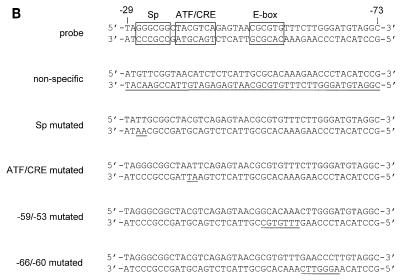
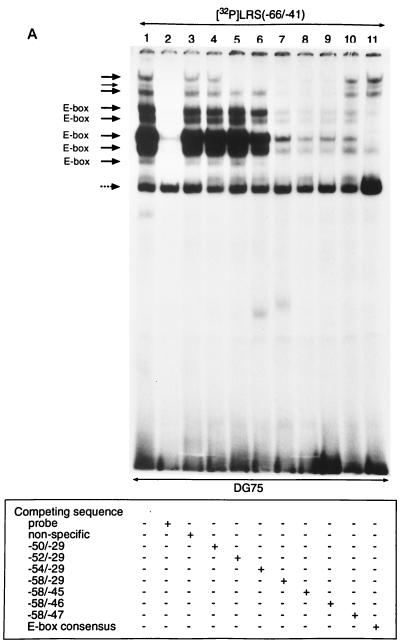
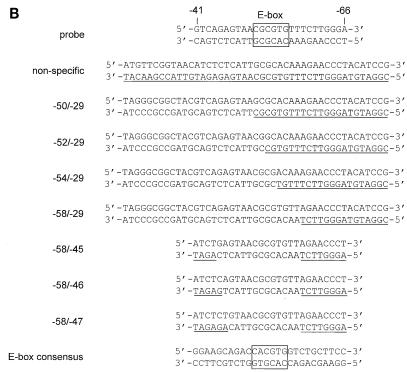
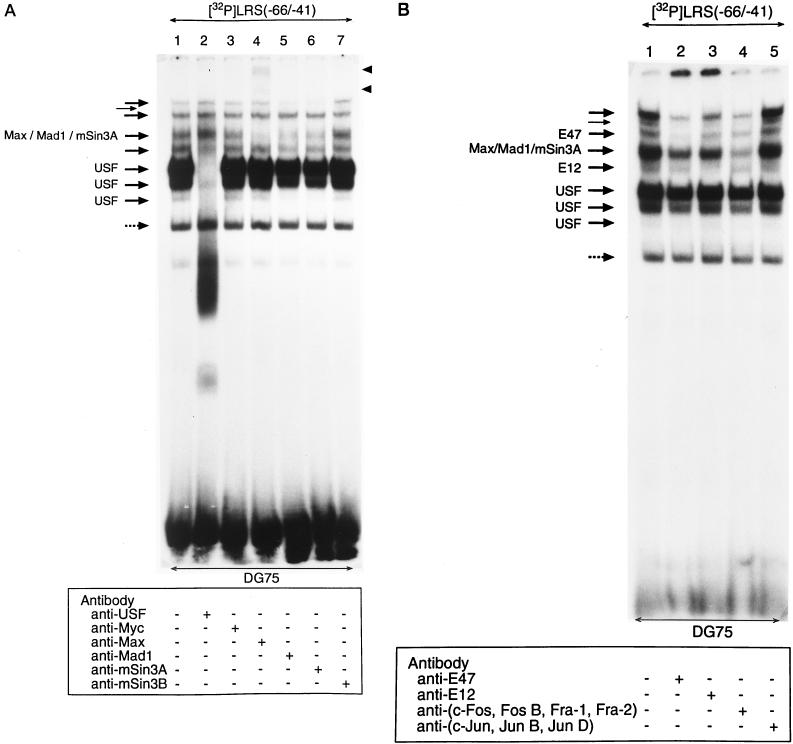
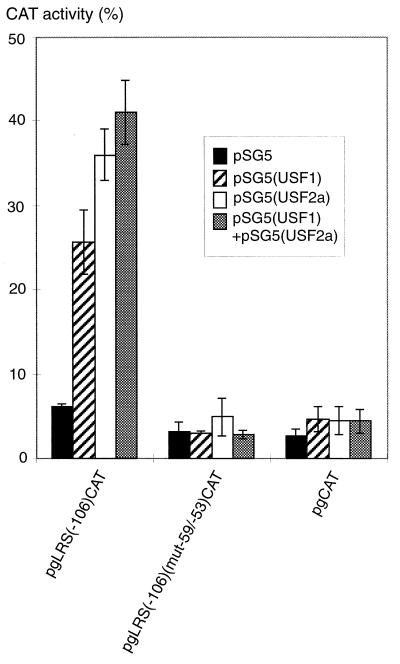
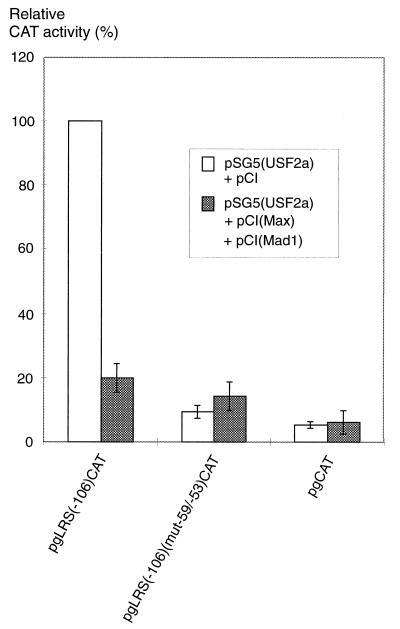
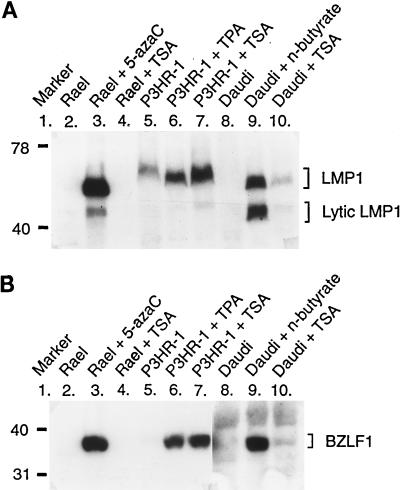
The tumor-associated latent membrane protein 1 (LMP1) gene in the Epstein-Barr virus (EBV) genome is activated by EBV-encoded proteins and cellular factors that are part of general signal transduction pathways. As previously demonstrated, the proximal region of the LMP1 promoter regulatory sequence (LRS) contains a negative cis element with a major role in EBNA2-mediated regulation of LMP1 gene expression in B cells. Here, we show that this silencing activity overlaps with a transcriptional enhancer in an LRS sequence that contains an E-box-homologous motif. Mutation of the putative repressor binding site relieved the repression both in a promoter-proximal context and in a complete LRS context, indicating a functional role of the repressor. Gel retardation assays showed that members of the basic helix-loop-helix transcription factor family, including Max, Mad1, USF, E12, and E47, and the corepressor mSin3A bound to the E-box-containing sequence. The enhancer activity correlated with the binding of USF. Moreover, the activity of the LMP1 promoter in reporter constructs was upregulated by overexpression of USF1 and USF2a, and the transactivation was inhibited by the concurrent expression of Max and Mad1. This suggests that Max-Mad1-mediated anchorage of a multiprotein complex including mSin3A and histone deacetylases to the E-box site constitutes the basis for the repression. Removal of acetyl moieties from histones H3 and H4 should result in a chromatin structure that is inaccessible to transcription factors. Accordingly, inhibition of deacetylase activity with trichostatin A induced expression of the endogenous LMP1 gene in EBV-transformed cells.


Figures

FIG. 1
FIG. 1
The promoter-proximal part of the LRS. The double-stranded DNA sequence is of B95-8 EBV DNA origin. The scale refers to the distance in base pairs from the transcription initiation site (+1). Transcription factor binding sites identified in a database search and possibly involved in the regulation of the LMP1 promoter are underlined. Two sets of mutations introduced in the LRS for a functional analysis of the E-box region are indicated below the sequence.
FIG. 2
FIG. 2
Deletion mutation analysis of transcriptional cis elements in the promoter-proximal part of the LRS. Reporter plasmids carrying LRS inserts with 5′ deletions covering the −106 to −40 region (as detailed in Materials and Methods) were transfected together with the EBNA2 expression vector pEΔA6 (+EBNA2) or with an equivalent amount of the empty vector pSV2gpt (−EBNA2) into the EBV-negative B-cell line DG75. The CAT activity is given as relative chloramphenicol acetylation expressed as a percentage of the activity obtained with pgLRS(−106)CAT in the presence of EBNA2. The 100% value corresponded to acetylation of 38% of the substrate in the assay. The values are the means from four independent transfections. Error bars indicate standard errors of the means.
FIG. 3
FIG. 3
A repressor element is present in the −67 to −55 region of the LRS. Mutations in the putative repressor site were introduced in the pgLRS(−106)CAT and pgLRS(−634)CAT plasmids, as indicated in Fig. 1 and in Materials and Methods. The reporter plasmids were transfected into the EBV-negative B-cell line DG75. The CAT activity is given as relative chloramphenicol acetylation expressed as a percentage of the activity obtained with the pgLRS(−54)CAT plasmid. The 100% value corresponded to acetylation of 19% of the substrate in the assay. The values are the means from three independent transfections with double samples. Error bars indicate standard errors of the means.
FIG. 4
FIG. 4
Transcription factors in B-lymphoid cells bind to the E-box-containing −59/−53 region of the LRS. (A) A 32P-labelled double-stranded oligonucleotide corresponding to the −73 to −29 LRS region was incubated with nuclear extracts from DG75 cells and subjected to EMSA. Lane 1 shows the binding pattern obtained with the nuclear extract. Competition reactions was carried out as indicated below the autoradiogram and described in Materials and Methods. Six complexes (indicated by solid arrows) are considered specific. Three complexes were shown to interact with the ATF/CRE site in the LRS and are designated ATF/CRE (bands remaining after competition with an LRS fragment that contained a mutated ATF/CRE site). The other three complexes interacted with the −59/−53 sequence in the LRS (bands remaining after competition with an LRS fragment that contained a mutated −59/−53 sequence). One unspecific band that was not abolished by competition with unlabelled probe is indicated by a dotted arrow. (B) Nucleotide sequences of the double-stranded oligonucleotides used in the competition experiment. Binding sites conforming to Sp, ATF/CRE, and E-box consensus sequences are boxed, and mutated nucleotides are underlined.
FIG. 4
FIG. 4
Transcription factors in B-lymphoid cells bind to the E-box-containing −59/−53 region of the LRS. (A) A 32P-labelled double-stranded oligonucleotide corresponding to the −73 to −29 LRS region was incubated with nuclear extracts from DG75 cells and subjected to EMSA. Lane 1 shows the binding pattern obtained with the nuclear extract. Competition reactions was carried out as indicated below the autoradiogram and described in Materials and Methods. Six complexes (indicated by solid arrows) are considered specific. Three complexes were shown to interact with the ATF/CRE site in the LRS and are designated ATF/CRE (bands remaining after competition with an LRS fragment that contained a mutated ATF/CRE site). The other three complexes interacted with the −59/−53 sequence in the LRS (bands remaining after competition with an LRS fragment that contained a mutated −59/−53 sequence). One unspecific band that was not abolished by competition with unlabelled probe is indicated by a dotted arrow. (B) Nucleotide sequences of the double-stranded oligonucleotides used in the competition experiment. Binding sites conforming to Sp, ATF/CRE, and E-box consensus sequences are boxed, and mutated nucleotides are underlined.
FIG. 5
FIG. 5
Mapping of transcription factor binding sites in the E-box containing region of the LRS. (A) A 32P-labelled double-stranded oligonucleotide corresponding to the −66 to −41 LRS region was incubated with nuclear extracts from DG75 cells and subjected to EMSA. Lane 1 shows the binding pattern obtained with the nuclear extract. Competition reactions was performed as indicated below the autoradiogram and described in Materials and Methods. Eight complexes (designated by solid arrows) were considered specific. The two slowest-migrating complexes required the LRS nucleotides between positions −52 and −46 (bands competed by LRS oligonucleotides containing either the −52/−29 part or the −58/−46 part of the LRS). The remaining six specific complexes interacted with the LRS nucleotides between positions −58 and −46 (bands competed by an LRS oligonucleotide consisting of the −58/−46 region). Five of the specific complexes were competed by an E-box consensus oligonucleotide (designated E-box). One nonspecific band that was not abolished by competition is indicated by a dotted arrow. (B) Nucleotide sequences of the double-stranded oligonucleotides used in the competition experiment. The potential E-box binding site in the LRS and the E-box class B consensus sequence are boxed, while mutated nucleotides are underlined.
FIG. 5
FIG. 5
Mapping of transcription factor binding sites in the E-box containing region of the LRS. (A) A 32P-labelled double-stranded oligonucleotide corresponding to the −66 to −41 LRS region was incubated with nuclear extracts from DG75 cells and subjected to EMSA. Lane 1 shows the binding pattern obtained with the nuclear extract. Competition reactions was performed as indicated below the autoradiogram and described in Materials and Methods. Eight complexes (designated by solid arrows) were considered specific. The two slowest-migrating complexes required the LRS nucleotides between positions −52 and −46 (bands competed by LRS oligonucleotides containing either the −52/−29 part or the −58/−46 part of the LRS). The remaining six specific complexes interacted with the LRS nucleotides between positions −58 and −46 (bands competed by an LRS oligonucleotide consisting of the −58/−46 region). Five of the specific complexes were competed by an E-box consensus oligonucleotide (designated E-box). One nonspecific band that was not abolished by competition is indicated by a dotted arrow. (B) Nucleotide sequences of the double-stranded oligonucleotides used in the competition experiment. The potential E-box binding site in the LRS and the E-box class B consensus sequence are boxed, while mutated nucleotides are underlined.
FIG. 6
FIG. 6
Identification of the transcription factors interacting with the E-box site in the LRS. Nuclear extract from DG75 cells was incubated under binding conditions with a 32P-labelled double-stranded oligonucleotide corresponding to the −66 to −41 LRS region. Antibody supershifts were carried out by incubation with antibodies as indicated below the autoradiograms. The reaction mixtures were analyzed by EMSA. One nonspecific band that was not abolished by competition with unlabelled probe is indicated by a dotted arrow. (A) Eight specific complexes are indicated by solid arrows; three are designated USF and one is designated Max/Mad1/mSin3A, since it contains these three factors. The positions of the immunologically shifted complexes are shown by the solid arrowheads for the anti-Max shifts. (B) Eight specific complexes are indicated by solid arrows: three designated USF, one designated E12, one designated Max/Mad1/mSin3A, and one designated E47. Two complexes are not designated due to the fact that the protein components were not identified. It should be noted that the addition of anti-E12 and anti-E47 antibodies to the reaction mixtures shifted the respective protein complexes to the top of the gel.
FIG. 7
FIG. 7
USF1 and USF2a transactivate the LMP1 promoter independently of EBNA2. The pSG5(USF1) and pSG5(USF2a) expression vectors, separately or mixed, or the pSG5 control vector was cotransfected with the reporter plasmid pgLRS(−106)CAT or pgLRS(−106)(mut−59/−53)CAT or the pgCAT control plasmid into DG75 cells, as detailed in Materials and Methods. The CAT activity is given as percent chloramphenicol acetylation. The values shown are the means from three independent transfections. Error bars indicate standard errors of the means.
FIG. 8
FIG. 8
USF2a-mediated transactivation of the LMP1 promoter is repressed by the Max-Mad1 heterodimer. The pSG5(USF2a) expression vector was cotransfected with the pCI(Max) and pCI(Mad1) expression vectors or an equivalent amount of the pCI control vector and with the reporter plasmid pgLRS(−106)CAT or pgLRS(−106)(mut−59/−53)CAT or the pgCAT control plasmid into DG75 cells, as detailed in Materials and Methods. Cotransfection with the mSin3A expression vector was not performed because the cells express this protein constitutively at a high level. The CAT activity is given as relative chloramphenicol acetylation expressed as a percentage of the activity obtained with the pgLRS(−106)CAT plasmid in the presence of the pSG5(USF2a) expression vector. The 100% value corresponded to acetylation of 17% of the substrate in the assay. The values are the means from three independent transfections. Error bars indicate standard errors of the means.
FIG. 9
FIG. 9
Treatment with the deacetylase inhibitor trichostatin A upregulates the expression of the LMP1 gene and induces the lytic cycle in some EBV-transformed B-cell lines. Trichostatin A (TSA) was added to the culture media of three EBV-positive cell lines, Rael, P3HR-1, and Daudi, and the expression of the LMP1 and BZLF1 proteins was monitored by sodium dodecyl sulfate-polyacrylamide gel electrophoresis and immunoblotting. For control purposes, the expression of LMP1 and BZLF1 was induced in parallel cultures by using 5-azacytidine (5-azaC), TPA, or n-butyrate, depending on the cell line, as indicated above the lanes and described in Materials and Methods. (A) The mouse anti-LMP1 antibody CS 1-4 was used. The positions of the full-length LMP1 and the truncated form found in lytically infected cells are indicated on the right. The sizes of the LMP1 proteins differ between the cell lines due to varying numbers of a specific repeat in the proteins. (B) The mouse anti-BZLF1 antibody was used. It should be noted that the BZLF1 protein was expressed at low levels in uninduced P3HR-1 cells. This cell line is known to contain lytic cell subpopulations. A longer exposure of the autoradiogram for the Daudi cell extracts was required in order to detect BZLF1 protein expression. Numbers on the left are molecular masses in kilodaltons.

Similar articles

Cited by

References

    1. Allday M J, Crawford D H, Thomas J A. Epstein-Barr virus (EBV) nuclear antigen 6 induces expression of the EBV latent membrane protein and an activated phenotype in Raji cells. J Gen Virol. 1993;74:361–369. - PubMed
    1. Amati B, Land H. Myc-Max-Mad: a transcriptional factor network controlling cell cycle progression, differentiation and death. Curr Biol. 1994;4:102–108. - PubMed
    1. Atchley W R, Fitch W M. A natural classification of the basic helix-loop-helix class of transcription factors. Proc Natl Acad Sci USA. 1997;94:5172–5176. - PMC - PubMed
    1. Ayer D E, Kretzner L, Eisenman R N. Mad: a heterodimeric partner for Max that antagonizes Myc transcriptional activity. Cell. 1993;72:211–222. - PubMed
    1. Ayer D E, Lawrence Q A, Eisenman R N. Mad-Max transcriptional repression is mediated by ternary complex formation with mammalian homologs of yeast repressor Sin3. Cell. 1995;80:767–776. - PubMed

Publication types

MeSH terms

Substances