. 1999 Apr;73(4):3273-83.
doi: 10.1128/JVI.73.4.3273-3283.1999.

Macrophages are the major reservoir of latent murine gammaherpesvirus 68 in peritoneal cells

Affiliations

Macrophages are the major reservoir of latent murine gammaherpesvirus 68 in peritoneal cells

K E Weck et al. J Virol. 1999 Apr.

Abstract

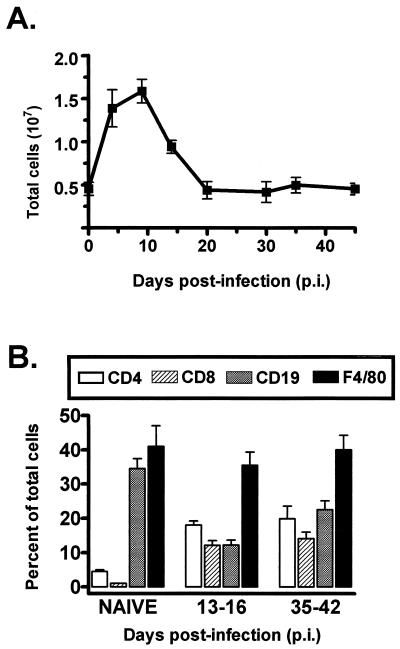
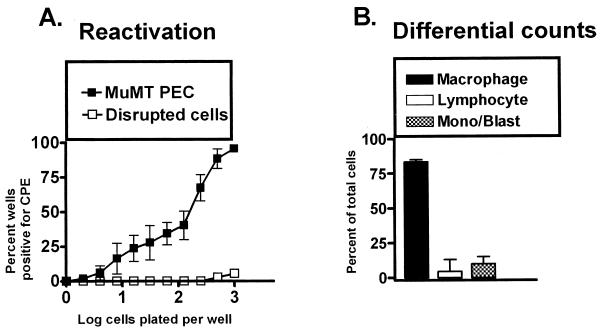
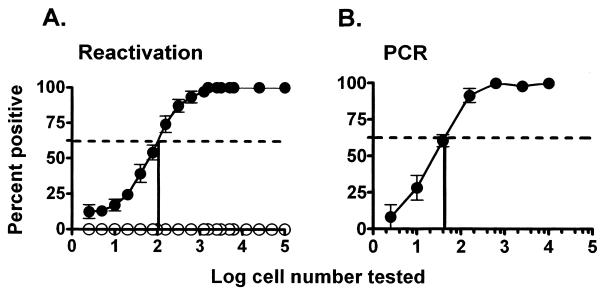
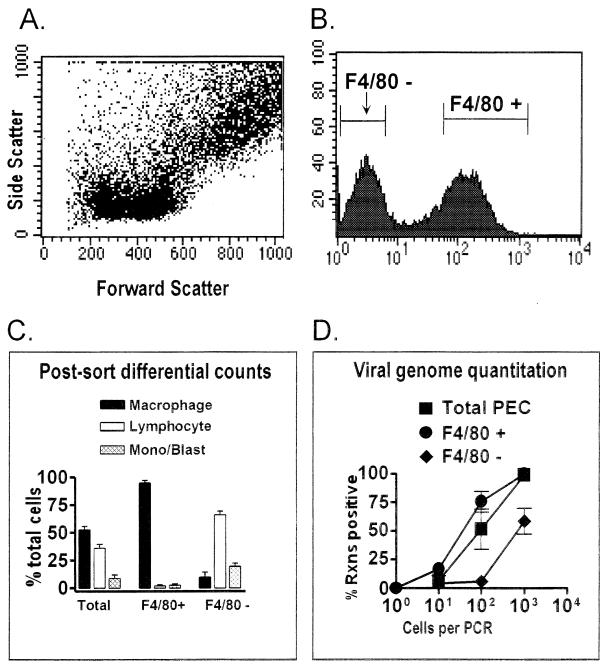
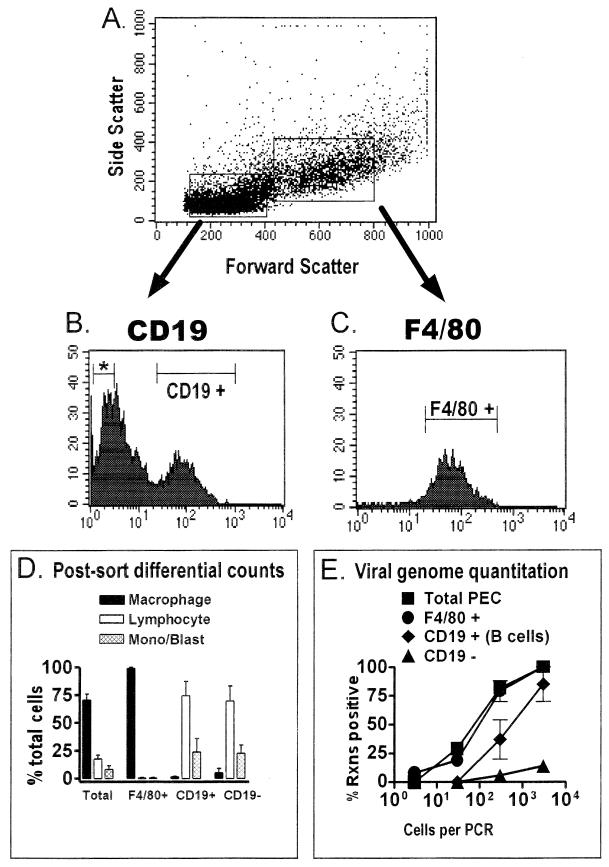
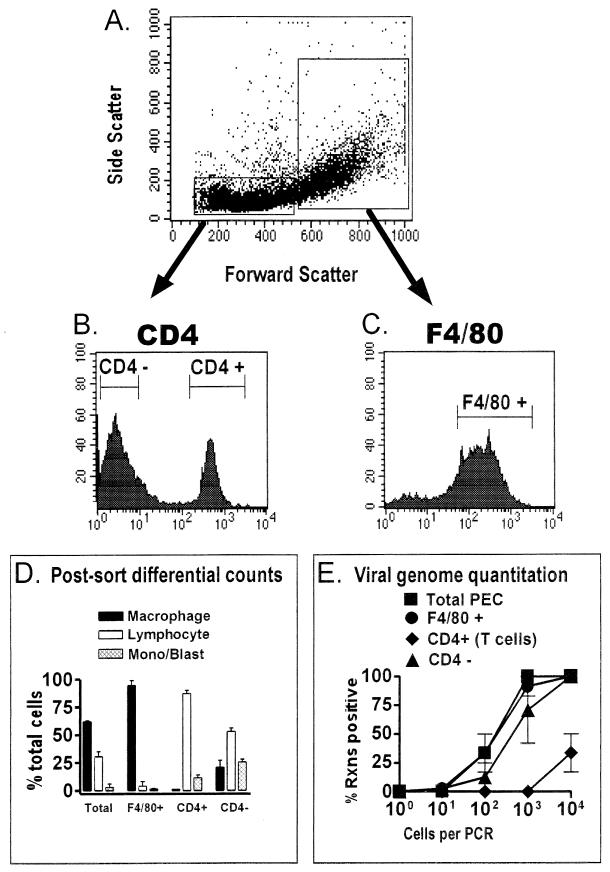
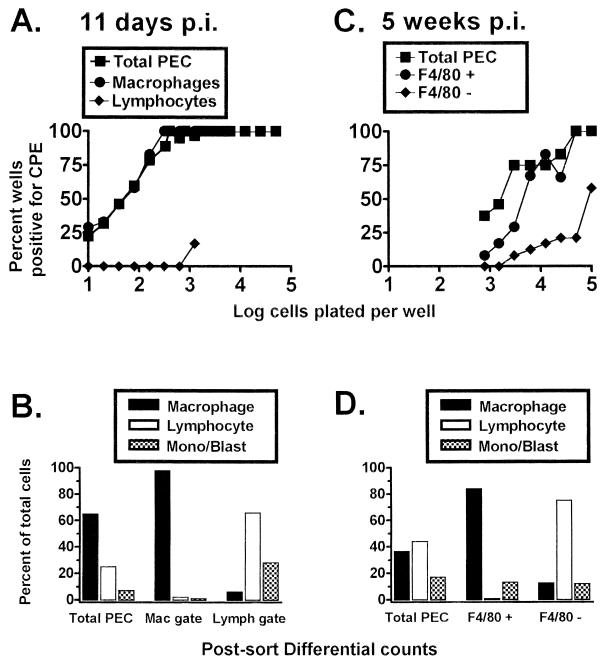
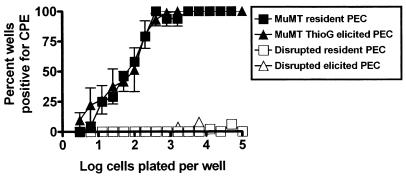
B cells have previously been identified as the major hematopoietic cell type harboring latent gammaherpesvirus 68 (gammaHV68) (N. P. Sunil-Chandra, S. Efstathiou, and A. A. Nash, J. Gen. Virol. 73:3275-3279, 1992). However, we have shown that gammaHV68 efficiently establishes latency in B-cell-deficient mice (K. E. Weck, M. L. Barkon, L. I. Yoo, S. H. Speck, and H. W. Virgin, J. Virol. 70:6775-6780, 1996), demonstrating that B cells are not required for gammaHV68 latency. To understand this dichotomy, we determined whether hematopoietic cell types, in addition to B cells, carry latent gammaHV68. We observed a high frequency of cells that reactivate latent gammaHV68 in peritoneal exudate cells (PECs) derived from both B-cell-deficient and normal C57BL/6 mice. PECs were composed primarily of macrophages in B-cell-deficient mice and of macrophages plus B cells in normal C57BL/6 mice. To determine which cells in PECs from C57BL/6 mice carry latent gammaHV68, we developed a limiting-dilution PCR assay to quantitate the frequency of cells carrying the gammaHV68 genome in fluorescence-activated cell sorter-purified cell populations. We also quantitated the contribution of individual cell populations to the total frequency of cells carrying latent gammaHV68. At early times after infection, the frequency of PECs that reactivated gammaHV68 correlated very closely with the frequency of PECs carrying the gammaHV68 genome, validating measurement of the frequency of viral-genome-positive cells as a measure of latency in this cell population. F4/80-positive macrophage-enriched, lymphocyte-depleted PECs harbored most of the gammaHV68 genome and efficiently reactivated gammaHV68, while CD19-positive, B-cell-enriched PECs harbored about a 10-fold lower frequency of gammaHV68 genome-positive cells. CD4-positive, T-cell-enriched PECs contained only a very low frequency of gammaHV68 genome-positive cells, consistent with previous analyses indicating that T cells are not a reservoir for gammaHV68 latency (N. P. Sunil-Chandra, S. Efstathiou, and A. A. Nash, J. Gen. Virol. 73:3275-3279, 1992). Since macrophages are bone marrow derived, we determined whether elicitation of a large inflammatory response in the peritoneum would recruit additional latent cells into the peritoneum. Thioglycolate inoculation increased the total number of PECs by about 20-fold but did not affect the frequency of cells that reactivate gammaHV68, consistent with a bone marrow reservoir for latent gammaHV68. These experiments demonstrate gammaHV68 latency in two different hematopoietic cell types, F4/80-positive macrophages and CD19-positive B cells, and argue for a bone marrow reservoir for latent gammaHV68.


Figures

FIG. 1
FIG. 1
Cell counts and FACS analysis of PECs isolated from C57BL/6 mice before and after infection with γHV68. (A) Total PECs harvested by peritoneal lavage from uninfected C57BL/6 mice or from C57BL/6 mice at various times post-i.p. infection with 106 PFU of γHV68 were counted. The value for each time point is the average of cell counts from eight or nine separate experiments, except those for days 20 and 30 postinfection, which are averages of two experiments. Data were pooled from groups of mice infected for periods of time up to 2 days apart. Error bars represent the standard error of the mean. (B) FACS analysis of PECs isolated from naive or γHV68-infected C57BL/6 mice was performed by using antibodies specific for CD4 T cells, CD8 T cells, B cells (CD19), or macrophages (F4/80). Shown are the percentages of total PECs for each cell type on the indicated days postinfection. The data are averages of four separate experiments. The error bars represent the standard error of the mean.
FIG. 2
FIG. 2
PECs from B-cell-deficient mice (MuMT[11]) harbor latent γHV68. (A) Limiting-dilution analysis to quantitate the frequency of cells that reactivate γHV68 was performed by using PECs from B-cell-deficient mice 5 to 10 weeks postinfection with γHV68. Shown are percentages of wells that scored positive for viral CPE 3 weeks after plating as a function of the number of cells plated per well. Twenty-four wells were plated per cell dilution in each experiment. Shown as open symbols are the results obtained when cells were killed by mechanical disruption prior to plating, which indicates that no preformed infectious virus was present in the samples analyzed. The data are averages of four separate experiments. Cells from 6 to 10 mice were pooled and assayed per experiment. The error bars represent the standard error of the mean. (B) Pre- and postsorting differential analysis of Wright’s-stained PECs from B-cell-deficient mice 5 to 10 weeks postinfection with γHV68. PECs were categorized by morphological criteria as macrophages, lymphocytes, or monocytes and/or lymphoblasts. Based on morphological criteria, monocytes could not always be distinguished from lymphoblasts. The data shown are averages of nine separate experiments. Cells from 6 to 10 mice were pooled and assayed per experiment. The error bars represent the standard error of the mean.
FIG. 3
FIG. 3
Relationship between the frequency of cells reactivating γHV68 and the frequency of cells carrying the γHV68 genome in C57BL/6 PECs 9 to 10 days postinfection. Shown is the percentage of wells in which γHV68 reactivation was detected (A) or the percentage of PCRs which were positive for the presence of the viral genome (B) as a function of the number of cells analyzed. For each cell number, 24 wells in the reactivation analysis (A) or 12 to 24 PCRs (B) were analyzed in each experiment. The data presented are averages of seven separate experiments, and each experiment involved a pool of three mice. The dotted line indicates 62.5%, which was used to calculate the frequency of reactivating or genome-positive cells by Poisson distribution. The error bars represent the standard error of the mean. (A) Frequency of cells that reactivated γHV68 assessed by using the limiting-dilution reactivation assay as described in Materials and Methods. The results of the reactivation assay using disrupted cells, representing the presence of preformed infectious virus, are shown as open symbols. (B) Frequency of cells carrying the γHV68 genome determined by limiting-dilution PCR analysis. Each point represents 84 to 168 separate PCRs.
FIG. 4
FIG. 4
F4/80-positive peritoneal macrophages from latently infected C57BL/6 mice harbor the γHV68 genome. PECs collected from C57BL/6 mice 9 to 15 days postinfection with γHV68 were stained with F4/80. The F4/80-negative and F4/80-positive cell populations were separated by FACS sorting, and the frequency of cells carrying the γHV68 genome was quantitated by PCR. The results shown are averages of four separate experiments. In three experiments, cells were sorted as shown. In one experiment, cells were pregated into lymphocyte-enriched or macrophage-enriched populations prior to F4/80 sorting, as shown in Fig. 5 and 6. Data from the four experiments were comparable. (A) Dot plot showing forward and side scatter characteristics of peritoneal cells from a representative experiment. (B) Results of F4/80 staining and gates used for FACS sorting of F4/80-negative and F4/80-positive cell populations from a representative experiment. Cell counts are shown on the y axis, and mean fluorescence intensity is shown on the x axis. Gates for sorting were drawn tightly to prevent contamination of sorted populations. For the four experiments performed, 39 to 42% of the PECs were sorted as F4/80 negative and 39 to 44% of the PECs were sorted as F4/80 positive. (C) Pre- and postsorting differential analysis of Wright’s-stained cells from total PECs and F4/80-positive and F4/80-negative PECs. Presorting and postsorting populations were categorized by morphological criteria as macrophages, lymphocytes, or monocytes-lymphoblasts (Mono/Blast). Based on morphological criteria, monocytes could not always be distinguished from lymphoblasts. (D) Limiting-dilution quantitation of the frequency of γHV68 genome-positive cells by using total PECs and F4/80-positive and F4/80-negative PEC populations. Tenfold dilutions of each cell population were tested for the presence of the γHV68 genome by nested PCR as described in Materials and Methods. The data in panels C and D are averages of four experiments. The error bars represent the standard error of the mean. Rxns, reactions.
FIG. 5
FIG. 5
The frequency of macrophages harboring the viral genome is higher than the frequency of B cells harboring the viral genome in the peritoneum of latently infected C57BL/6 mice. PECs isolated from C57BL/6 mice 13 to 15 days postinfection with γHV68 were stained with F4/80 (specific for macrophages) or with a CD19-specific antibody (specific for B cells), and relevant cell populations were isolated by FACS sorting. The results shown represent two separate experiments. (A) Cells were pregated into lymphocyte-enriched or macrophage-enriched populations based on forward scatter and side scatter characteristics, as shown for a representative experiment. (B) PECs from the lymphocyte-enriched population were sorted into CD19-negative (denoted by an asterisk) and CD19-positive fractions. Shown are the results of CD19 staining and the gates used for FACS sorting of CD19-positive and CD19-negative cell populations from a representative experiment. Gates for sorting were drawn tightly to prevent contamination of sorted populations. By these criteria, 40 to 50% of cells from the lymphocyte-enriched gate were sorted as CD19 negative and 16 to 24% of the cells from the lymphocyte-enriched gate were sorted as CD19 positive. (C) F4/80-positive PECs were sorted from the macrophage-enriched population. Shown are the results of F4/80 staining and the gate used for FACS sorting of F4/80-positive cells from a representative experiment. For the two experiments performed, 91 to 94% of the PECs from the macrophage-enriched gate were sorted as F4/80 positive. (D) Pre- and postsorting differential analysis of Wright’s-stained cells. Cells were categorized by morphological criteria as macrophages, lymphocytes, or monocytes-lymphoblasts (Mono/Blast). Based on morphological criteria, monocytes could not always be distinguished from lymphoblasts. (E) Limiting-dilution nested PCR analysis to quantitate the frequency of γHV68 genome-positive cells in the total PECs and the F4/80-positive, CD19-positive, and CD19-negative populations. Tenfold dilutions of each cell population were tested for the presence of the γHV68 genome by nested PCR. The data in panels D and E are averages of two separate experiments. The error bars represent the standard error of the mean. Rxns, reactions.
FIG. 6
FIG. 6
CD4-positive T cells from latently infected C57BL/6 mice do not harbor the γHV68 genome. PECs collected from C57BL/6 mice 13 to 15 days postinfection with γHV68 were stained with F4/80 or with a CD4-specific antibody for FACS sorting. The results shown represent two separate experiments. (A) Cells were pregated into lymphocyte-enriched or macrophage-enriched populations based on forward scatter and side scatter characteristics, as shown for a representative experiment. (B) PECs from the lymphocyte-enriched population were sorted into CD4-negative and CD4-positive fractions as described in Materials and Methods. Shown are the results of CD4 staining and the gates used for FACS sorting of CD4-positive and CD4-negative cell populations from a representative experiment. Gates for sorting were drawn tightly to prevent contamination of sorted populations. By these criteria, 62 to 67% of the cells from the lymphocyte-enriched gate were sorted as CD4 negative and 28% of the cells from the lymphocyte-enriched gate were sorted as CD4 positive. (C) F4/80-positive PECs were sorted from the macrophage-enriched population. Shown are the results of F4/80 staining and the gate used for FACS sorting of F4/80-positive cells from a representative experiment. For the two experiments performed, 75 to 85% of the PECs were sorted as F4/80 positive. (D) Pre- and postsorting differential analysis of Wright’s-stained cells. Cells were categorized by morphological criteria as macrophages, lymphocytes, or monocytes-lymphoblasts (Mono/Blast). Based on morphological criteria, monocytes could not always be distinguished from lymphoblasts. (E) Limiting-dilution PCR analysis to quantitate the frequency of γHV68 genome-positive cells in total PECs and F4/80-positive, CD4-positive, and CD4-negative PECs. Tenfold dilutions of each cell population were tested for the presence of the γHV68 genome by nested PCR. The data in panels D and E are averages of two separate experiments. The error bars represent the standard error of the mean. Rxns, reactions.
FIG. 7
FIG. 7
Peritoneal macrophages from C57BL/6 mice harbor latent γHV68, as detected by an ex vivo reactivation assay. Limiting-dilution analysis was used to quantitate the frequency of cells that reactivate γHV68 by using FACS-sorted PEC populations isolated from γHV68-infected C57BL/6 mice. (A) Limiting-dilution reactivation analysis to determine the frequency of cells that reactivate γHV68 by using PECs from C57BL/6 mice 11 days postinfection (p.i.). PECs were FACS sorted into macrophage- or lymphocyte-enriched populations based on forward and side scatter characteristics (as for Fig. 5A and 6A). (B) Pre- and postsorting Wright’s differential staining analysis of total and fractionated PECs isolated from C57BL/5 mice 11 days postinfection. Cells were categorized by morphological criteria as macrophages (Mac), lymphocytes (Lymph), or monocytes-lymphoblasts (Mono/Blast). (C) Limiting-dilution reactivation analysis to determine the frequency of cells that reactivate γHV68 by using PECs collected from C57BL/6 mice 5 weeks postinfection. Cells were stained with F4/80, and the F4/80-negative and F4/80-positive cell populations were separated by FACS sorting as described in Materials and Methods. (D) Pre- and postsorting Wright’s differential staining analysis of total and fractionated PECs isolate from C57BL/6 mice 5 weeks postinfection. For the limiting-dilution reactivation analyses shown in panels A and C, the percentage of wells that scored positive for viral CPE 3 weeks after plating is plotted as a function of the number of cells plated per well. Twenty-four wells were plated per cell dilution. Each graph represents a single experiment. Cells from 4 to 10 mice were pooled and assayed per experiment.
FIG. 8
FIG. 8
The frequencies of cells reactivating γHV68 are similar in resident and thioglycolate-elicited PECs. Ex vivo limiting-dilution reactivation analysis was used to determine the frequency of cells that reactivate latent γHV68 by using PECs from B-cell-deficient mice (MuMT[11]) ranging from days 31 to 57 postinfection with γHV68 i.p. Latently infected mice were either left untreated (resident PECs) or injected 4 days prior to harvest with 3 ml of thioglycolate i.p. (ThioG-elicited PECs) as described in Materials and Methods. The results of the reactivation analysis using disrupted cells, representing the presence of preformed infectious virus, are shown as open symbols. In resident (unelicited) PECs, there was an average of 1.4 × 10⁶ cells per mouse. After thioglycolate elicitation, there was an average of 3.1 × 10⁷ cells per mouse. The data shown are averages of three separate experiments. For each experiment, PECs from two to nine mice in the thioglycolate-elicited group or 9 to 17 mice in the unelicited groups were pooled. Error bars represent the standard error of the mean. Similar frequencies of γHV68 reactivation were also seen when resident and elicited PECs from C57BL/6 mice were compared (one experiment, data not shown).

Similar articles

Cited by

References

    1. Austyn J M, Gordon S. F4/80, a monoclonal antibody directed specifically against the mouse macrophage. Eur J Immunol. 1981;11:805–815. - PubMed
    1. Bowden R J, Simas J P, Davis A J, Efstathiou S. Murine gammaherpesvirus 68 encodes tRNA-like sequences which are expressed during latency. J Gen Virol. 1997;78:1675–1687. - PubMed
    1. Cesarman E, Chang Y, Moore P S, Said J W, Knowles D M. Kaposi’s sarcoma-associated herpesvirus-like DNA sequences in AIDS-related body-cavity-based lymphomas. N Engl J Med. 1995;332:1186–1191. - PubMed
    1. Cesarman E, Moore P S, Rao P H, Inghirami G, Knowles D M, Chang Y. In vitro establishment and characterization of two acquired immunodeficiency syndrome-related lymphoma cell lines (BC-1 and BC-2) containing Kaposi’s sarcoma-associated herpesvirus-like (KSHV) DNA sequences. Blood. 1995;86:2708–2714. - PubMed
    1. Decker L L, Shankar P, Khan G, Freeman R B, Dezube B J, Lieberman J, Thorley-Lawson D A. The Kaposi’s sarcoma-associated herpesvirus (KSHV) is present as an intact latent genome in KS tissue but replicates in the peripheral blood mononuclear cells of KS patients. J Exp Med. 1996;184:283–288. - PMC - PubMed

Publication types