. 1999 Mar;103(5):605-12.
doi: 10.1172/JCI5217.

Dynamic regulation of gastric surface pH by luminal pH

Affiliations

Dynamic regulation of gastric surface pH by luminal pH

S Chu et al. J Clin Invest. 1999 Mar.

Abstract

In vivo confocal imaging of the mucosal surface of rat stomach was used to measure pH noninvasively under the mucus gel layer while simultaneously imaging mucus gel thickness and tissue architecture. When tissue was superfused at pH 3, the 25 microm adjacent to the epithelial surface was relatively alkaline (pH 4.1 +/- 0.1), and surface alkalinity was enhanced by topical dimethyl prostaglandin E2 (pH 4.8 +/- 0.2). Luminal pH was changed from pH 3 to pH 5 to mimic the fasted-to-fed transition in intragastric pH in rats. Under pH 5 superfusion, surface pH was relatively acidic (pH 4.2 +/- 0.2). This surface acidity was enhanced by pentagastrin (pH 3.5 +/- 0.2) and eliminated by omeprazole, implicating parietal cell H,K-ATPase as the dominant regulator of surface pH under pH 5 superfusion. With either pH 5 or pH 3 superfusion (a) gastric pit lumens had the most divergent pH from luminal superfusates; (b) qualitatively similar results were observed with and without superfusion flow; (c) local mucus gel thickness was a poor predictor of surface pH values; and (d) no channels carrying primary gastric gland fluid through the mucus were observed. The model of gastric defense that includes an alkaline mucus gel and viscous fingering of secreted acid through the mucus may be appropriate at the intragastric pH of the fasted, but not fed, animal.


Figures

Figure 1
Figure 1
Calibration curve of fluorescence emission ratio versus pH. Superfusate fluid containing 0.01 mM Cl-NERF and 0.5 mM Lucifer yellow was titrated to the indicated values. Droplets of fluid were placed in the microscope chamber and imaged as described in Methods. Ratio values were calculated pixel by pixel after background subtraction from raw images (using images of regions without dye). Average values of three experiments are presented versus solution pH. Standard deviations were smaller than the symbols. NERF.
Figure 2
Figure 2
In vivo imaging of rat gastric mucosal surface with confocal microscopy. The mucosa was imaged in a Zeiss LSM410 confocal microscope using a C-Apo 40× objective, during continuous superfusion with Krebs saline containing Cl-NERF and Lucifer yellow, as described in Methods. Images were collected in 1 s. (a) x–y focal plane image of confocal reflectance. Epithelial surface and openings of gastric pits (p) were seen at single-cell resolution. (b) x–z focal plane perpendicular to the x–y plane. Confocal reflectance imaging from the superfusate (sf) into the mucus layer (m) adjacent to the epithelial surface (e), with evident pits (p). (c) Quantitative measurement of surface mucus layer was performed on 106 reflectance images from 28 rats in which the mucus gel layer was measurable throughout the image. Maximum and minimum gel thickness was measured in each image. The resulting frequency histogram of the 212 gel thickness values was plotted. (d) Confocal fluorescence image of 550–600 nm emission. Dye penetrates into gastric pit lumens (p) from the superfusate (sf), but does not permeate beyond the epithelial boundary (e).
Figure 3
Figure 3
Comparison of pH values reported by NERF/Lucifer yellow in isolated gastric mucus gel versus adjacent solution. A fixed volume of superfusate solution of different pH value was placed in a microscope chamber with a bolus of mucus scraped from the surface of rat gastric mucosa. The chamber was not continuously superfused, and solutions were static for 5–15 min before analysis. Confocal reflectance then defined the location of mucus gel in the chamber, and confocal fluorescence emission ratio was averaged separately from regions within and outside mucus in the same chamber. Each data point averages results from a single chamber, with separate data collected from mucus of three animals. The solid line is the linear least squares fit of the data, and the dotted lines indicate the 95% confidence intervals on the fit (Prism software; GraphPad San Diego, California, USA).
Figure 4
Figure 4
Base secretion at luminal pH 3. Tissue was imaged with a C-Apo 10× objective during superfusion with NERF/Lucifer yellow–containing Krebs saline at pH 3. Emission ratio fluorescence images were calculated from a time course experiment using a single tissue and calibrated versus pH as described in Methods. Dark spots above the mucosal surface were regions masked out during image analysis because they had off-scale fluorescence due to suspended gel debris that bound dye. Correspondence of pseudocolor to pH is shown in the bar. (a) There was a relative alkaline surface pH on gastric mucosa during pH 3 superfusion. After collecting this image, superfusion was stopped and images were collected after (b) 10 s (c) 20 s, and (d) 60 s to show active secretion of base from the surface. When superfusion was turned on again directly after (e), accumulated base in the chamber was washed out over the same time course (fh), and surface alkaline layer returned to thinner dimensions. Similar results were obtained in five experiments.
Figure 5
Figure 5
Relationship between surface pH and mucus gel thickness during pH 3 superfusion in the absence or presence of PGE2. (a) Confocal fluorescence ratio image, with correspondence of pseudocolor to pH shown in the bar. In the absence of any addition to superfusate, surface pH was alkaline and gastric pits (p) were more alkaline than surface. (b) The same tissue imaged 3 min after topical 10 μg/ml dm-PGE2. (c) Surface pH was averaged from the space 25 μm adjacent to the mucosal surface and correlated versus gel thickness at the pH measurement site in the same image. Scatter plot of individual measurements of surface pH and gel thickness in absence of any addition (open triangles) (n = 574 measurements, 11 animals) and 2–5 min after addition of 10 μg/ml topical dm-PGE2 (closed circles; n = 325 measurements, 3 animals). (d) Compilation of results from pH 3 superfusion without (gray bars) or with (blue bars) dm-PGE2 treatment. Gel thickness was grouped in values of 25 μm. Surface pH values are mean ± SEM (n = 6–197 measurements in different groups). dm-PGE2, dimethyl PGE2; PGE2, prostaglandin2.
Figure 6
Figure 6
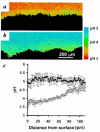
Surface pH regulation during switch from pH 3 to pH 5 superfusion. (a) Alkaline surface pH during pH 3 superfusion. (b) The gastric mucosa in a was exposed to pH 5 superfusion and imaged 30 min later. The surface pH became acidic relative to superfusate. Similar results were observed in five experiments. (c) Quantification of superfusate pH as a function of distance from the gastric surface. Results are mean ± SEM from three rats during tissue superfusion with pH 5. Results from the same tissues before (open circles) or 30 min after intravenous injection with 8 mg/kg omeprazole (closed circles).
Figure 7
Figure 7
Continuous acid secretion during pH 5 superfusion is regulated by gastrin. Confocal images were collected during a time course exposing a single tissue. Dark spots near the mucosal surface were regions masked out during image analysis because they had off-scale fluorescence due to suspended gel debris that bound dye. The correspondence of pseudocolor to pH is shown in the bar. (a) A relatively acidic surface pH was observed on the unstimulated gastric mucosa during pH 5 superfusion. After collecting this image, superfusion was stopped, and (b) an image was collected after 3 min to show acid accumulation in the chamber. After restarting superfusion (c), an image was collected 5 min after pentagastrin injection (50 μg/kg intravenously). (d) Superfusion was again turned off for 3 min, demonstrating greater acid accumulation in the chamber after gastrin stimulation. Similar results obtained in four experiments.
Figure 8
Figure 8
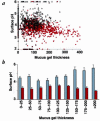
Relationship between surface pH and mucus gel thickness during pH 5 superfusion, in the absence or presence of gastrin. Gastric mucosa was superfused with pH 5 Krebs solution during confocal imaging. (a) Surface pH averaged from the space 25 μm adjacent to the mucosal surface versus gel thickness at the pH measurement site in the same image. Scatter plot of individual measurements of surface pH and gel thickness in absence of any addition (open triangles; n = 664 measurements, 9 animals) and 10–15 min after addition of pentagastrin (closed circles; n = 701 measurements, 4 animals). (b) Compilation of results from pH 5 superfusion without (gray bars) and with (red bars) pentagastrin. Gel thickness was grouped in values of 25 μm. Surface pH values are mean ± SEM (n = 14–151 measurements in individual groups).

Similar articles

Cited by

References

    1. Baron JH. The discovery of gastric acid. Gastroenterology. 1979;76:1056–1064. - PubMed
    1. Allen A, Flemstrom G, Garner A, Kivilaakso E. Gastroduodenal mucosal protection. Physiol Rev. 1993;73:823–857. - PubMed
    1. Nagano F, et al. Effects of H+ and HCO3- secretion on mucus gel pH in isolated antral mucosa of bullfrog stomach. Bull Osaka Med Coll. 1990;36:13–25. - PubMed
    1. Schade C, Flemstrom G, Holm L. Hydrogen ion concentration in the mucus layer on top of acid-stimulated and -inhibited rat gastric mucosa. Gastroenterology. 1994;107:180–188. - PubMed
    1. Ross IN, Turnberg LA. Studies of the “mucus-bicarbonate” barrier on rat fundic mucosa: the effects of luminal pH and a stable prostaglandin analogue. Gut. 1983;24:1030–1033. - PMC - PubMed

Substances