. 1999 Mar;103(5):697-705.
doi: 10.1172/JCI5298.

Cardiomyocytes can be generated from marrow stromal cells in vitro

Affiliations

Cardiomyocytes can be generated from marrow stromal cells in vitro

S Makino et al. J Clin Invest. 1999 Mar.

Abstract

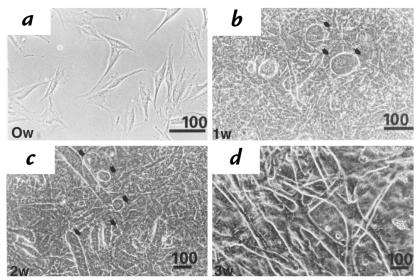
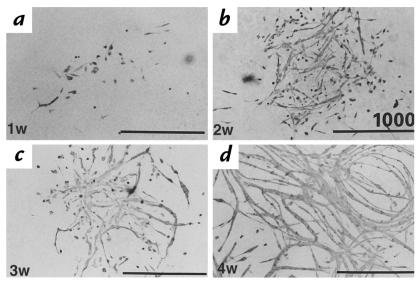
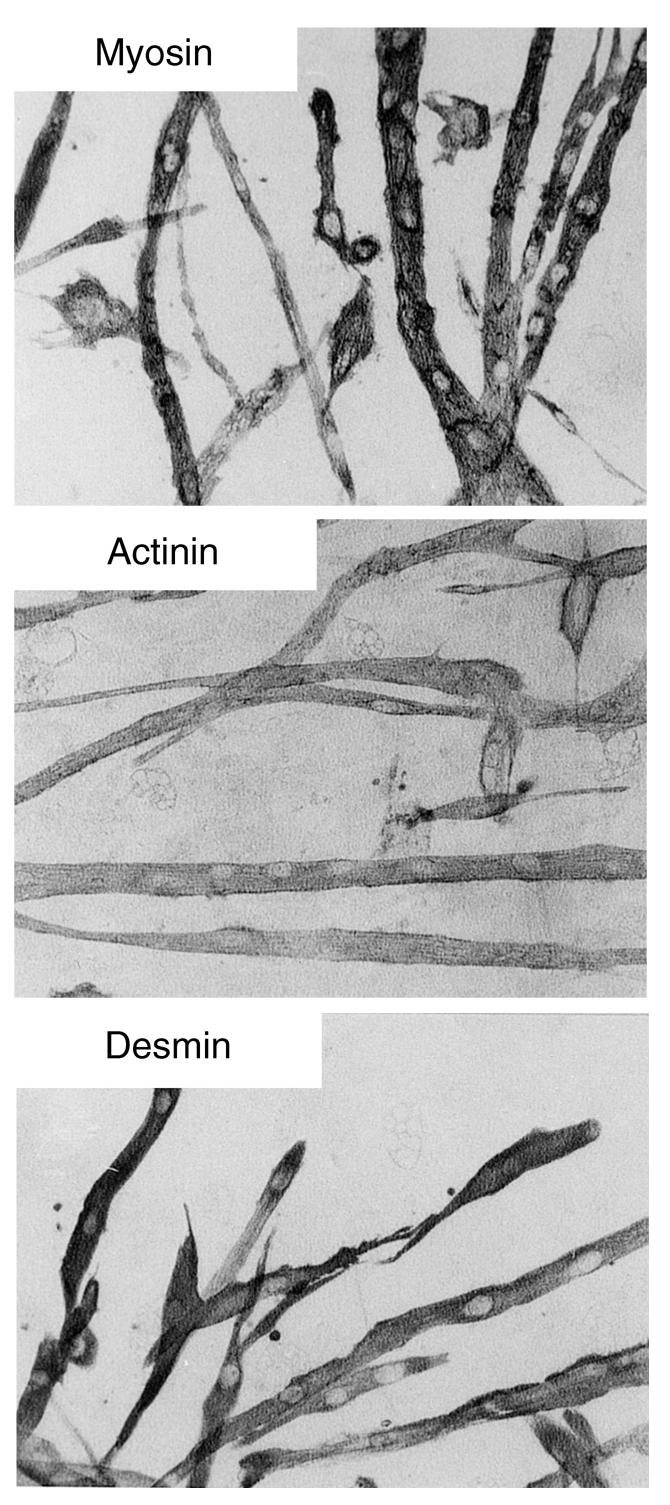
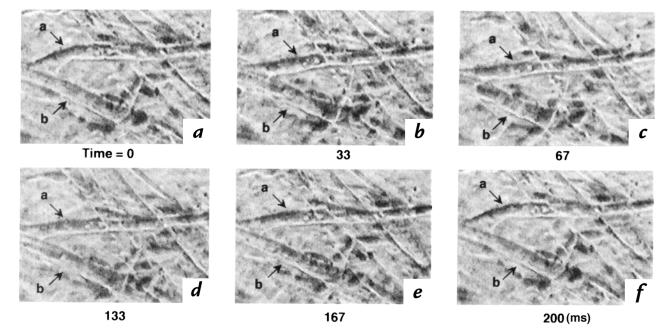
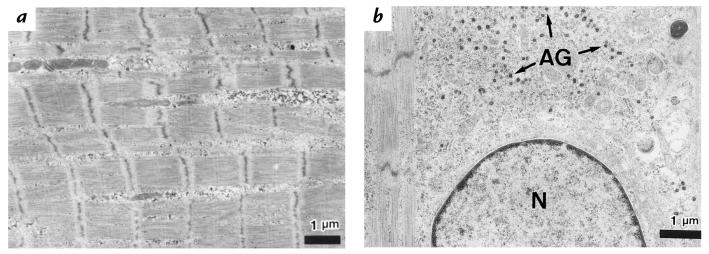
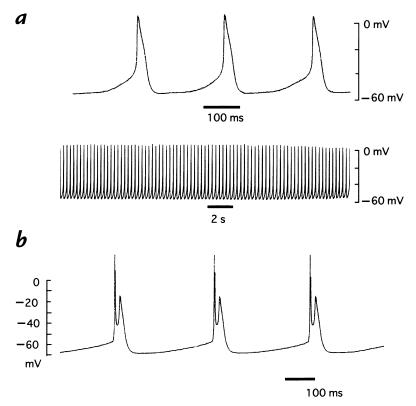
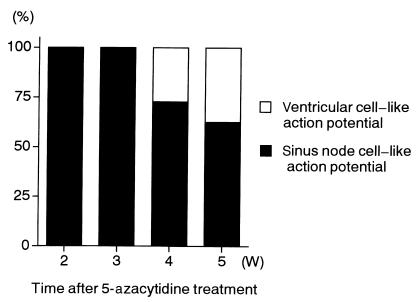
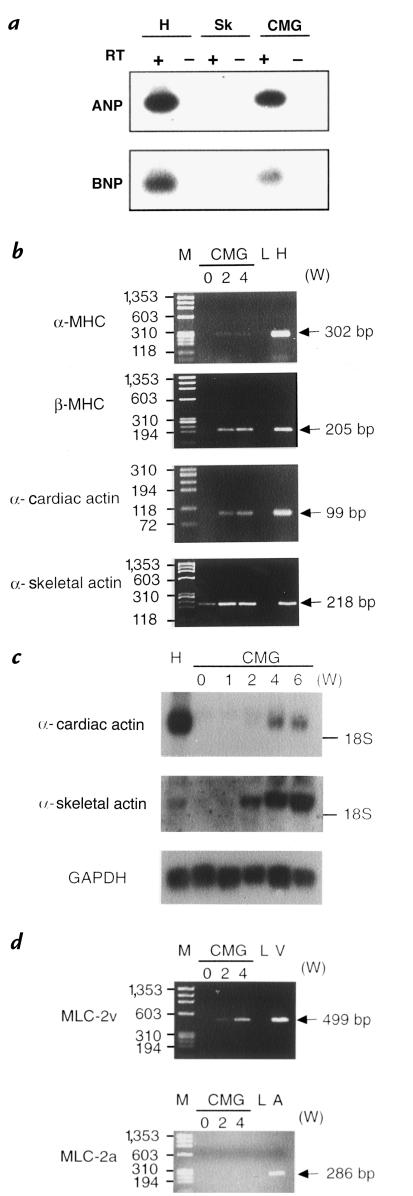
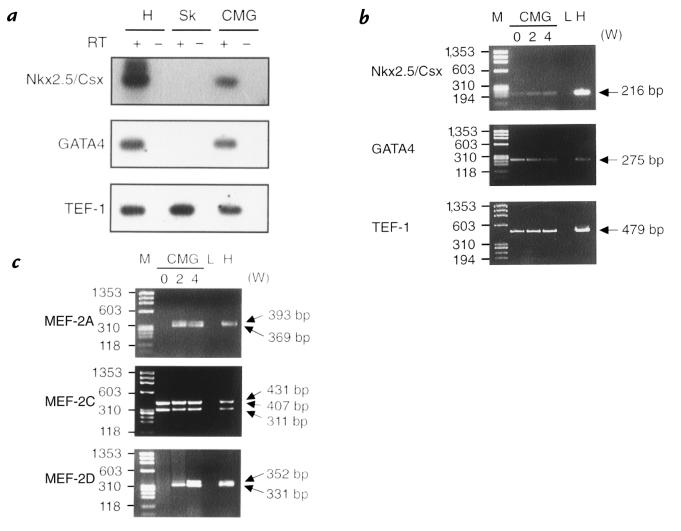
We have isolated a cardiomyogenic cell line (CMG) from murine bone marrow stromal cells. Stromal cells were immortalized, treated with 5-azacytidine, and spontaneously beating cells were repeatedly screened. The cells showed a fibroblast-like morphology, but the morphology changed after 5-azacytidine treatment in approximately 30% of the cells; they connected with adjoining cells after one week, formed myotube-like structures, began spontaneously beating after two weeks, and beat synchronously after three weeks. They expressed atrial natriuretic peptide and brain natriuretic peptide and were stained with anti-myosin, anti-desmin, and anti-actinin antibodies. Electron microscopy revealed a cardiomyocyte-like ultrastructure, including typical sarcomeres, a centrally positioned nucleus, and atrial granules. These cells had several types of action potentials, such as sinus node-like and ventricular cell-like action potentials. All cells had a long action potential duration or plateau, a relatively shallow resting membrane potential, and a pacemaker-like late diastolic slow depolarization. Analysis of the isoform of contractile protein genes, such as myosin heavy chain, myosin light chain, and alpha-actin, indicated that their muscle phenotype was similar to that of fetal ventricular cardiomyocytes. These cells expressed Nkx2.5/Csx, GATA4, TEF-1, and MEF-2C mRNA before 5-azacytidine treatment and expressed MEF-2A and MEF-2D after treatment. This new cell line provides a powerful model for the study of cardiomyocyte differentiation.


Figures

Figure 1
Figure 1
Phase-contrast photographs of CMG cells before and after 5-azacytidine treatment. (a) CMG cells show fibroblast-like morphology before 5-azacytidine treatment (0 weeks, 0W). (b) One week after treatment. Some cells gradually increased in size and formed a ball-like or stick-like appearance (arrowheads). These cells began spontaneously beating thereafter. (c) Two weeks after treatment. Ball-like or stick-like cells connected with adjoining cells and began to form myotube-like structures. (d) Three weeks after treatment. Most of the beating cells were connected and formed myotube-like structures. Scale bars: 100 μm. CMG, cardiomyogenic cell line.
Figure 2
Figure 2
Immunostaining of CMG cells with anti–sarcomeric myosin antibody at 1 week (a), 2 weeks (b), 3 weeks (c), and 4 weeks (d) after 5-azacytidine treatment. Myosin-positive cells could be observed at 1 week after 5-azacytidine treatment. Myosin-positive cells gradually joined to neighboring myosin-positive cells and formed myotube-like structures. Scale bars: 1,000 μm. The maximal length of the myotube was 3,000 μm.
Figure 3
Figure 3
Immunostaining of CMG cells with anti–sarcomeric myosin, anti-actinin, and anti-desmin antibodies after 5-azacytidine treatment (3 weeks). CMG myotubes were stained with both anti–sarcomeric myosin, anti-actinin, and anti-desmin antibodies.
Figure 4
Figure 4
A series of photographs representing one contraction of beating CMG myotubes recorded by phase-contrast video microscope. The beating differentiated CMG myotubes were videotaped as described in Methods. In each panel, a and b represent branches of a single myotube that beat spontaneously. Panel a is at the end of relaxation and panel b is at maximum contraction.
Figure 5
Figure 5
Transmission electron micrograph of CMG myotubes. (a) Differentiated CMG myotubes revealed well-organized sarcomeres. Rich glycogen granules and a number of mitochondria were observed. (b) Ultrastructural analysis revealed that nuclei (N) were oval and positioned in the central part of the cell, not immediately beneath the sarcolemma. Atrial granules (AG), measuring 70–130 nm in diameter, are observed in the sarcoplasm and are concentrated especially in the juxtanuclear cytoplasm. Scale bars: 1 μm.
Figure 6
Figure 6
Representative tracing of the action potential of CMG myotubes. Action potential recordings using a conventional microelectrode were obtained from the spontaneously beating cells at day 28 after 5-azacytidine treatment. We categorized these action potentials into two groups: a sinus node–like action potential (a) or a ventricular cardiomyocyte–like action potential (b). These action potentials have a relatively shallow resting membrane potential with late diastolic slow depolarization: a pacemaker-like potential. The ventricular cardiomyocyte–like action potential had peak notch-plateau characteristics, with an initial tall overshoot in phase 0, a repolarizing notch in phase 1, and a second depolarizing plateau in phase 2, whereas the sinus node–like action potential had none of these features. Beating cycle length, action potential amplitude, action potential duration, and most diastolic potential are given in Table 2.
Figure 7
Figure 7
Time course of the percentage of the pattern of action potentials in CMG myotubes. The percentage of the sinus node–like and ventricular cardiomyocyte–like action potential of the CMG cells after 5-azacytidine treatment was demonstrated. Ventricular cardiomyocyte–like action potential was first recorded 4 weeks after 5-azacytidine treatment, and incidence rapidly increased thereafter.
Figure 8
Figure 8
Expression of cardiomyocyte-specific genes in and phenotype analysis of CMG cells. (a) reverse transcriptase (RT)-PCR Southern analysis of natriuretic peptide (ANP) and brain natriuretic peptide (BNP) in CMG cells. Total RNA was isolated from mouse heart (H), skeletal muscle (Sk), and differentiated CMG cells. After DNase I treatment, RT-PCR was performed, as described in Methods, for ANP and BNP. Each PCR product was identified by Southern blot using 32P-labeled synthetic oligonucleotides. Both ANP and BNP are specifically expressed in cardiac muscle and CMG myotubes. (b) RT-PCR analysis of α-myosin heavy chain (α-MHC), β-myosin heavy chain (β-MHC), α-cardiac actin, and α-skeletal actin expression in CMG cells. Heart (H) and liver (L) were used as positive and negative controls. M represents ΦXHaeIII molecular size marker. CMG myotubes expressed both α-cardiac actin and α-skeletal actin, but the expression of α-skeletal actin was much stronger than that of α-cardiac actin. Note that α-skeletal actin expression was observed before the final 5-azacytidine treatment, although expression was weak. CMG myotubes expressed both α- and β-MHC, but the expression of β-MHC was much stronger than that of α-MHC. (c) Northern blot analysis of α-cardiac actin and α-skeletal actin expression in CMG cells. Adult heart (H) was used as a positive control. α-cardiac actin was more abundantly expressed in adult heart. On the other hand, α-skeletal actin was more abundantly expressed in CMG cells. Glyceraldehyde-3-phosphate dehydrogenase (GAPDH) was used as a loading internal control. (d) RT-PCR analysis of MLC-2a and -2v expression in CMG cells. Adult atrial muscle (A) was used as a positive control for MLC-2a, and adult ventricular muscle (V) was used as a positive control for MLC-2v. M represents ΦXHaeIII molecular size marker. CMG myotubes expressed MLC-2v, but not MLC-2a. These patterns of gene expression in the CMG myotubes corresponded to the phenotype specific to fetal ventricular cardiomyocytes.
Figure 9
Figure 9
RT-PCR analysis of cardiomyocyte-specific transcription factors. (a) Reverse transcriptase (RT)-PCR Southern blot of Nkx2.5/Csx, GATA4, and TEF-1 in differentiated CMG myotubes. Heart (H) and skeletal muscles (Sk) were used as controls. Cardiomyocytes expressed GATA4, TEF-1, and Nkx2.5/Csx, whereas skeletal muscle cells (Sk) only expressed TEF-1. Differentiated CMG myotubes expressed GATA4, TEF-1, and Nkx2.5/Csx. (b) Time course of the expression of Nkx2.5/Csx, GATA4, and TEF-1. CMG cells already expressed these genes before 5-azacytidine treatment. Heart (H) and liver (L) were used as positive and negative controls. M represents ΦXHaeIII molecular size marker. (c) Time course of the expression of MEF-2A, -2C, and -2D genes in CMG cells. Because the primers were designed to demonstrate the alternative splicing forms MEF-2 genes, several bands can be observed. CMG cells expressed the MEF-2C gene before 5-azacytidine treatment, whereas MEF-2A and MEF-2D gene expression was observed after 5-azacytidine treatment.

References

    1. Weintraub H. The MyoD family and myogenesis: redundancy, networks, and thresholds. Cell. 1993;75:1241–1244. - PubMed
    1. Silberstein L, Webster SG, Travis M, Blau HM. Developmental progression of myosin gene expression in cultured muscle cells. Cell. 1986;46:1075–1081. - PubMed
    1. Olson EN, Srivastava D. Molecular pathways controlling heart development. Science. 1996;272:671–676. - PubMed
    1. Lassar AB, Paterson BM, Weintraub H. Transfection of a DNA locus that mediates the conversion of 10T1/2 fibroblasts to myoblasts. Cell. 1986;47:649–656. - PubMed
    1. Taylor SM, Jones PA. Multiple new phenotypes induced in 10T1/2 and 3T3 cells treated with 5-azacytidine. Cell. 1979;17:771–779. - PubMed

Publication types

Substances