. 1999 Mar 15;189(6):907-18.
doi: 10.1084/jem.189.6.907.

An inflammatory polypeptide complex from Staphylococcus epidermidis: isolation and characterization

Affiliations

An inflammatory polypeptide complex from Staphylococcus epidermidis: isolation and characterization

C Mehlin et al. J Exp Med. .

Abstract

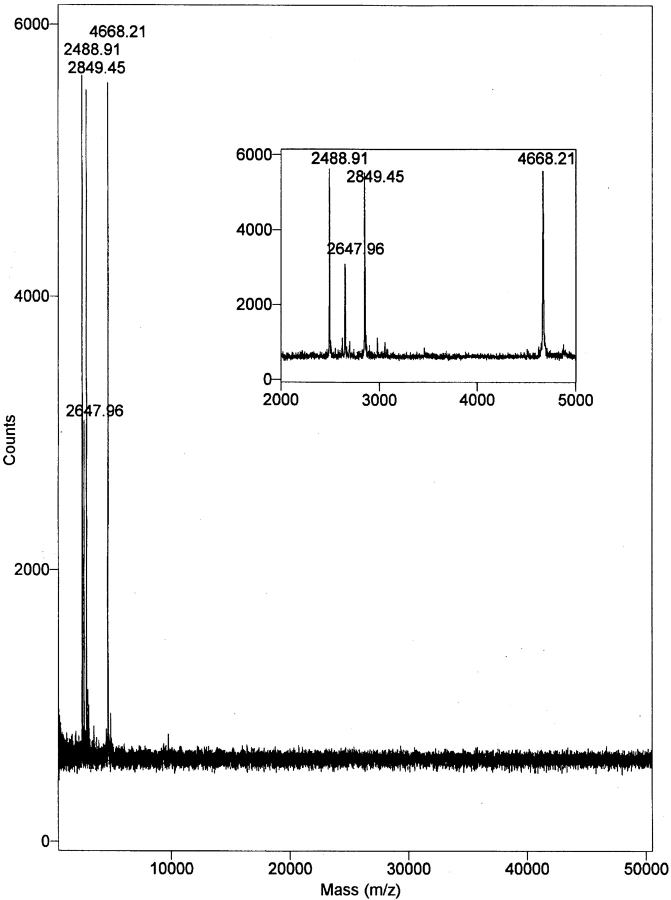
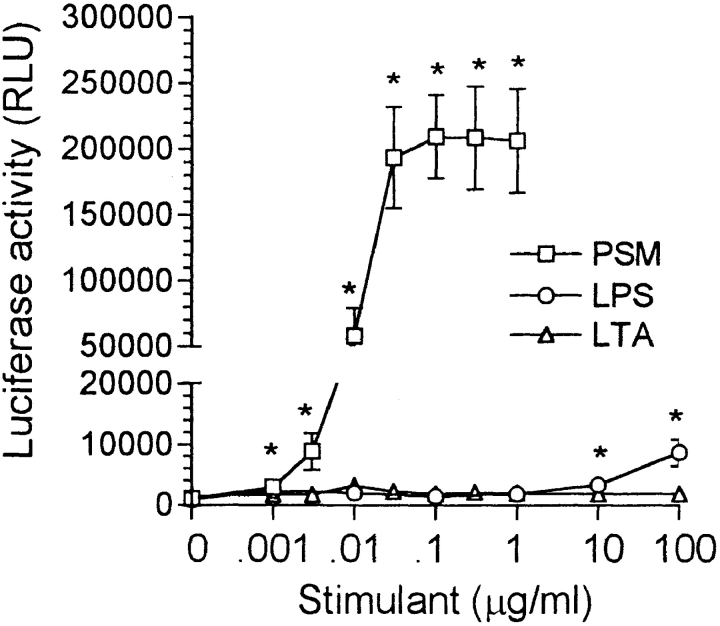
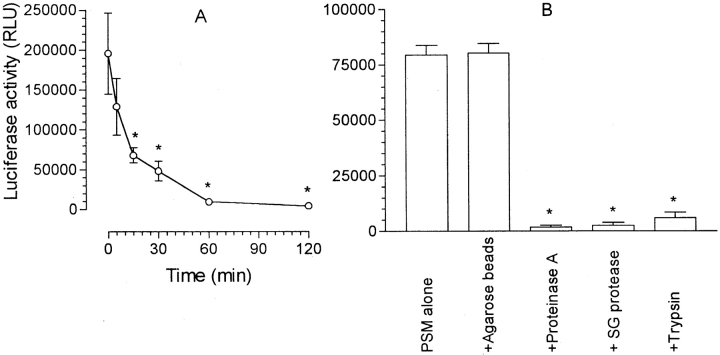
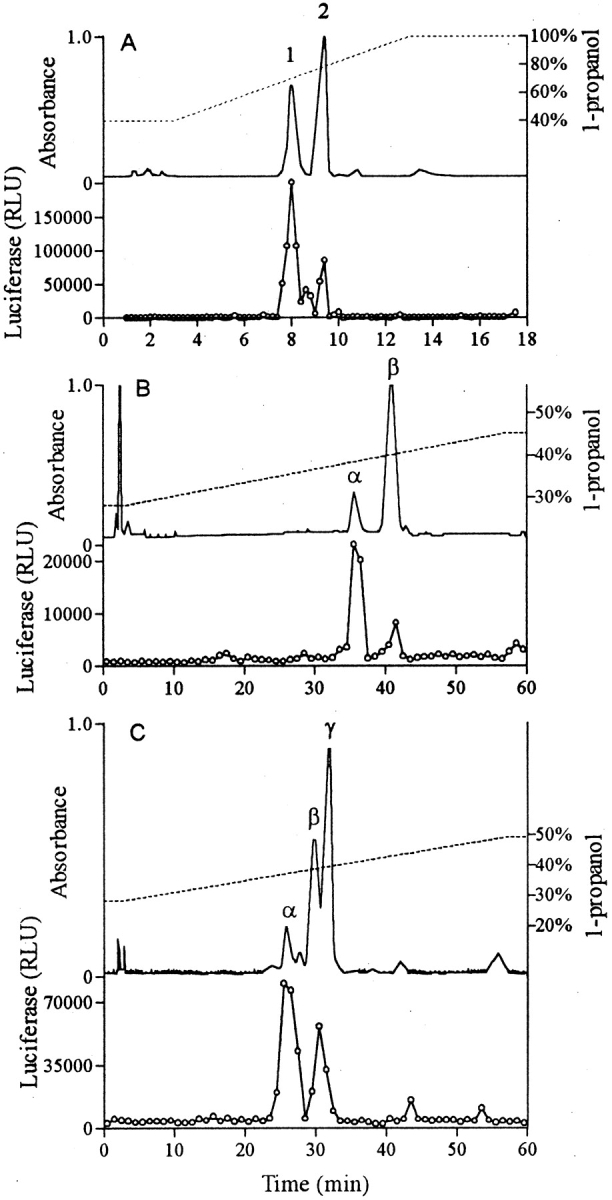
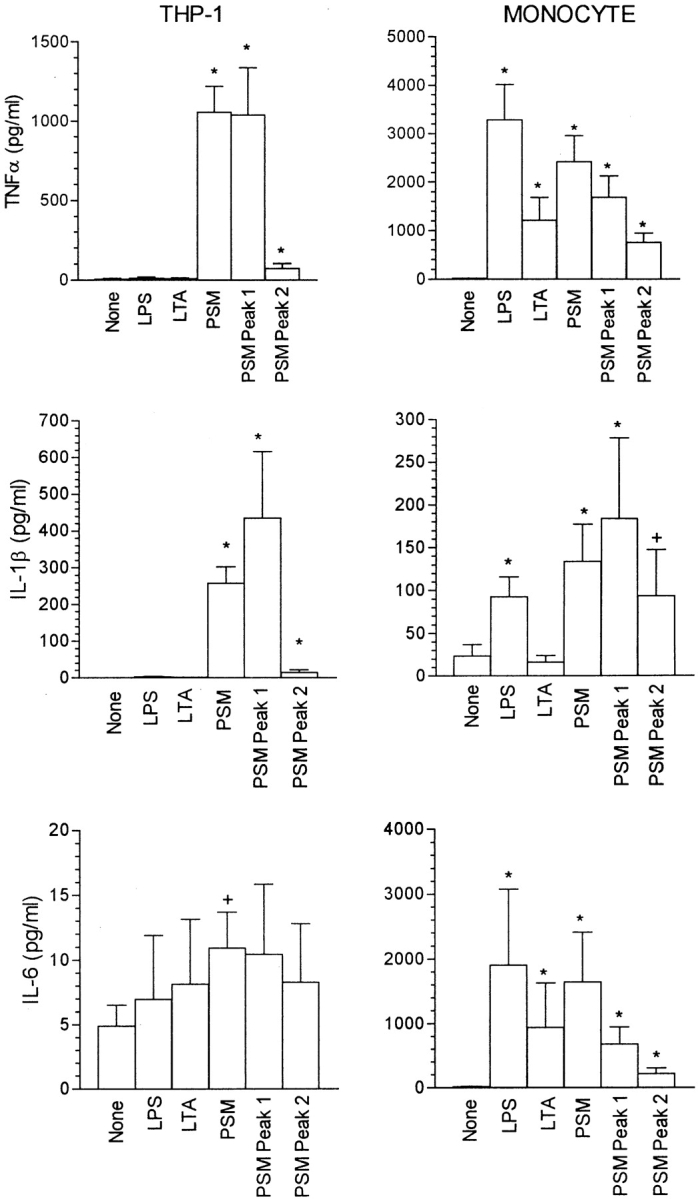
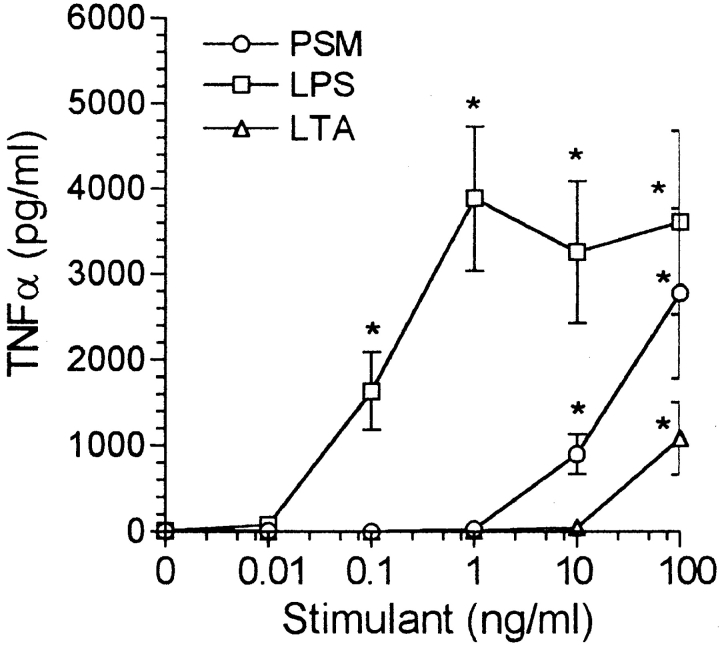
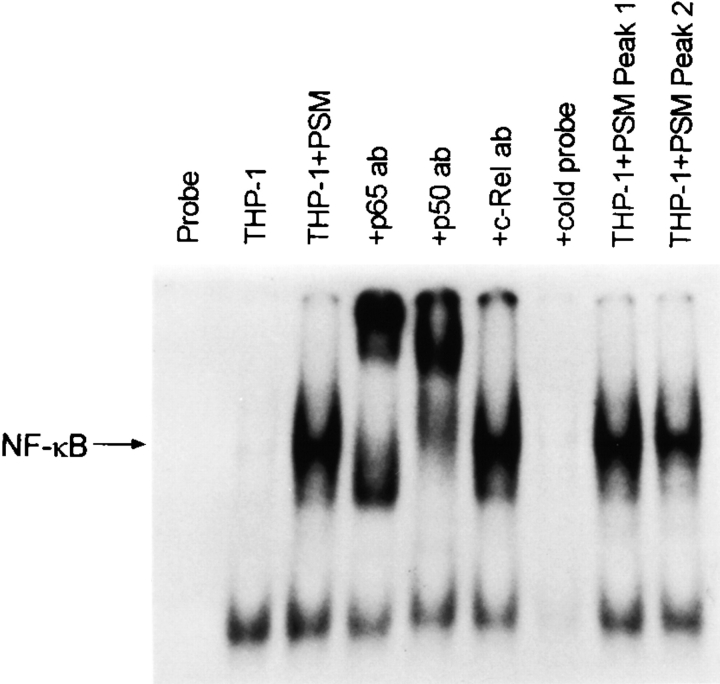
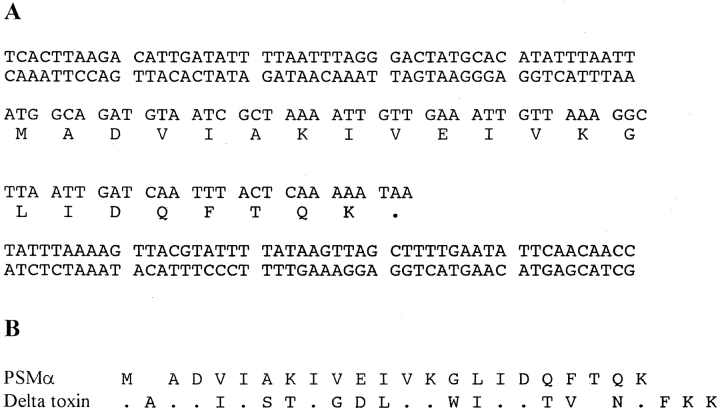
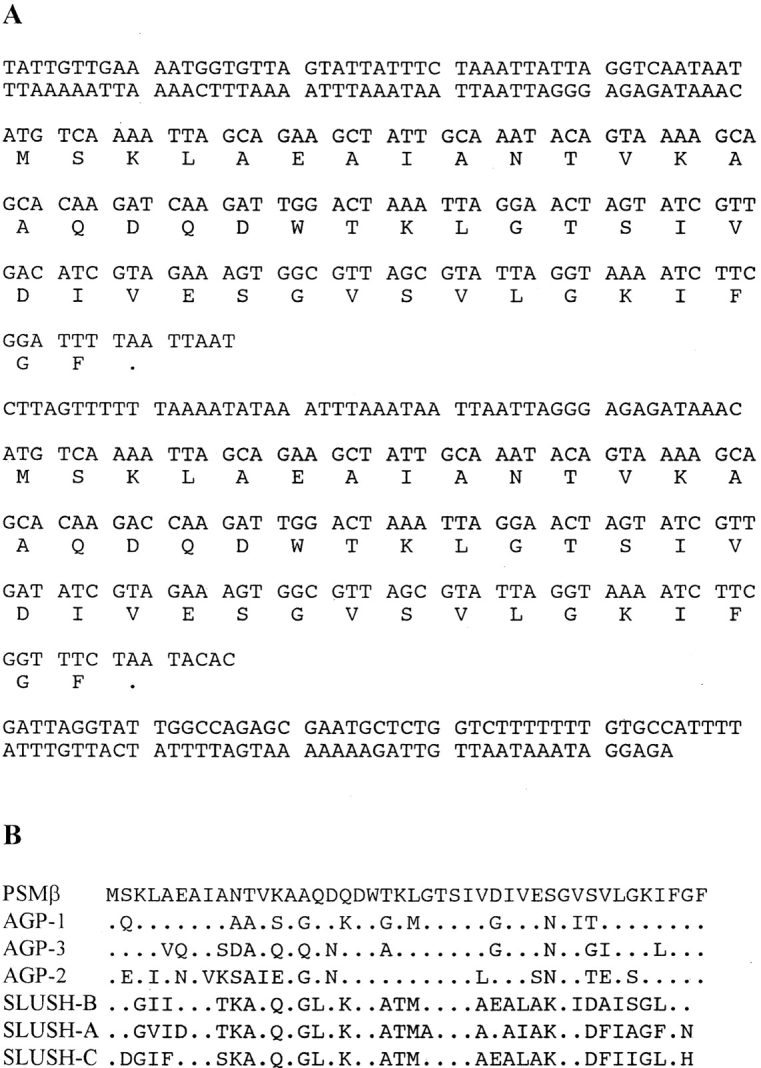
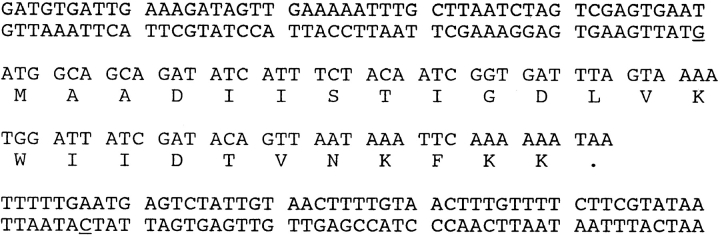
Staphylococcus epidermidis releases factors that activate the HIV-1 long terminal repeat, induce cytokine release, and activate nuclear factor B in cells of macrophage lineage. The active material had a mass of 34,500 daltons, was inactivated by proteases and partitioned into the phenol layer on hot aqueous phenol extraction, and thus was termed phenol-soluble modulin (PSM). High performance liquid chromatography (HPLC) of crude PSM yielded two peaks of activity designated PSM peak 1 and peak 2. MALDI-TOF (matrix-assisted laser desorption ionization-time of flight) mass spectroscopy indicated the presence of two components in peak 1, which were designated PSM and PSM. Peak 2 contained a single component, designated PSM. Separation of PSM and PSM in peak 1 could be achieved by a second HPLC procedure. The structure of each component was determined by amino acid sequence analysis and identification and sequencing of their genes. PSM, PSM, and PSM were 22-, 44-, and 25-amino acid, respectively, strongly hydrophobic polypeptides. PSM was identified as Staphylococcus epidermidis delta toxin, whereas PSM and PSM exhibited more distant homology to previously described staphylococcal toxins. They appeared to exist as a complex or aggregate with activity greater than the component parts. The properties of the S. epidermidis PSMs suggest that they may contribute to the systemic manifestations of Gram-positive sepsis.


Figures

Figure 1
Figure 1
MALDI-TOF mass spectroscopy of S. epidermidis PSM. The large box has a range of 500–50,500 m/z and the insert is a magnification of the 2,000–5,000 m/z range. The designated masses are M+1 (H).
Figure 2
Figure 2
Activation of the HIV-1 LTR in THP-1 cells by PSM, LPS, and LTA. The reaction mixture contained 2 × 10⁶ THP-1 LTRluc and PSM, LPS, or LTA at the concentrations indicated in RPMI at a final volume of 2.0 ml. The y-axis was broken to allow for an increased scale in the lower range to illustrate the significant effect of high concentrations of LPS. The results are the mean ± SEM of 4–13 experiments, with the asterisk indicating a significant difference from no stimulant (P < 0.05).
Figure 3
Figure 3
Effect of heat and proteinases on PSM activity. (A) PSM at 10 μg/ml in RPMI was heated in a boiling water bath for the periods indicated. For determination of luciferase synthesis, the reaction mixtures contained 2 × 10⁶ THP-1 LTRluc, either unheated or heated PSM at 100 ng/ml, and RPMI at a final volume of 2.0 ml. The results are the mean (− background) ± SEM of four experiments. The asterisk indicates a significant difference from unheated PSM. (B) PSM was preincubated with immobilized proteinase (proteinase K, Streptomyces griseus protease, trypsin) as described under Materials and Methods and activation of the LTR compared with that produced by untreated PSM or PSM preincubated with agarose beads without bound proteinase. The results are the mean ± SEM of three experiments. The asterisk indicates a significant difference from PSM alone (P < 0.05, unpaired Student's t test).
Figure 4
Figure 4
HPLC separation. The upper section of each segment indicates the absorbance at 214 nm (solid line) and the 1-propanol gradient (broken line). The lower section indicates the activity of the fractions in the THP-1 LTRluc assay. (A) Rapid HPLC of crude PSM: C4 column; 36–100%, 10 min, 1-propanol gradient; elution rate 1 ml/min. (B) HPLC of peak 1 from A above: C4 column; 25–45%, 57 min, 1-propanol gradient; elution rate 1 ml/min. (C) Slow HPLC of crude PSM: C4 column; 28–48%, 57 min, 1-propanol gradient; elution rate 1 ml/min.
Figure 5
Figure 5
Effect of LPS, LTA, PSM, PSM peak 1, and PSM peak 2 on cytokine production by THP-1 cells and human monocytes. With THP-1 cells, the reaction mixture contained 2 × 10⁶ THP-1 cells, and where indicated 100 ng/ml LPS, LTA, PSM, PSM peak 1, or PSM peak 2 in RPMI at a final volume of 2.0 ml. With monocytes, 100 ng/ml LPS, LTA, PSM, PSM peak 1, or PSM peak 2 were added to a monolayer of 5 × 10⁵ monocytes in 1.0 ml of RPMI. TNF-α, IL-1β, and IL-6 levels were determined as described in Materials and Methods. The results are the mean ± SEM of four to six experiments. The asterisk and plus sign indicate a significant difference from no stimulant (none) by the unpaired and paired Mann-Whitney U tests, respectively.
Figure 6
Figure 6
Dose response of PSM, LPS, and LTA on TNF-α production by human blood monocytes. We added PSM, LPS, and LTA at the concentrations indicated, and RPMI at a final volume of 1.0 ml, to monolayers containing 5 × 10⁵ monocytes. After incubation for 6 h, the supernatant fluid was removed for the determination of TNF-α levels. The results are the mean ± SEM of three to eight experiments. The asterisk indicates a significant difference from background (P < 0.05).
Figure 7
Figure 7
Activation of NF-κB in THP-1 cells by PSM. The lanes from left to right are: 1, probe alone; 2, nuclear extract from untreated THP-1 cells; 3, nuclear extract from PSM-treated THP-1 cells alone; 4, nuclear extract from PSM-treated THP-1 cells with anti-p65 antibody; 5, nuclear extract from PSM-treated THP-1 cells with anti-p50 antibody; 6, nuclear extract from PSM-treated THP-1 cells with anti–c-Rel antibody; 7, nuclear extract from PSM-treated THP-1 cells with 10× cold probe; 8, nuclear extract from peak 1–treated THP-1 cells; and 9, nuclear extract from peak 2–treated THP-1 cells.
Figure 8
Figure 8
PSMα. (A) The complete amino acid and genomic squence with 100 flanking bases is shown. (B) Alignment of PSMα and delta toxin (PSMγ). Identical residues are designated as dots, and each polypeptide has a single gap to facilitate alignment.
Figure 9
Figure 9
PSMβ. (A) The complete amino acid and gene sequence for both copies is shown along with the intergenic sequence and 100 bases of flanking sequence. The deduced amino acid sequence is the same for the two genes and there is a high degree of homology in the genetic sequence 30 bases upstream of each copy. (B) Homology between PSMβ and S. hemolyticus antigonococcal proteins 1, 2, and 3 and S. lugdunensis SLUSH proteins A, B, and C.
Figure 10
Figure 10
PSMγ. The complete amino acid and genomic sequence with 100 flanking bases is shown. Base differences from the published sequence (24) are underlined.

References

    1. Henderson B, Wilson M. Modulins: a new class of cytokine-inducing, pro-inflammatory bacterial virulence factor. Inflamm Res. 1995;44:187–197. - PubMed
    1. Henderson B, Poole S, Wilson M. Bacterial modulins: a novel class of virulence factors which cause host tissue pathology by inducing cytokine synthesis. Microbiol Rev. 1996;60:316–341. - PMC - PubMed
    1. Klebanoff SJ, Kazazi F, Van Voorhis WC, Schlechte KG. Activation of the human immunodeficiency virus long terminal repeat in THP-1 cells by a staphylococcal extracellular product. Proc Natl Acad Sci USA. 1994;91:10615–10619. - PMC - PubMed
    1. Baeuerle PA, Henkel T. Function and activation of NF-κB in the immune system. Annu Rev Immunol. 1994;12:141–179. - PubMed
    1. Siebenlist U, Franzoso G, Brown K. Structure, regulation and function of NF-κB. Annu Rev Cell Biol. 1994;10:405–455. - PubMed

Publication types