. 1999 Mar 16;96(6):2952-7.
doi: 10.1073/pnas.96.6.2952.

Mitotic recombination map of 13cen-13q14 derived from an investigation of loss of heterozygosity in retinoblastomas

Affiliations

Mitotic recombination map of 13cen-13q14 derived from an investigation of loss of heterozygosity in retinoblastomas

S A Hagstrom et al. Proc Natl Acad Sci U S A. .

Abstract

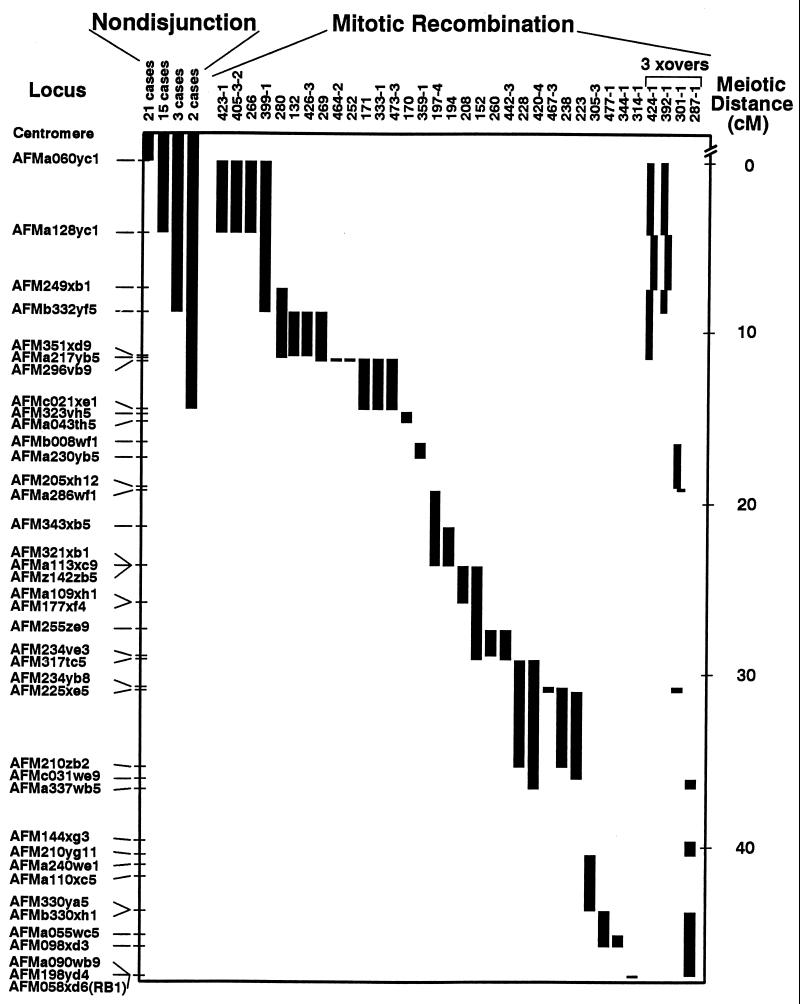
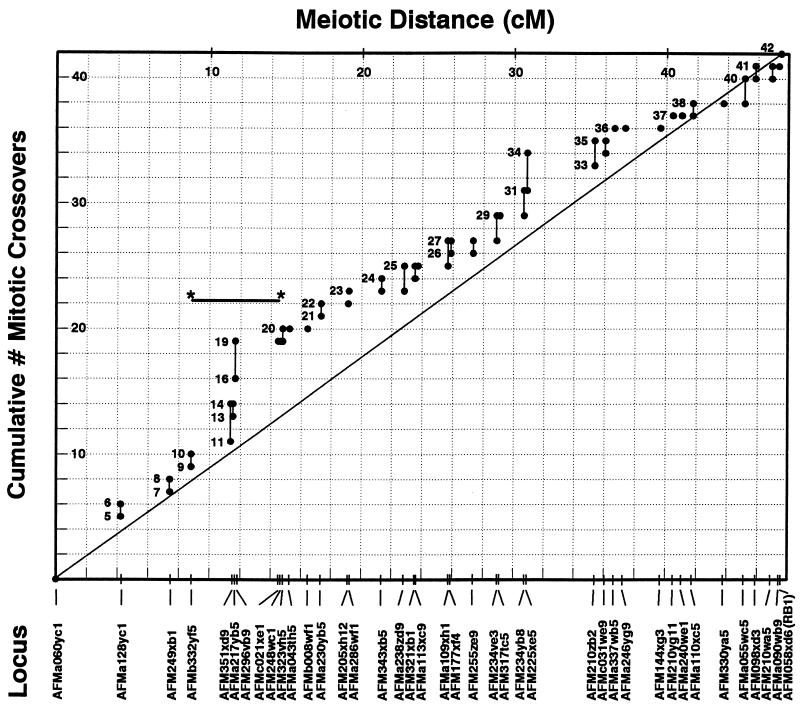
Loss of heterozygosity at tumor-suppressor loci is an important oncogenic mechanism first discovered in retinoblastomas. We explored this phenomenon by examining a set of matched retinoblastoma and leukocyte DNA samples from 158 patients informative for DNA polymorphisms. Loss of heterozygosity at the retinoblastoma locus (13q14) was observed in 101 cases, comprising 7 cases with a somatic deletion causing hemizygosity and 94 with homozygosity (isodisomy). Homozygosity was approximately equally frequent in tumors from male and female patients, among patients with a germ-line vs. somatic initial mutation, and among patients in whom the initial mutation occurred on the maternal vs. paternal allele. A set of 75 tumors exhibiting homozygosity was investigated with markers distributed in the interval 13cen-13q14. Forty-one tumors developed homozygosity at all informative marker loci, suggesting that homozygosity occurred through chromosomal nondisjunction. The remaining cases exhibited mitotic recombination. There was no statistically significant bias in apparent nondisjunction vs. mitotic recombination among male vs. female patients or among patients with germ-line vs. somatic initial mutations. We compared the positions of somatic recombination events in the analyzed interval with a previously reported meiotic recombination map. Although mitotic crossovers occurred throughout the assayed interval, they were more likely to occur proximally than a comparable number of meiotic crossovers. Finally, we observed four triple-crossover cases, suggesting negative interference for mitotic recombination, the opposite of what is usually observed for meiotic recombination.


Figures

Figure 1
Figure 1
Summary of the data derived from the analysis, by using markers in the interval 13cen–q14, of 75 retinoblastomas that exhibited isodisomy at RB1. In the recombination cases, the ends of each black box denote the locations of the informative markers that serve to delimit the region within which a mitotic crossover occurred. In cases with a single crossover, informative markers proximal to the box maintained heterozygosity in the corresponding tumor, whereas informative markers distal to the box were homozygous in tumors. In the triple-crossover cases, the three boxes indicate the three intervals within which crossovers occurred. In the 41 nondisjunction cases, the proximal ends of the boxes extend to the centromere because the most proximal markers were uninformative. The nondisjunction cases are split into four separate groups of between two and 21 cases each (labeled at the top of the figure) defined by the location of the first informative marker at the distal ends of the boxes. For all cases, markers within the boxed intervals were tested and were uninformative. The laboratory identification numbers for the recombination cases are at the top. At the left are the marker names spaced according to the intermarker meiotic recombination distance (18).
Figure 2
Figure 2
Cumulative number of mitotic crossovers detected in the recombination cases in the interval AFMa060yc1 to RB1 as a function of meiotic recombination distance. The data are derived from 42 recombination events detected in the 34 recombination cases (30 with a single detected crossover event and four with three crossovers each). Marker names are spaced along the x axis according to published meiotic recombination distances. The solid diagonal line indicates the expected results if the relative propensities of defined chromosomal regions for mitotic recombination match those for meiotic recombination. Data for each marker are displayed as a range because of uncertainty arising from uninformative markers. The lower boundary of each range is the minimum number of crossovers that definitely occurred between the most proximal marker (AFMz060yc1) and that locus, and the upper boundary is the maximum cumulative number of crossovers that might have occurred. The region exhibiting a cluster of crossovers discussed in Results (between markers AFMb332yf5 and AFMc021xe1) is denoted with a horizontal line with asterisks. Two pairs of markers (AFM205xh12 and AFMa286wf1, and AFM234yb8 and AFM225xe5) that previously were assigned to the same genetic location were ordered in this analysis by observing an informative mitotic recombination event.

References

    1. Godbout R, Dryja T P, Squire J, Gallie B L, Phillips R A. Nature (London) 1983;304:451–453. - PubMed
    1. Cavenee W K, Dryja T P, Phillips R A, Benedict W F, Godbout R, Gallie B L, Murphree A L, Strong L C, White R L. Nature (London) 1983;305:779–784. - PubMed
    1. Dryja T P, Cavenee W, White R, Rapaport J M, Petersen R A, Albert D M, Bruns G A P. N Engl J Med. 1984;310:550–553. - PubMed
    1. Lasko D, Cavenee W. Annu Rev Genet. 1991;25:281–314. - PubMed
    1. Morley A A, Grist S A, Turner D R, Kutlaca A, Bennett G. Cancer Res. 1990;50:4584–4587. - PubMed

Publication types

LinkOut - more resources