. 1999 Mar 16;96(6):3228-33.
doi: 10.1073/pnas.96.6.3228.

Plaque-independent disruption of neural circuits in Alzheimer's disease mouse models

Affiliations

Plaque-independent disruption of neural circuits in Alzheimer's disease mouse models

A Y Hsia et al. Proc Natl Acad Sci U S A. .

Abstract

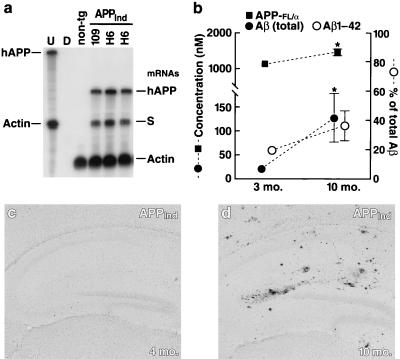
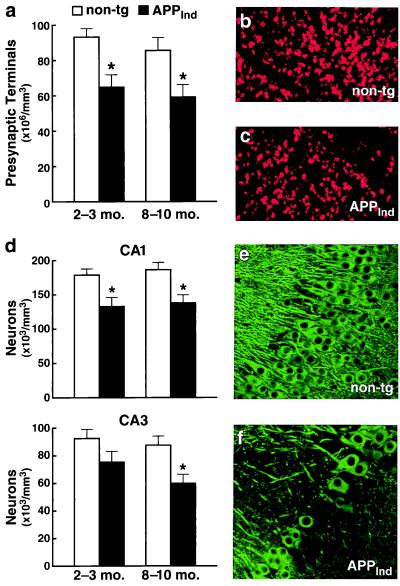
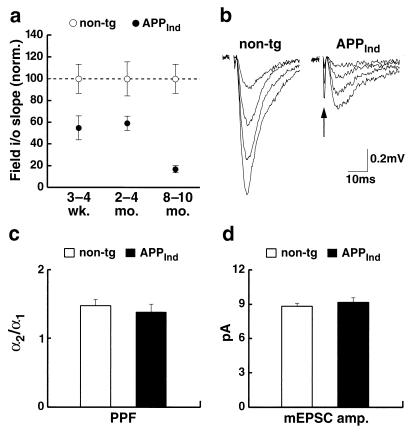
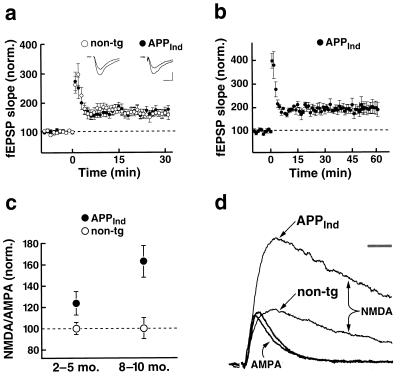
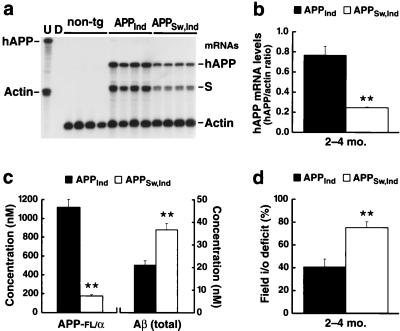
Autosomal dominant forms of familial Alzheimer's disease (FAD) are associated with increased production of the amyloid beta peptide, Abeta42, which is derived from the amyloid protein precursor (APP). In FAD, as well as in sporadic forms of the illness, Abeta peptides accumulate abnormally in the brain in the form of amyloid plaques. Here, we show that overexpression of FAD(717V-->F)-mutant human APP in neurons of transgenic mice decreases the density of presynaptic terminals and neurons well before these mice develop amyloid plaques. Electrophysiological recordings from the hippocampus revealed prominent deficits in synaptic transmission, which also preceded amyloid deposition by several months. Although in young mice, functional and structural neuronal deficits were of similar magnitude, functional deficits became predominant with advancing age. Increased Abeta production in the context of decreased overall APP expression, achieved by addition of the Swedish FAD mutation to the APP transgene in a second line of mice, further increased synaptic transmission deficits in young APP mice without plaques. These results suggest a neurotoxic effect of Abeta that is independent of plaque formation.


Figures

Figure 1
Figure 1
Expression levels of transgene products and age-related Aβ deposition in brains of APPInd mice. (a) Representative autoradiograph showing comparable hAPP mRNA levels in brains of APPInd mice from line 109 and line H6. non-tg, nontransgenic control. Entire hemibrains were analyzed by RPA to determine steady-state mRNA levels. The leftmost lane shows signals of undigested (U) radiolabeled riboprobes (identified on left); the other lanes contained the same riboprobes plus either tRNA (D; no specific hybridization) or brain RNA samples, digested with RNases. Protected mRNAs are indicated on the right. The hAPP probe detects human but not mouse APP; it also recognizes a SV40 segment of transgene-derived mRNAs (labeled “S”). (b) Hippocampal levels of the following human antigens were quantitated by ELISAs in 3-month-old and in 10-month-old transgenic mice from line H6 (n = 7–8 per age group): full-length hAPP plus secreted hAPP cleaved at the α-secretase site (APP-FL/α), total Aβ, and Aβ1–42. ∗, P < 0.05. For several of the data points, the small error bars are hidden by the symbols. An additional 10-month-old transgenic mouse showed exceptionally high Aβ levels (APP-FL/α, 1,642 nM; total Aβ, 8,398 nM; Aβ1–42, 6824 nM); this outlier was excluded from the statistical analysis. (c) Hippocampus of a 4-month-old APPInd mouse (line H6). No Aβ deposits were detected by 3D6 immunostaining. (d) Hippocampus of a 10-month-old APPInd mouse (line H6) displaying multiple 3D6-positive Aβ deposits.
Figure 2
Figure 2
Decreased density of presynaptic terminals and neurons in the hippocampus of APPInd mice (line H6). Vibratome sections of transgenic and nontransgenic brains were labeled with antibodies against a marker of presynaptic terminals (synaptophysin) (ac) or a marker of neuronal cell bodies and dendrites (microtubule-associated protein 2) (df). (a and d) Quantitative assessment of presynaptic terminals in CA1 (a) and of neurons in CA1 and CA3 (d) (n = 9–11 mice per age range and genotype; ∗, P < 0.05 by Tukey-Kramer post hoc test compared with age-matched nontransgenic controls). (b and c) Representative confocal images of CA1 sections immunostained for synaptophysin. (e and f) Some 8- to 10-month-old transgenic mice showed a prominent loss of neurons in CA3 (f) that was unrelated to the presence or absence of amyloid plaques (data not shown). Such damage never was observed in age-matched nontransgenic littermate controls (e).
Figure 3
Figure 3
Severe impairment in synaptic transmission between hippocampal CA3 and CA1 cells in APPInd mice (line H6). (a) The responsiveness of CA1 cells to increasing afferent fiber stimulation [slope of input–output (i/o) relation; see Materials and Methods] was determined in APPInd mice and nontransgenic controls to assess the strength of basal synaptic transmission. Each data point represents average results obtained in 17–87 slices obtained from 4–15 mice. For each age group, results were normalized to the mean value obtained in nontransgenic mice. Statistically significant differences were identified by Duncan’s test between transgenic and nontransgenic mice (P < 0.05 at 3–4 weeks; P < 0.01 at 2–4 and 8–10 months) and between 2- to 4-month-old and 8- to 10-month-old transgenic mice (P < 0.01). (b) Representative field EPSPs at increasing stimulus strengths are shown for a nontransgenic and an APPInd mouse, illustrating that far higher stimulation strengths are required to elicit synaptic responses in APPInd mice. The fiber volley (arrow) is an indirect measure of the number of axons activated. (c and d) Paired-pulse facilitation (PPF) and quantal size were measured in CA1 cells of 8- to 10-month-old APPInd mice and nontransgenic controls. Each column represents average results from 6–8 hippocampal slices prepared from 2–4 mice. Paired-pulse facilitation was expressed as the ratio (α21) of the average amplitudes of EPSCs evoked by a pair of closely spaced stimuli (c). Quantal size was determined as the mean amplitude of miniature EPSCs (mEPSCs) (d). pA, picoamps.
Figure 4
Figure 4
APPInd mice (line H6) showed normal LTP and an increase in the NMDA/AMPA ratio in CA1 cells. (a) LTP was measured in 8- to 10-month-old APPInd mice (9 slices from 5 mice) and nontransgenic controls (7 slices from 3 mice) at 30 min after induction. Insets show average EPSPs at 5 min before and 50 min after LTP induction in representative experiments from an 8-month-old APPInd mouse and an age-matched nontransgenic control. Scale: 0.2 mV (nontransgenic), 0.1 mV (APPInd); 10 ms. fEPSP = field EPSP. (b) In a subset of these APPInd mice (n = 3), LTP was monitored until 1 h after induction. (c) The ratio of amplitudes of NMDA receptor-mediated to AMPA receptor-mediated EPSCs in individual CA1 cells was determined. For each age group, results were normalized to the mean value obtained in nontransgenic mice. Each data point represents data from 12–27 slices from 3–9 mice. At all ages analyzed, APPInd mice showed an increase in the mean NMDA/AMPA ratio compared with nontransgenic controls (P < 0.01). There was an age-related increase in NMDA/AMPA ratios in transgenic (P < 0.01) but not in nontransgenic mice. P values were determined by Duncan’s test. (d) Example EPSCs recorded in two representative CA1 cells from a 9-month-old APPInd mouse and an age-matched nontransgenic control. EPSCs were scaled such that the AMPA receptor-mediated EPSCs from each cell are of equal amplitude. (Bar = 20 ms.)
Figure 5
Figure 5
Increased Aβ levels exacerbate synaptic transmission deficits in the context of lower APP expression. (a) Autoradiograph depicting an RPA analysis of cerebral hAPP levels in APPInd (line H6) and APPSw, Ind (line J9) mice (n = 4 mice/line; age, 2–4 months). The APP probe used detects human but not mouse APP; it also recognizes an SV40 segment of transgene-derived mRNAs (S). Conventions otherwise as in Fig. 1a. (b) The signals shown in a were quantified by phosphorimager analysis and were expressed as hAPP to actin ratios to correct for variations in RNA content/loading. ∗∗, P < 0.01. (c) Hippocampal levels of human APP-FL/α and total Aβ were determined by ELISAs in APPInd (line H6) and APPSw, Ind (line J9) mice (n = 8 mice/line; age, 2–4 months). ∗∗, P < 0.001. Note that the hAPP-FL/α ELISA does not detect β-secreted hAPP. This may explain why hAPP expression levels in APPSw, Ind mice were lower by ELISA than by RPA analysis. (d) Comparison of deficits in field input–output relations in 2- to 4-month-old APPInd (line H6) and APPSw, Ind (line J9) mice. For each line, results were expressed as the percent deficit relative to the mean value obtained in nontransgenic controls. The APPInd analysis shown here was based on the same raw data as the analysis of 2- to 4-month-old APPInd mice included in Fig. 3a. These data were compared with results obtained in 18 slices prepared from three age-matched APPSw, Ind mice.

References

    1. Checler F. J Neurochem. 1995;65:1431–1444. - PubMed
    1. Wang R, Sweeney D, Gandy S E, Sisodia S S. J Biol Chem. 1996;271:31894–31902. - PubMed
    1. Harper J D, Lansbury P T., Jr Annu Rev Biochem. 1997;66:385–407. - PubMed
    1. Lee S J, Liyanage U, Bickel P E, Xia W M, Lansbury P T, Jr, Kosik K S. Nat Med. 1998;4:730–734. - PubMed
    1. Lendon C L, Ashall F, Goate A M. J Am Med Assoc. 1997;277:825–831. - PubMed

Publication types

Substances