. 1999 Mar 16;96(6):3257-62.
doi: 10.1073/pnas.96.6.3257.

Measures of degeneracy and redundancy in biological networks

Affiliations

Measures of degeneracy and redundancy in biological networks

G Tononi et al. Proc Natl Acad Sci U S A. .

Abstract

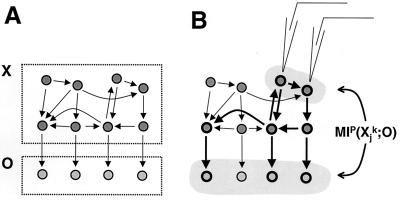
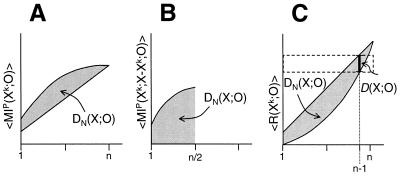
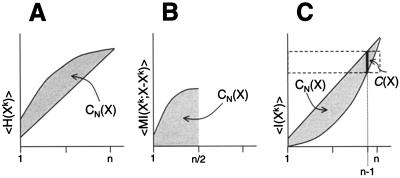
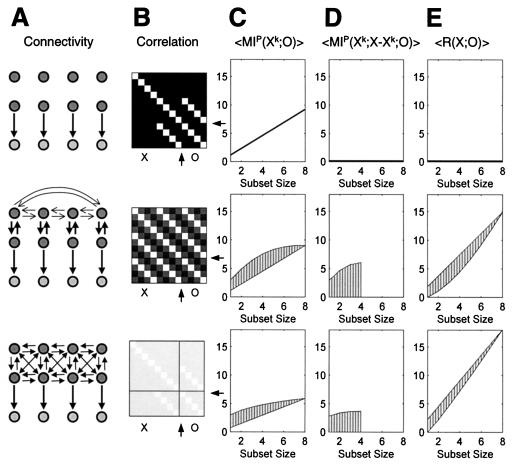
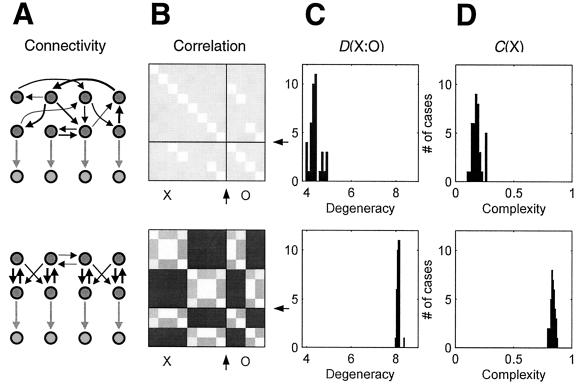
Degeneracy, the ability of elements that are structurally different to perform the same function, is a prominent property of many biological systems ranging from genes to neural networks to evolution itself. Because structurally different elements may produce different outputs in different contexts, degeneracy should be distinguished from redundancy, which occurs when the same function is performed by identical elements. However, because of ambiguities in the distinction between structure and function and because of the lack of a theoretical treatment, these two notions often are conflated. By using information theoretical concepts, we develop here functional measures of the degeneracy and redundancy of a system with respect to a set of outputs. These measures help to distinguish the concept of degeneracy from that of redundancy and make it operationally useful. Through computer simulations of neural systems differing in connectivity, we show that degeneracy is low both for systems in which each element affects the output independently and for redundant systems in which many elements can affect the output in a similar way but do not have independent effects. By contrast, degeneracy is high for systems in which many different elements can affect the output in a similar way and at the same time can have independent effects. We demonstrate that networks that have been selected for degeneracy have high values of complexity, a measure of the average mutual information between the subsets of a system. These measures promise to be useful in characterizing and understanding the functional robustness and adaptability of biological networks.


Figures

Figure 1
Figure 1
Schematic diagram illustrating bases for the proposed measure of degeneracy. (A) We consider a system X, composed of individual elements (gray circles, n = 8) that are interconnected (arrows) among each other [with a connection matrix CON(X)] and that also have connections to a set of output units O [with a connection matrix CON(X;O)]. (B) A subset (shaded in gray) of the system X is perturbed by injecting (large Vs at the top) a fixed amount of variance (uncorrelated noise) into each of its constituent units. This perturbation activates numerous connections within the system (thick arrows) and produces changes in the variance of a number of units within X and O. The resulting mutual information under perturbation MIP(Xkj;O) is computed (see Eq. 1). This procedure is repeated for all subsets of sizes 1 ≤ kn of the system X.
Figure 2
Figure 2
Graphical representation of different expressions for degeneracy. (A) Degeneracy expressed in terms of the average mutual information between subsets of X and O under perturbation (see Eq. 2a). (B) Degeneracy expressed in terms of the average mutual information shared between bipartitions of X and O (see Eq. 2b). (C) Degeneracy expressed in terms of the average redundancy (see Eq. 4). A graphical interpretation for the degeneracy D(X;O) (see Eq. 5) is indicated as a dotted rectangular area with height corresponding to that of bar at n − 1.
Figure 3
Figure 3
Graphical representation of different expressions for complexity. Note the homology between these expressions and those illustrated in Fig. 2. (A) Complexity, CN(X), expressed in terms of the average entropy. (B) Complexity expressed in terms of the average mutual information. (C) Complexity expressed in terms of the average integration (see ref. 9). A graphical interpretation for the complexity C(X) is indicated as a dotted rectangular area with height corresponding to that of bar at n − 1.
Figure 4
Figure 4
Results from simulations of three examples of systems of eight units, each connected to an output sheet of four units. The three examples are: a system that lacks all intrinsic connectivity (Top, independent case), a system that is characterized by four modules of two strongly interconnected units that are weakly interconnected among themselves (Middle, degenerate case), and a system whose units are fully interconnected (Bottom, redundant case). (A) Graphs of connections among units of the system and among system units and the output. Arrow width indicates connection strengths (not all connections shown). (B) Correlation matrices, displaying correlations intrinsic to X, intrinsic to O, as well as cross-correlations between X and O. The two arrows demarcate the output portion of the correlation matrix. (C) Distribution of the average mutual information between subsets of X and O over all subset sizes (see Eq. 2a). (D) Distribution of the average mutual information shared between bipartitions of X and O (see Eq. 2b). (E) Distribution of the average redundancy over all subset sizes (see Eq. 4). Degeneracy is indicated in CE as a shaded area (compare Fig. 2). Expressions for the ordinates of graphs in CE are at the top of each column.
Figure 5
Figure 5
Typical results obtained from simulations of 40 systems of eight units connected to an output sheet of four units; during optimization the system’s connectivity was modified by gradient ascent to increase degeneracy D(X;O) (Eq. 5) with respect to a fixed output pattern. This output was given as a correlation matrix of the units of the output sheet. In the results shown, the output consisted of a high cross-correlation (0.75) among pairs of two units of the output and a low cross-correlation (0.25) between them. (Top) Data obtained from one example of a randomly connected system before the beginning of the runs. (Bottom) Data from one example obtained after gradient ascent resulted in a stable value for degeneracy. (A) Schematic representations of graphs showing the interconnections between units of the system and the output. (B) Correlation matrices (conventions as in Fig. 4B). (C) Distribution of values for degeneracy D(X;O) (see Eq. 5) for 40 randomly chosen (Top) and optimized (Bottom) systems. (D) Distribution of values for complexity C(X) for the corresponding systems.

References

    1. Edelman G M. In: The Mindful Brain. Edelman G M, Mountcastle V B, editors. Cambridge, MA: MIT Press; 1978. pp. 51–100.
    1. Edelman G M. Neural Darwinism: The Theory of Neuronal Group Selection. New York: Basic Books; 1987. - PubMed
    1. Edelman G M, editor. Cellular Selection and Regulation in the Immune Response. New York: Raven; 1974. pp. 1–37.
    1. Kolb B, Whishaw I Q. Fundamentals of Human Neuropsychology. New York: Freeman; 1996.
    1. Tononi G, Sporns O, Edelman G M. Proc Natl Acad Sci USA. 1994;91:5033–5037. - PMC - PubMed

Publication types

LinkOut - more resources