. 1999 Mar 16;96(6):3269-74.
doi: 10.1073/pnas.96.6.3269.

Ca2+/calmodulin-kinase II enhances channel conductance of alpha-amino-3-hydroxy-5-methyl-4-isoxazolepropionate type glutamate receptors

Affiliations

Ca2+/calmodulin-kinase II enhances channel conductance of alpha-amino-3-hydroxy-5-methyl-4-isoxazolepropionate type glutamate receptors

V Derkach et al. Proc Natl Acad Sci U S A. .

Abstract

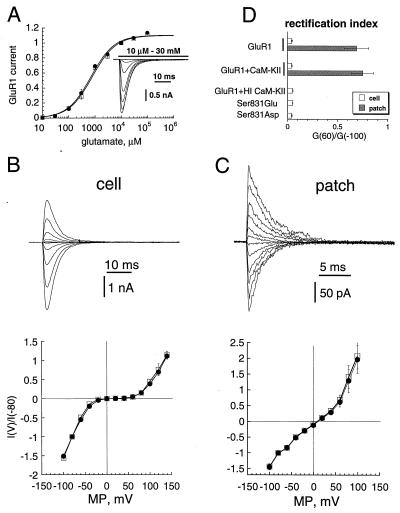
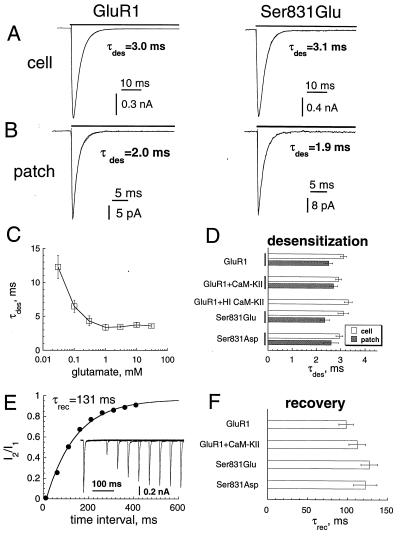
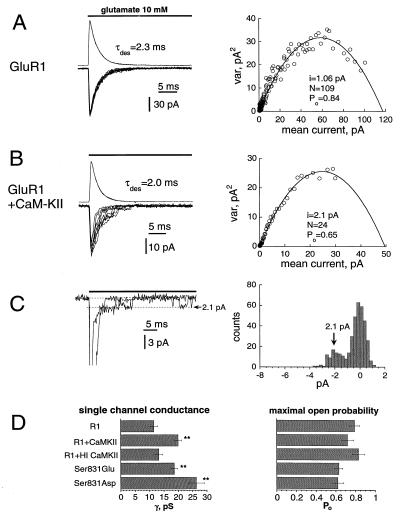
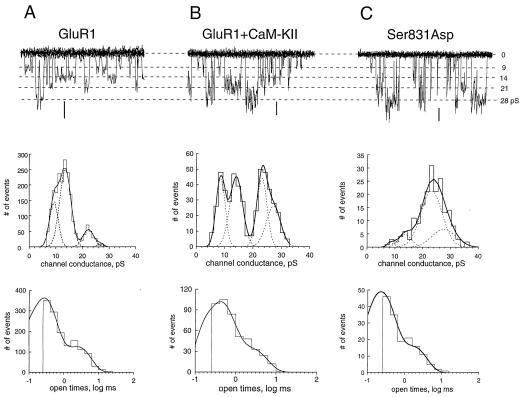
The ability of central glutamatergic synapses to change their strength in response to the intensity of synaptic input, which occurs, for example, in long-term potentiation (LTP), is thought to provide a cellular basis for memory formation and learning. LTP in the CA1 field of the hippocampus requires activation of Ca2+/calmodulin-kinase II (CaM-KII), which phosphorylates Ser-831 in the GluR1 subunit of the alpha-amino-3-hydroxy-5-methyl-4-isoxazolepropionate glutamate receptor (AMPA-R), and this activation/phosphorylation is thought to be a postsynaptic mechanism in LTP. In this study, we have identified a molecular mechanism by which CaM-KII potentiates AMPA-Rs. Coexpression in HEK-293 cells of activated CaM-KII with GluR1 did not affect the glutamate affinity of the receptor, the kinetics of desensitization and recovery, channel rectification, open probability, or gating. Single-channel recordings identified multiple conductance states for GluR1, and coexpression with CaM-KII or a mutation of Ser-831 to Asp increased the contribution of the higher conductance states. These results indicate that CaM-KII can mediate plasticity at glutamatergic synapses by increasing single-channel conductance of existing functional AMPA-Rs or by recruiting new high-conductance-state AMPA-Rs.


Figures

Figure 1
Figure 1
Effect of CaM-KII on affinity and voltage-dependence of GluR1. (A) Dose–response curves for GluR1 with (squares; n = 4) and without (circles; n = 4) coexpressed CaM-KII. Currents were normalized to those evoked by 10 mM glutamate. (Insert) Whole-cell currents elicited at −80 mV by 10 μM to 30 mM glutamate for GluR1 expressed alone. (B and C Upper) Whole-cell (B) and outside-out patch (C) currents for GluR1 alone elicited by 100-ms pulses of 10 mM glutamate at membrane potentials from −100 mV to 120 mV (20-mV steps). (B and C Lower) Voltage-dependence of whole-cell (B) and outside-out patch (C) currents for GluR1 alone (circles) or for GluR1 coexpressed with CaM-KII (squares). (D) Rectification index for whole-cell (open bars) and outside-out patch (gray bars) currents for GluR1 expressed alone, for GluR1 coexpressed with CaM-KII, for GluR1 with HI CaM-KII infused in the patch pipette, and for Ser-831-to-Glu and Ser-831-to-Asp mutants.
Figure 2
Figure 2
Effect of CaM-KII on the desensitization of GluR1. (A and B) Whole-cell (A) and outside-out patch (B) currents elicited by 10 mM glutamate at −80 mV in cells expressing GluR1 alone (Left) or the Ser-831-to-Glu mutant (Right). The currents were fitted by the sum of two exponentials for the rise and decay shown by the thin line. (C) τdes as a function of glutamate concentration for the whole-cell currents (n = 4). (D) τdes for whole-cell (open bars) and outside-out (gray bars) currents for GluR1 expressed alone, for GluR1 coexpressed with CaM-KII, for GluR1 with HI CaM-KII in the patch pipette, and for Ser-831-to-Glu and Ser-831-to-Asp mutants. (E) Time course of recovery from desensitization measured as the amplitude ratio of the second current to the first in pairs of glutamate applications. Points were fitted by exponential (solid line) with the time constant τrec. (Insert) Currents elicited by paired applications of 10 mM glutamate (20-ms pulses) with time intervals 10–1,000 ms after the end of the first application. (F) τrec for cells with GluR1 alone, for cells with GluR1 and CaM-KII, and for Ser-831-to-Glu and Ser-831-to-Asp mutants.
Figure 3
Figure 3
CaM-KII increased channel conductance. (A and B Left) Nine currents (downward) elicited by repetitive applications of 10 mM glutamate (70-ms pulses; 4-s time intervals) in outside-out patches when GluR1 was expressed alone (A, −90 mV) or with activated CaM-KII in the patch pipette (B, −100 mV). The outward currents shown are mean currents for 37 trials (A) and 83 trials (B). (A and B Right) The variance of the current fluctuations as a function of the mean currents shown in A and B Left. Solid lines are fitting curves with the indicated parameters. (C Left) Two current traces from the patch shown in B, when single-channel currents were resolved on the tails of macroscopic currents. (C Right) All-point histogram for traces shown in C Left, taken after the decay of macroscopic current. The arrow indicates the value of single-channel current (2.1 pA), determined by the variance analyses. (D) Channel conductance (Left) and Po (Right), determined by variance analyses when the GluR1 receptor was expressed alone (R1), when the GluR1 receptor was coexpressed with CaM-KII (R1+CamKII), with HI CaM-KII in the patch pipette (R1+HI CaMKII), and of the mutants Ser-831 to Glu and Ser-831 to Asp. ∗∗, P < 0.01.
Figure 4
Figure 4
CaM-KII increased the contribution of high-conductance states in single-channel activity. Single-channel recordings (Top), distribution of channel conductances (Middle), and channel openings (Bottom) were obtained from cells expressing GluR1 alone (A), from cells expressing GluR1 coexpressed with CaM-KII (B), or from the Ser-831-to-Asp mutant (C). For single-channel recordings, eight traces every 100 ms were superimposed, recorded at membrane potentials of −101 mV (A), −128 mV (B), and −125 mV (C). For comparison, currents in A–C were scaled by conductance and show the same four conductance states in all situations. Note the different scales for the same calibration of 1 pA in A–C. Each conductance histogram was fitted by the sum of four Gaussian functions (smooth curves), which are shown individually by dotted lines. Their mean values were, for A, 9.3 pS (contribution of 26.8%), 13.5 pS (56.8%), 22.2 pS (12.4%), and 27.3 pS (4%); for B, 8.6 pS (23.7%), 14.1 pS (30.3%), 23.1 pS (24%), and 27.1 (22%); and, for C, 9.6 pS (0.8%), 13.1 pS (13.7%), 21.3 pS (57.5%), and 26.1 pS (28%). Calculated weighted single-channel conductances were 13.8 pS (A), 17.9 pS (B), and 21.4 pS (C). Each distribution of open times was fitted by the sum of two exponentials with time constants of 0.24 ms (contribution of 73%) and 2.4 ms (A), 0.36 ms (71%) and 2.4 ms (B), and 0.29 ms (52%) and 2.5 ms (C).

References

    1. Bliss T V P, Collingridge G L. Nature (London) 1993;361:31–39. - PubMed
    1. Nicoll R A, Malenka R. Nature (London) 1995;377:115–118. - PubMed
    1. Fukunaga K, Stoppini L, Miyamoto E, Muller D. J Biol Chem. 1993;268:7863–7867. - PubMed
    1. Fukunaga K, Muller D, Miyamoto E. J Biol Chem. 1995;270:6119–6124. - PubMed
    1. Giese K P, Fedorov N B, Filipkowski R K, Silva A J. Science. 1998;279:870–873. - PubMed

Publication types

MeSH terms

Substances

LinkOut - more resources