. 1999 Mar 16;96(6):3281-6.
doi: 10.1073/pnas.96.6.3281.

Insulin increases near-membrane but not global Ca2+ in isolated skeletal muscle

Affiliations

Insulin increases near-membrane but not global Ca2+ in isolated skeletal muscle

J D Bruton et al. Proc Natl Acad Sci U S A. .

Abstract

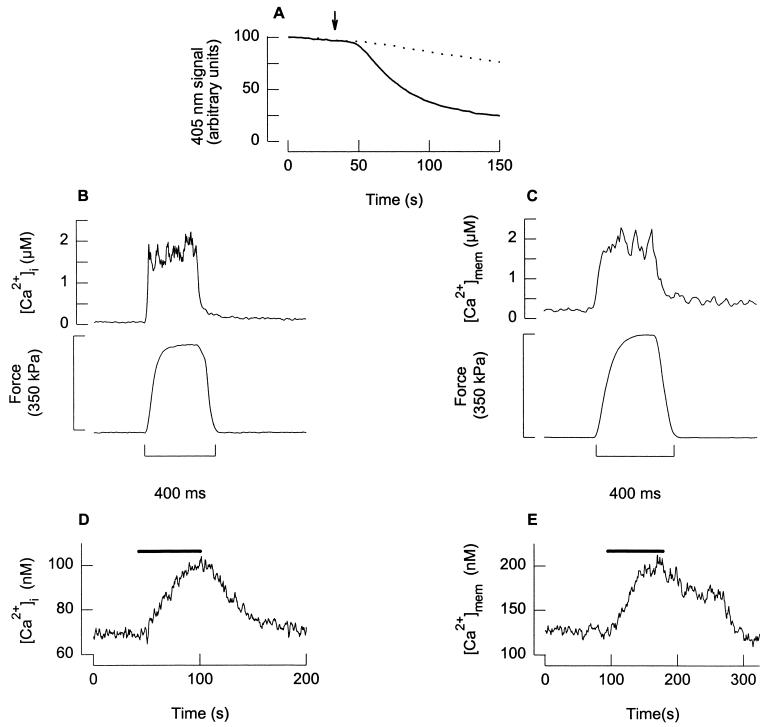
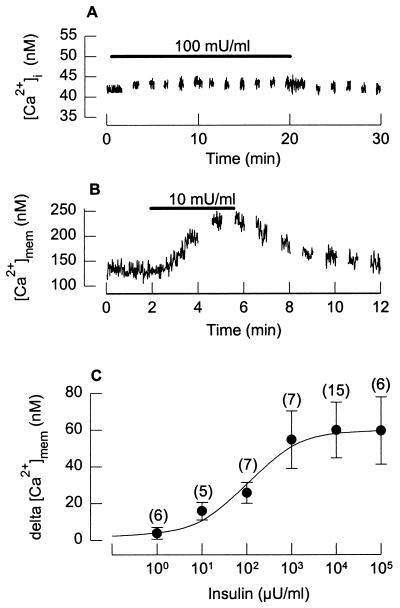
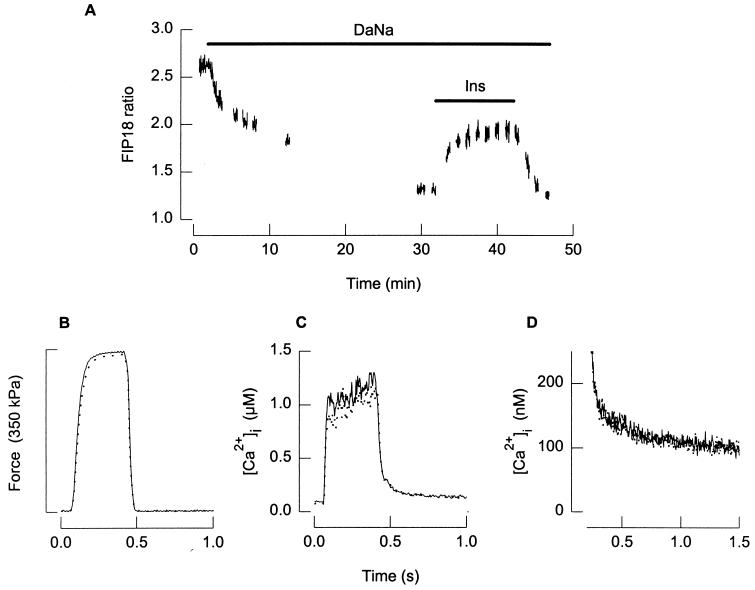
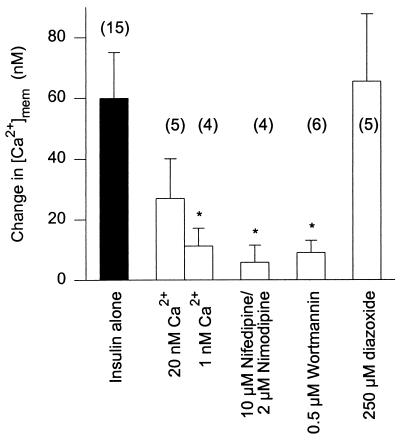
It has long been debated whether changes in Ca2+ are involved in insulin-stimulated glucose uptake in skeletal muscle. We have now investigated the effect of insulin on the global free myoplasmic Ca2+ concentration and the near-membrane free Ca2+ concentration ([Ca2+]mem) in intact, single skeletal muscle fibers from mice by using fluorescent Ca2+ indicators. Insulin has no effect on the global free myoplasmic Ca2+ concentration. However, insulin increases [Ca2+]mem by approximately 70% and the half-maximal increase in [Ca2+]mem occurs at an insulin concentration of 110 microunits per ml. The increase in [Ca2+]mem by insulin persists when sarcoplasmic reticulum Ca2+ release is inhibited but is lost by perfusing the fiber with a low Ca2+ medium or by addition of L-type Ca2+ channel inhibitors. Thus, insulin appears to stimulate Ca2+ entry into muscle cells via L-type Ca2+ channels. Wortmannin, which inhibits insulin-mediated activation of glucose transport in isolated skeletal muscle, also inhibits the insulin-mediated increase in [Ca2+]mem. These data demonstrate a new facet of insulin signaling and indicate that insulin-mediated increases in [Ca2+]mem in skeletal muscle may underlie important actions of the hormone.


Figures

Figure 1
Figure 1
Typical examples of the response of individual skeletal muscle fibers to exposure to Ni2+ or to electrical stimulation or caffeine. (A) FIP18 signal (405 nm of emitted light) before and during exposure to Ni2+ in an intact fiber (dotted line) or after a hole was created in its membrane, resulting in the interior of the fiber being exposed to the bathing solution (solid line); the arrow indicates the start of Ni2+ exposure. (B) Global [Ca2+]i (measured with Indo-1) and the resultant force during an electrically induced tetanus. (C) [Ca2+]mem (measured with FIP18) and the resultant force during an electrically induced tetanus. (D) Change in global [Ca2+]i (measured with Indo-1) when 5 mM caffeine was applied. (E) Change in [Ca2+]mem (measured with FIP18) when 5 mM caffeine was applied. Solid bars above records in D and E indicate the period of caffeine exposure.
Figure 2
Figure 2
Insulin increases calcium only near the membrane. (A) Global [Ca2+]i (measured with Indo-1) shows little change when insulin is applied (indicated by solid bar). (B) [Ca2+]mem (measured with FIP18) increases when insulin is applied (shown by solid bar). Gaps in records A and B are when light was switched off to avoid bleaching of the dye. (C) Insulin dose–effect curve showing the increase in near-membrane calcium when increasing concentrations of insulin were applied. Values are means ± SEM, and the number of fibers is indicated for each point. The curve was drawn by fitting a sigmoidal function to the data points.
Figure 3
Figure 3
The source of the insulin-stimulated increase in near-membrane calcium is not the SR. (A) Dantrolene sodium causes a reduction in the FIP18 ratio but does not block the insulin-stimulated increase in the FIP18 ratio. The solid bars indicate application of 50 μM dantrolene sodium (DaNa) or 10 milliunits/ml insulin (Ins). Gaps in record A are when light was switched off to avoid bleaching of the dye. Insulin (10 milliunits/ml) had little effect on tetanic force (B), tetanic [Ca2+]i (C; measured with Indo-1), or the tail of [Ca2+]i after the tetanus (D). The solid lines in B–D indicate records obtained in control solution, and dotted lines indicate records after 15 min of exposure to 10 milliunits/ml insulin.
Figure 4
Figure 4
The effect of decreasing extracellular Ca2+, the addition of L-type Ca2+ channel blockers, diazoxide, or wortmannin on the insulin-stimulated increase in [Ca2+]mem. Insulin was present in all experiments at 10 milliunits/ml. Unless noted otherwise, extracellular calcium was 1.8 mM. Values are means ± SEM, and the number of observations is shown in parentheses. An asterisk indicates when the response was significantly smaller (P < 0.05) than the response to insulin alone.

References

    1. Borkman M, Storlein L H, Pan D A, Jenkins A B, Chisholm D J, Campbell L V. N Engl J Med. 1993;328:238–244. - PubMed
    1. DeFronzo R A, Gunnarsson R, Björkman O, Olsson M, Wahren J. J Clin Invest. 1985;76:149–155. - PMC - PubMed
    1. Saltiel A R. Am J Physiol. 1996;270:E375–E385. - PubMed
    1. Villar-Palasi C, Guinovart J J. FASEB J. 1997;11:544–558. - PubMed
    1. Draznin B, Reusch J E-B. In: Diabetes Mellitus. Leroith D, Taylor S I, Olefsky J M, editors. Philadelphia: Lippincott-Raven; 1996. pp. 227–234.

Publication types