. 1999 Mar;103(6):897-905.
doi: 10.1172/JCI4829.

Hypercholesterolemia decreases nitric oxide production by promoting the interaction of caveolin and endothelial nitric oxide synthase

Affiliations

Hypercholesterolemia decreases nitric oxide production by promoting the interaction of caveolin and endothelial nitric oxide synthase

O Feron et al. J Clin Invest. 1999 Mar.

Abstract

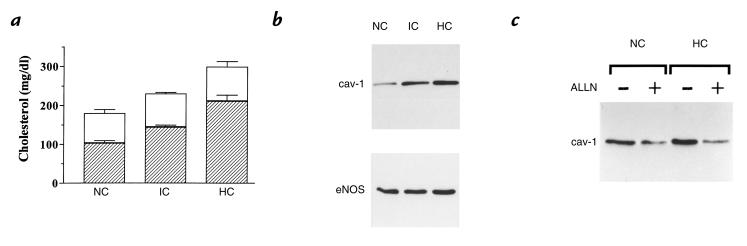
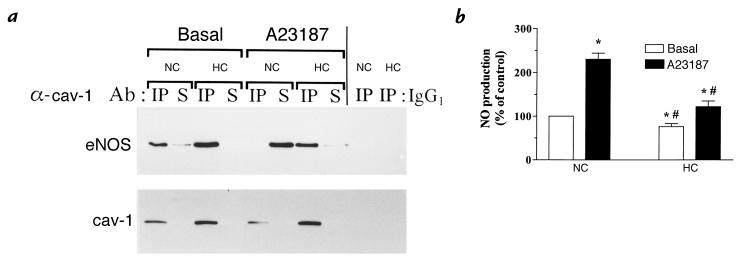
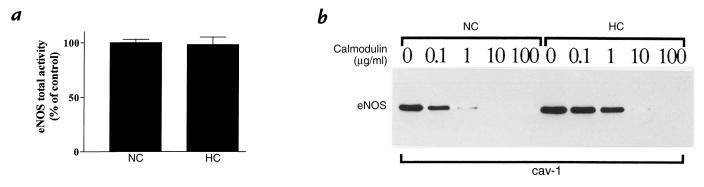
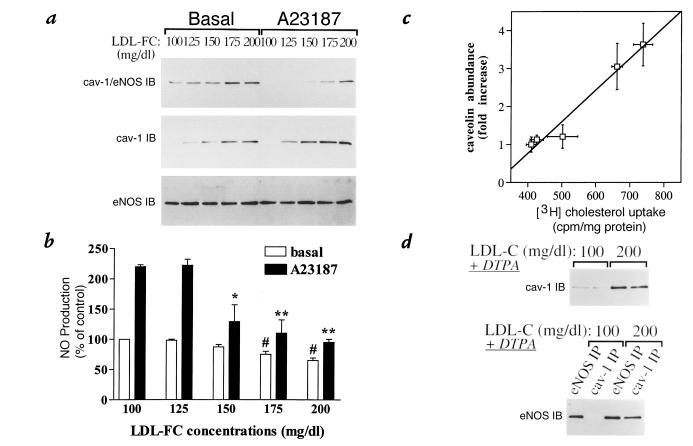
Hypercholesterolemia is a central pathogenic factor of endothelial dysfunction caused in part by an impairment of endothelial nitric oxide (NO) production through mechanisms that remain poorly characterized. The activity of the endothelial isoform of NO synthase (eNOS) was recently shown to be modulated by its reciprocal interactions with the stimulatory Ca2+-calmodulin complex and the inhibitory protein caveolin. We examined whether hypercholesterolemia may reduce NO production through alteration of this regulatory equilibrium. Bovine aortic endothelial cells were cultured in the presence of serum obtained from normocholesterolemic (NC) or hypercholesterolemic (HC) human volunteers. Exposure of endothelial cells to the HC serum upregulated caveolin abundance without any measurable effect on eNOS protein levels. This effect of HC serum was associated with an impairment of basal NO release paralleled by an increase in inhibitory caveolin-eNOS complex formation. Similar treatment with HC serum significantly attenuated the NO production stimulated by the calcium ionophore A23187. Accordingly, higher calmodulin levels were required to disrupt the enhanced caveolin-eNOS heterocomplex from HC serum-treated cells. Finally, cell exposure to the low-density lipoprotein (LDL) fraction alone dose-dependently reproduced the inhibition of basal and stimulated NO release, as well as the upregulation of caveolin expression and its heterocomplex formation with eNOS, which were unaffected by cotreatment with antioxidants. Together, our data establish a new mechanism for the cholesterol-induced impairment of NO production through the modulation of caveolin abundance in endothelial cells, a mechanism that may participate in the pathogenesis of endothelial dysfunction and the proatherogenic effects of hypercholesterolemia.


Figures

Figure 1
Figure 1
Caveolin and eNOS expression in endothelial cells exposed to normocholesterolemic and hypercholesterolemic human serum. (a) Mean (± SEM, n = 10) cholesterol concentrations of human plasma fractions divided into three categories and used in the experiments discussed below. Hatched areas correspond to LDL-C as a fraction of total plasma cholesterol. (b) Caveolin (top) and eNOS (bottom) immunoblots from endothelial cells exposed to the corresponding fractions of human plasma. This experiment was repeated four times with equivalent results. (c) The caveolin immunoblots from endothelial cells exposed to NC or HC serum in the presence or absence of the cysteine protease inhibitor ALLN (25 μM). This experiment was repeated two times with equivalent results. ALLN, N-acetyl-leu-leu-norleucinal; eNOS,endothelial nitric oxide synthase; HC, hypercholesterolemic; IC, intermediate; LDL-C, low-density lipoprotein cholesterol; NC, normocholesterolemic.
Figure 2
Figure 2
High plasma cholesterol levels stabilize the caveolin–eNOS interaction and decrease NO production in endothelial cells. Endothelial cells exposed to normocholesterolemic (NC; 179 ± 10 mg/dl) or hypercholesterolemic (HC; 298 ± 14 mg/dl) human serum were incubated for 5 min in the presence or absence of the calcium ionophore A23187 (5 μM) and either tested for NO production or collected, lysed, and solubilized as described in the text. (a) Cell extracts were immunoprecipitated with anti–caveolin-1 antibody (lanes 18) or irrelevant IgG1 (lanes 910), as indicated. Both the immunoprecipitate and supernatant fractions were then separated on SDS-PAGE and immunoblotted with two different antibodies. Top: Immunoblot with an anti-eNOS antibody of caveolin immunoprecipitates (IP) and of the remaining supernatant (S). Note that to obtain the S fraction, the supernatants from the IP were immunoprecipitated with eNOS antibody in order to detect quantitatively the amount of eNOS left behind the initial caveolin IP. Note also that the sum of eNOS protein detected in the caveolin IP and supernatant is equal for the different conditions. Bottom: Immunoblot with an anti–caveolin-1 antibody of caveolin immunoprecipitates (IP) and of the remaining supernatant fractions (S). Note that to obtain the S fractions, the supernatants from the caveolin IP were again immunoprecipitated with anti–caveolin-1 antibody in order to detect quantitatively the amount of caveolin left behind the initial IP. These experiments were performed three times with similar results. (b) A bar graph (mean ± SEM, n = 9) illustrating the NO production (measured with a microsensor) at the basal level (open bars) and after exposure to A23187 (filled bars) in cultures of endothelial cells treated with NC or HC human serum; the data are expressed as percent of NO production in nonstimulated cells exposed to NC serum. *P < 0.05 vs. basal, NC condition. #P < 0.01 vs. stimulated NC condition. NO, nitric oxide.
Figure 3
Figure 3
Release of eNOS from the caveolin immune complex by Ca2+–CaM. Endothelial cells exposed for 48 h to 50% normocholesterolemic (NC) or hypercholesterolemic (HC) human serum were collected, lysed, and solubilized as described in the text. (a) A bar graph (mean ± SEM, n = 3) illustrating the maximal eNOS enzyme activity, measured by the conversion of [3H]arginine in [3H]citrulline in the corresponding cell extracts immunoprecipitated with anti–caveolin-1 antibody. The data are expressed as percent of total eNOS activity in the immunoprecipitate obtained from cells exposed to NC serum. (b) Immunoblot with an anti-eNOS antibody of the same extracts immunoprecipitated with anti–caveolin-1 antibody and exposed, in presence of Ca2+, to increasing concentrations of exogenous CaM: 0, 0.1, 1, 10, 100 μg/ml. The immune complexes bound to protein G–Sepharose beads were extensively washed in OG buffer, and the beads were then equally distributed in five separate aliquots. After 1 h incubation at 4°C in the presence of the indicated amounts of CaM, the beads were repelleted, the supernatant discarded, and the immune complex processed for SDS-PAGE and immunoblot analysis. These experiments were performed three times with similar results. CaM, calmodulin; OG, octylglucoside.
Figure 4
Figure 4
LDL, but not HDL or VLDL, fractions account for the caveolin-mediated attenuation of NO production in endothelial cells exposed to hypercholesterolemic human serum. Endothelial cells were exposed for 48 h to 50% hypercholesterolemic human serum or to 50% of LPDS supplemented with the indicated isolated lipoprotein fraction (cholesterol content: VLDL, 25 mg/dl; LDL, 210 mg/dl; HDL2, 15 mg/dl; HDL3, 25 mg/dl). After a 5-min incubation in the presence or absence of the calcium ionophore A23187 (5 μM), cells were either tested for NO production or collected, lysed, and solubilized as described in the text. (a) Cells’ extracts were immunoprecipitated with anti–caveolin-1 antibody, and both the immunoprecipitate (IP) and supernatant (S) fractions were then separated on SDS-PAGE and immunoblotted with anti-eNOS antibody. Top: Immunoblot of IP and S fractions from nonstimulated cells. Bottom: Immunoblot of IP and S fractions from cells stimulated with A23187. Note that to obtain the S fractions, the supernatants from the IP were immunoprecipitated with anti-eNOS antibody in order to detect quantitatively the amount of eNOS left behind the initial caveolin IP. (b) Shown is a bar graph (mean ± SEM, n = 3) illustrating the NO production (measured with a microsensor) at the basal level (open bars) and after exposure to A23187 (filled bars) in cultures of endothelial cells exposed to hypercholesterolemic (HC) human serum or to specific lipoprotein fractions as indicated; the data are expressed as percent of NO production in nonstimulated cells exposed to NC serum. *P < 0.05 vs. basal conditions with NC, VLDL, HDL2, and HDL3. #P < 0.01 vs. stimulated conditions with NC, VLDL, HDL2, and HDL3. HDL, high-density lipoprotein; LPDS, lipoprotein-deficient human serum; VLDL, very-low-density lipoprotein.
Figure 5
Figure 5
Dose-dependent increase in caveolin expression and stabilization of the caveolin–eNOS interaction by LDL fractions. Endothelial cells were exposed for 48 h to 50% LPDS with the indicated concentrations of LDL-C. After 5-min incubation in the presence or absence of the calcium ionophore A23187 (5 μM), cells were either tested for NO production or collected, lysed, and solubilized as described in the text. (a) Top: Extracts from A23187-treated and untreated cells were immunoprecipitated with anti–caveolin-1 antibody, and the IP fraction was separated on SDS-PAGE and immunoblotted with an anti-eNOS antibody. The extracts from the corresponding cells were also separated on SDS-PAGE and immunoblotted with either an anti-caveolin (middle) or anti-eNOS antibody (bottom). Note that longer exposure of the same blot also reveals detectable caveolin at 100 mg/dl LDL-C. These experiments were performed two times with similar results. (b) A bar graph (mean ± SEM, n = 3) illustrating the NO production (measured with a microsensor) at the basal level (open bars) and after exposure to A23187 (filled bars) in cultures of endothelial cells previously incubated in presence of the indicated amounts of LDL; the data are expressed as percent of NO production in nonstimulated cells exposed to 100 mg/dl LDL-C. #P < 0.01 vs. basal 100 mg/dl LDL and 125 mg/dl LDL conditions. *P < 0.05, **P < 0.01 vs. stimulated 100 mg/dl LDL and 125 mg/dl LDL conditions. (c) Relationship between cholesterol uptake and caveolin abundance. Individual values were obtained from endothelial cells exposed to 100, 125, 150, 175, and 200 mg/dl LDL-C. (d) Top: Extracts from cells incubated with 100 or 200 mg/dl LDL-C in presence of an antioxidant, DTPA (50 μM), and acutely treated with 5 μM A23187 were separated on SDS-PAGE and immunoblotted with anti-caveolin antibody (two lanes per condition). Bottom: The corresponding extracts were also immunoprecipitated with anti-eNOS (lanes 1 and 3) or anti-caveolin antibody (lanes 2 and 4), and the IP fraction was separated on SDS-PAGE and immunoblotted with an anti-eNOS antibody. These experiments were performed two times with similar results. DTPA, diethylenetriamine pentaacetic acid.

Similar articles

Cited by

References

    1. Ross R. The pathogenesis of atherosclerosis: a perspective for the 1990s. Nature. 1993;362:801–809. - PubMed
    1. Lee RT, Libby P. The unstable atheroma. Arterioscler Thromb Vasc Biol. 1997;17:1859–1867. - PubMed
    1. Seiler C, Hess OM, Buechi M, Suter TM, Krayenbuehl HP. Influence of serum cholesterol and other coronary risk factors on vasomotion of angiographically normal coronary arteries. Circulation. 1993;88:2139–2148. - PubMed
    1. Reddy KG, Nair RN, Sheehan HM, Hodgson JM. Evidence that selective endothelial dysfunction may occur in the absence of angiographic or ultrasound atherosclerosis in patients with risk factors for atherosclerosis. J Am Coll Cardiol. 1994;23:833–843. - PubMed
    1. Creager MA, et al. Impaired vasodilation of forearm resistance vessels in hypercholesterolemic humans. J Clin Invest. 1990;86:228–234. - PMC - PubMed

Publication types

MeSH terms