

In vivo blood flow abnormalities in the transgenic knockout sickle cell mouse
- PMID: 10079113
- PMCID: PMC408150
- DOI: 10.1172/JCI5977
In vivo blood flow abnormalities in the transgenic knockout sickle cell mouse
Abstract
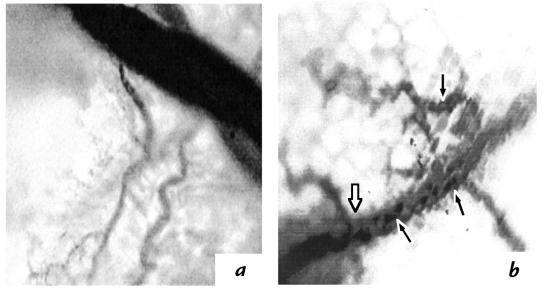
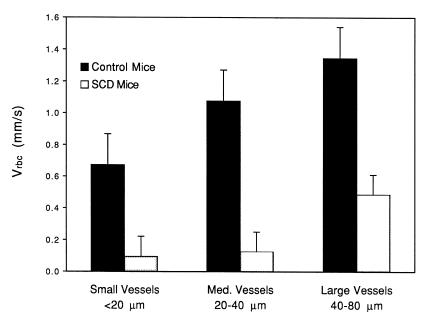
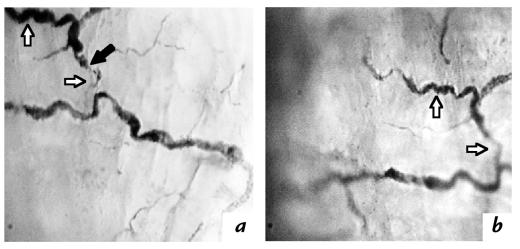
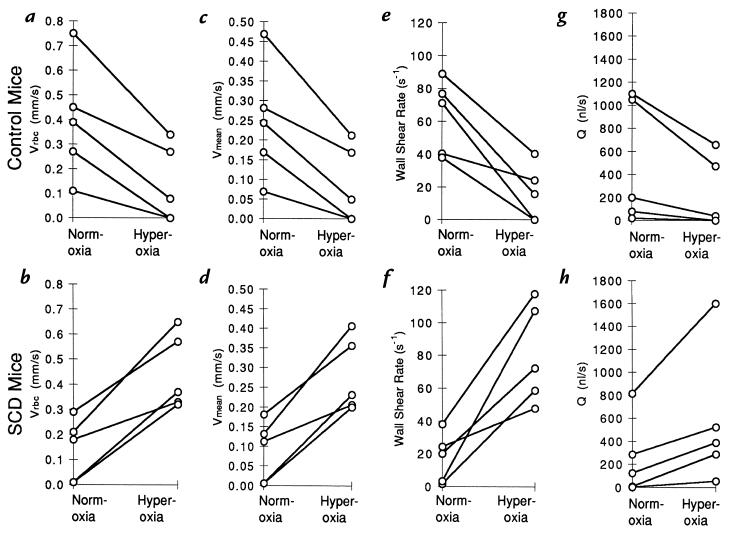
The accepted importance of circulatory impairment to sickle cell anemia remains to be verified by in vivo experimentation. Intravital microscopy studies of blood flow in patients are limited to circulations that can be viewed noninvasively and are restricted from deliberate perturbations of the circulation. Further knowledge of sickle blood flow abnormalities has awaited an animal model of human sickle cell disease. We compared blood flow in the mucosal-intestinal microvessels of normal mice with that in transgenic knockout sickle cell mice that have erythrocytes containing only human hemoglobin S and that exhibit a degree of hemolytic anemia and pathological complications similar to the human disease. In sickle cell mice, in addition to seeing blood flow abnormalities such as sludging in all microvessels, we detected decreased blood flow velocity in venules of all diameters. Flow responses to hyperoxia in both normal and sickle cell mice were dramatic, but opposite: Hyperoxia promptly slowed or halted flow in normal mice but markedly enhanced flow in sickle cell mice. Intravital microscopic studies of this murine model provide important insights into sickle cell blood flow abnormalities and suggest that this model can be used to evaluate the causes of abnormal flow and new approaches to therapy of sickle cell disease.
Figures
References
-
- Ham TH, Castle WB. Relationship of increased hypotonic fragility of erythrostasis to the mechanisms of hemolysis in certain anemias. Trans Assoc Am Phys. 1940;55:127–132.
-
- Dean J, Schechter AN. Sickle cell anemia: molecular and cellular basis of therapeutic approaches. N Engl J Med. 1978;299:752–870. - PubMed
-
- Harris JW, Brewster HH, Ham TH, Castle WB. Studies on the destruction of red blood cells. X. The biophysics and biology of sickle-cell disease. Arch Int Med. 1956;97:145–168. - PubMed
-
- Eaton WA, Hofrichter J. Sickle cell hemoglobin polymerization. Adv Prot Chem. 1990;40:63–279. - PubMed
Publication types
MeSH terms
Substances
Grants and funding
LinkOut - more resources
Full Text Sources
Other Literature Sources
Medical
Molecular Biology Databases
