. 1999 Mar;154(3):755-65.
doi: 10.1016/S0002-9440(10)65322-9.

Urinary bladder transitional cell carcinogenesis is associated with down-regulation of NF1 tumor suppressor gene in vivo and in vitro

Affiliations

Urinary bladder transitional cell carcinogenesis is associated with down-regulation of NF1 tumor suppressor gene in vivo and in vitro

V Aaltonen et al. Am J Pathol. 1999 Mar.

Abstract

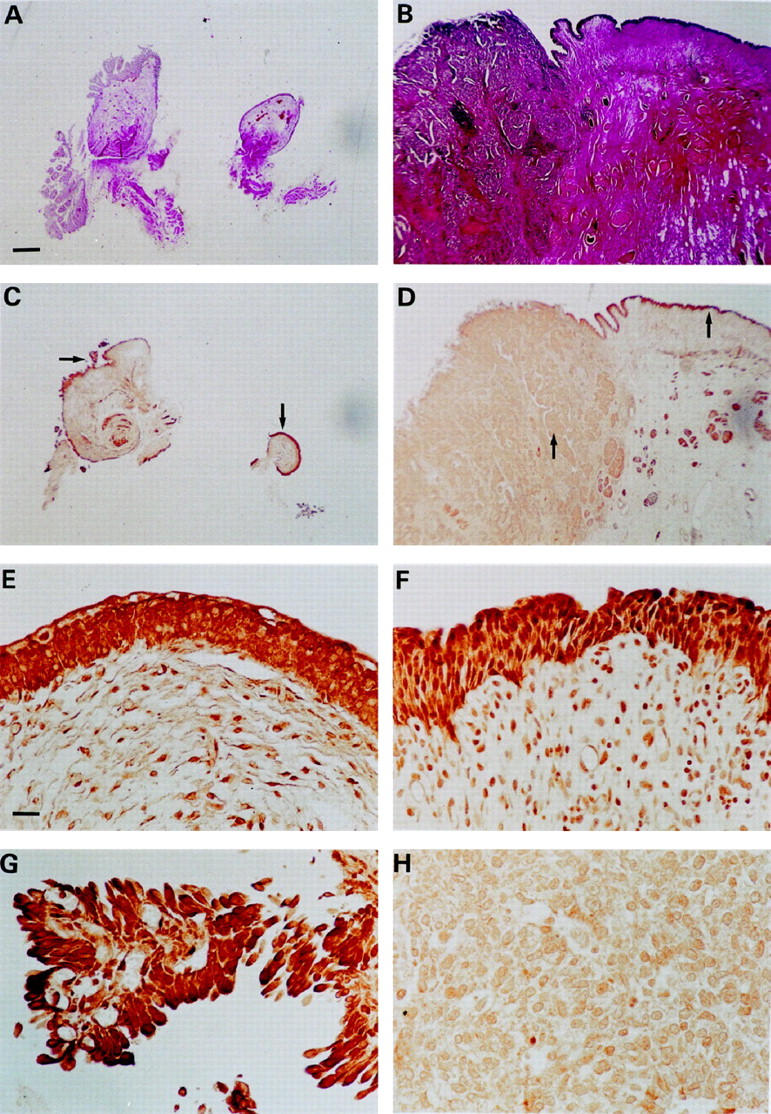
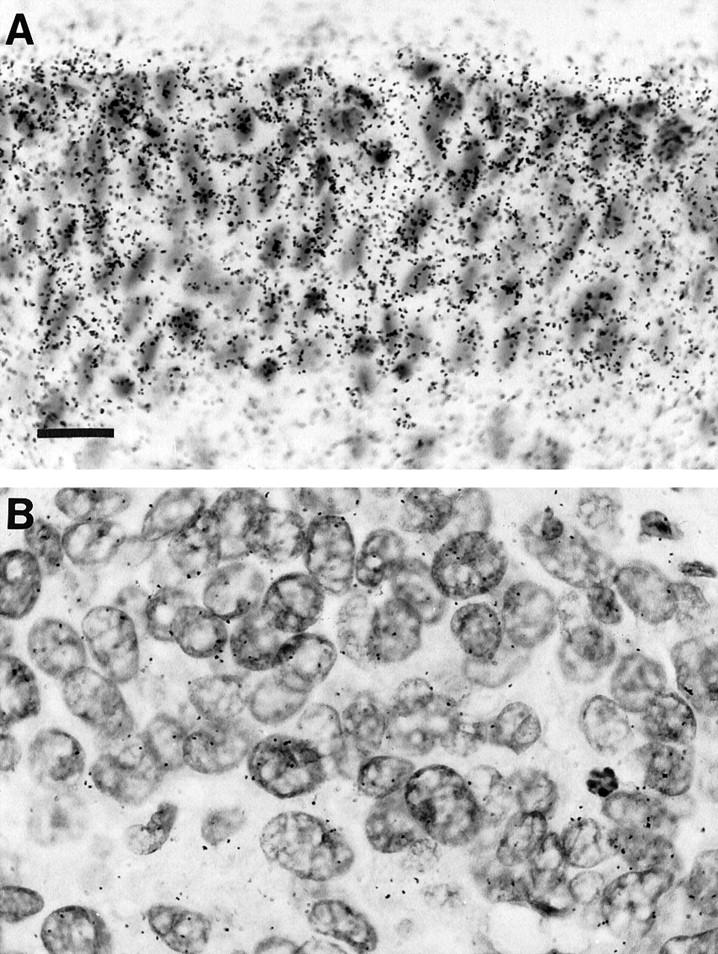
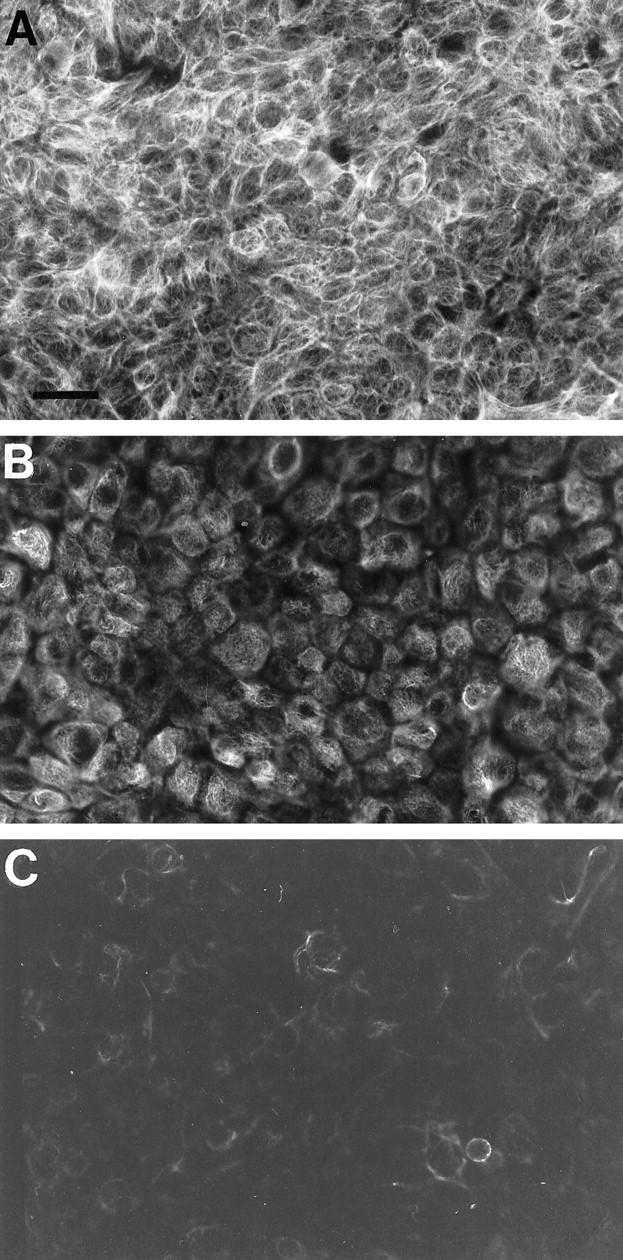
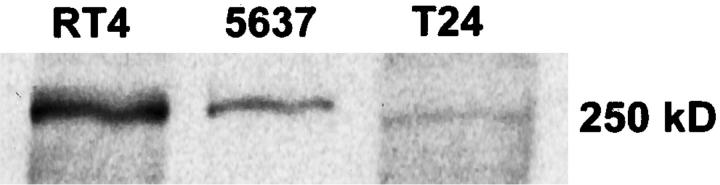
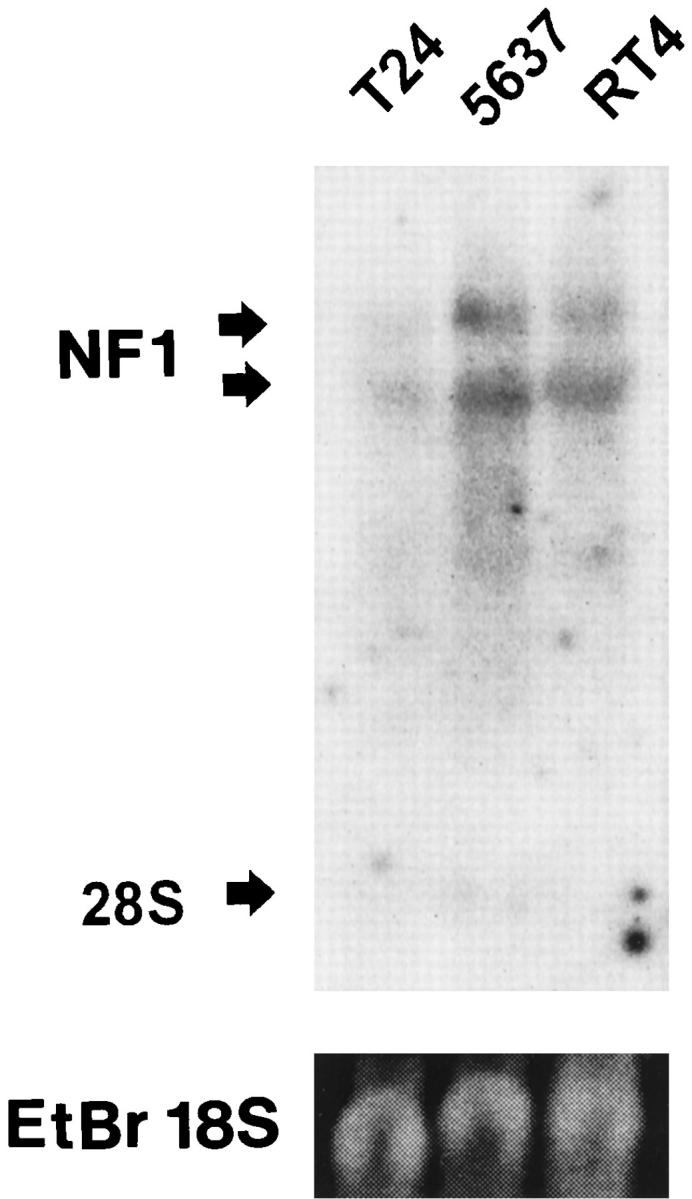
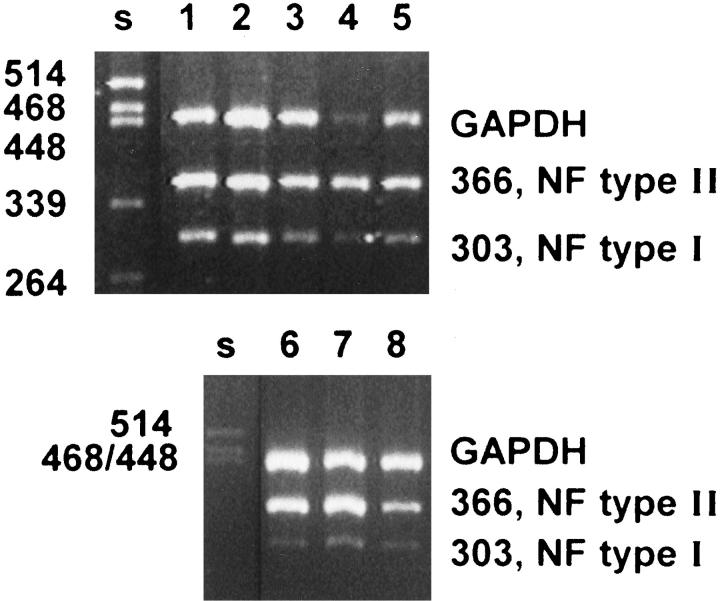
The NF1 gene product (neurofibromin) is known to act as a tumor suppressor protein by inactivating ras. The best documented factors involved in urinary bladder transitional cell carcinoma (TCC) are ras proto-oncogene activation and p53 suppressor gene mutations. This is the first study reporting alterations in NF1 gene expression in TCC. We examined NF1 gene expression in a total of 29 surgical urinary bladder TCC specimens representing grades 1 to 3 and in three cell lines, RT4, 5637, and T24 (representing grades 1 to 3, respectively). Decreased NF1 gene expression was observed in 23 of 29 (83%) TCC specimens as estimated by immunohistochemistry, the decrease being more pronounced in high-grade tumors. NF1 mRNA levels were markedly lower in TCC tissue compared with adjacent non-neoplastic urothelium, as studied by in situ hybridization for grade 3 TCC. Immunohistochemistry and Western blotting demonstrated that TCC cell lines expressed NF1 protein at different levels, expression being almost undetectable in T24 (grade 3) cells. Northern blotting for cell lines demonstrated reduced NF1 mRNA levels in grade 3 TCC cells. Reverse transcription polymerase chain reaction for cell lines and selected grade 2 and grade 3 tissue samples demonstrated NF1 type II mRNA isoform predominance in all samples studied. Our results show that both NF1 mRNA and protein levels are decreased in high-grade TCC, suggesting that alterations of NF1 gene expression may be involved in bladder TCC carcinogenesis.


Figures

Figure 1.
Figure 1.
Immunolocalization of neurofibromin in grade 1 (C, E, and G; T1 in Table 1 ▶ ) and grade 3 (D, F, and H; T27 in Table 1 ▶ ) urinary bladder transitional cell carcinoma samples. A: Low-magnification photomicrograph of tissue harboring grade 1 TCC (van Gieson staining). C: Immunolabeling for neurofibromin in the same specimen as in A; arrows point to areas of higher magnification in E and G. E and G: A higher magnification representing non-neoplastic urothelium and grade 1 TCC, respectively. B: Low-magnification photomicrograph of tissue harboring grade 3 TCC (van Gieson staining). D: Immunolabeling for neurofibromin in the same specimen as in B; arrows point to areas of higher magnification in F and H. F and H: A higher magnification representing non-neoplastic urothelium and grade 3 TCC, respectively. Magnification, ×2 (A and B) and ×40 (C to H); scale bar, 500 μm (A to D) and 25 μm (E to H).
Figure 2.
Figure 2.
NF1 gene expression in grade 3 urinary bladder transitional cell carcinoma, as visualized by in situ hybridization. A: Normal urinary bladder epithelium. B: Area of carcinoma within the same tissue section. The tissue specimen is the same as in Figure 1B ▶ (T27 in Table 1 ▶ ). Radioactively labeled cRNA-mRNA hybrids were detected by autoradiography. The autoradiographic grains were quantitated using MDID-M4 image analysis software (see Results). Hematoxylin counterstain; magnification, ×50; scale bar, 15 μm.
Figure 3.
Figure 3.
Indirect immunofluorescence labeling of cultured urinary bladder cancer cells with neurofibromin-specific antibody. Representative areas of each specimen were photographed using the same exposure times, and the photomicrographs were reproduced under identical conditions. A: RT4 cells originating from grade 1 urinary bladder carcinoma. B: 5637 grade 2 cancer cells. C: T24 grade 3 cancer cells. The intensity of the immunosignals was quantitated using digital image analysis system MCID-M4 (see Results). Magnification, ×40; scale bar, 25 μm.
Figure 4.
Figure 4.
Neurofibromin expression of cultured urinary bladder cancer cells as measured by immunoprecipitation followed by Western blotting. The cells were lysed and immunoprecipitated with neurofibromin-specific NF1GRP(D) antibody. The samples were subsequently subjected to SDS-5% PAGE, transferred to Immobilon-P membrane and incubated with NF1GRP(N) antibody. Specific 250-kd neurofibromin bands were detected using an ECL kit. The neurofibromin-specific signals were quantitated by MCID-M4 laser scanning densitometry (see Results).
Figure 5.
Figure 5.
Northern blot analysis of neurofibromin mRNA from cultured TCC cells: T24 cells from grade 3 TCC, 5637 cells from grade 2 TCC, and RT4 cells from grade 1 TCC. Arrows indicate the 11- to 13-kb NF1 mRNA and the migration position of the 28 S ribosomal unit. In the lower panel, ethidium bromide staining of the gel visualizes the 18 S ribosomal unit.
Figure 6.
Figure 6.
Demonstration of type I and II neurofibromin mRNA isoforms and GAPDH mRNA by RT-PCR in TCC tissue samples and cultured TCC cell lines. Primers for NF1 mRNA amplify both type I and type II isoforms. A second primer pair was used to detect GAPDH mRNA in the same samples. Lanes 1 to 4, analyses on mRNAs isolated from four different grade 3 TCCs; lane 5, grade 2 TCC; lanes 6 to 8, RT-PCR of mRNAs derived from cell lines T24, 5637, and RT4, respectively. PstI-digested λ-DNA was used as DNA size marker (s).

Similar articles

Cited by

References

    1. Marchuk DA, Saulino AM, Tavakkol R, Swaroop M, Wallace MR, Andersen LB, Mitchell AL, Gutmann DH, Boguski M, Collins FS: cDNA cloning of the type 1 neurofibromatosis gene: complete sequence of the NF1 gene product. Genomics 1991, 11:931-940 - PubMed
    1. Gutmann DH, Wood DL, Collins FS: Identification of the neurofibromatosis type 1 gene product. Proc Natl Acad Sci USA 1991, 88:9658-9662 - PMC - PubMed
    1. Barker D, Wright E, Nguyen K, Cannon L, Fain P, Goldgar D, Bishop DT, Carey J, Baty B, Kivlin J, Willard H, Waye JS, Greig G, Leinwand L, Nakamura Y, O’Connel P, Leppert M, Lalouel J-M, White R, Skolnick M: Gene for von Recklinghausen neurofibromatosis is in the pericentromeric region of chromosome 17. Science 1987, 236:1100-1102 - PubMed
    1. von Deimling A, Krone W, Menon AG: Neurofibromatosis type 1: pathology, clinical features and molecular genetics. Brain Pathol 1995, 5:153-162 - PubMed
    1. Wallace MR, Marchuk DA, Andersen LB, Letcher R, Odeh HM, Saulino AM, Fountain JW, Brereton A, Nicholson J, Mitchell AL, Brownstein BH, Collins FS: Type 1 neurofibromatosis gene: identification of a large transcript disrupted in three NF1 patients. Science 1990, 249:181-186 - PubMed

Publication types

MeSH terms