

Evaluation of focal defects of the nerve fiber layer using optical coherence tomography
- PMID: 10080216
- PMCID: PMC1939718
- DOI: 10.1016/s0161-6420(99)90118-5
Evaluation of focal defects of the nerve fiber layer using optical coherence tomography
Abstract
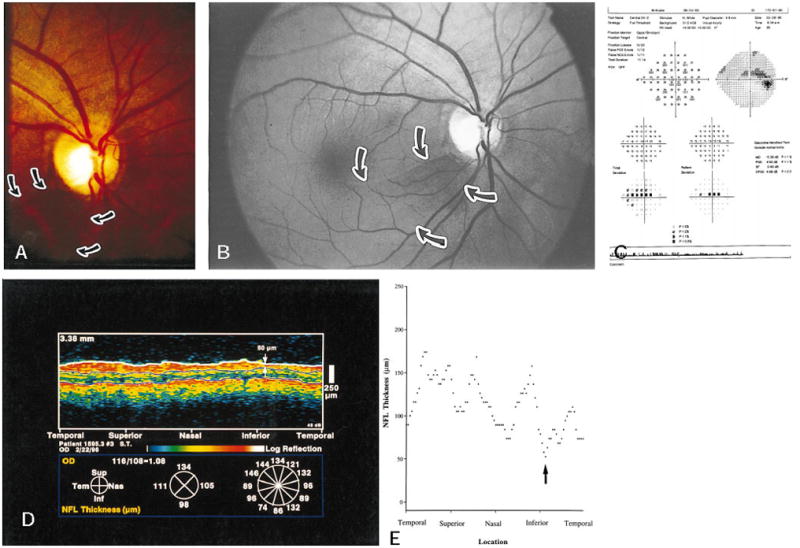
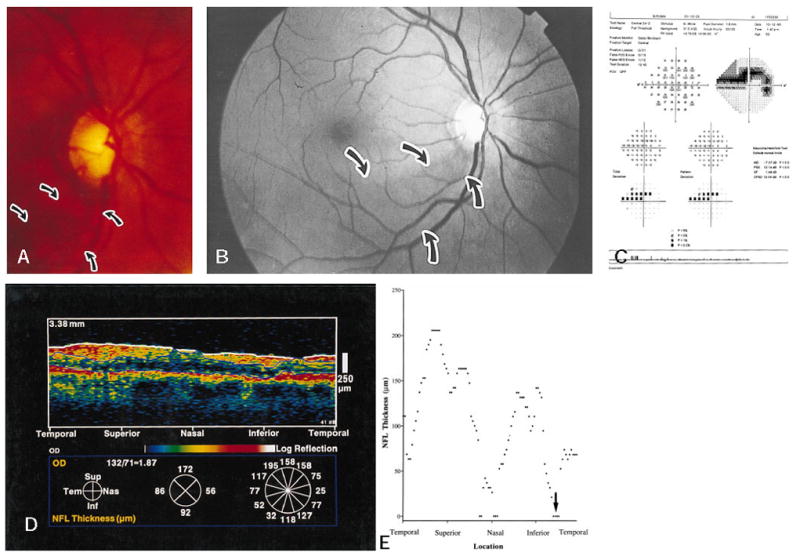
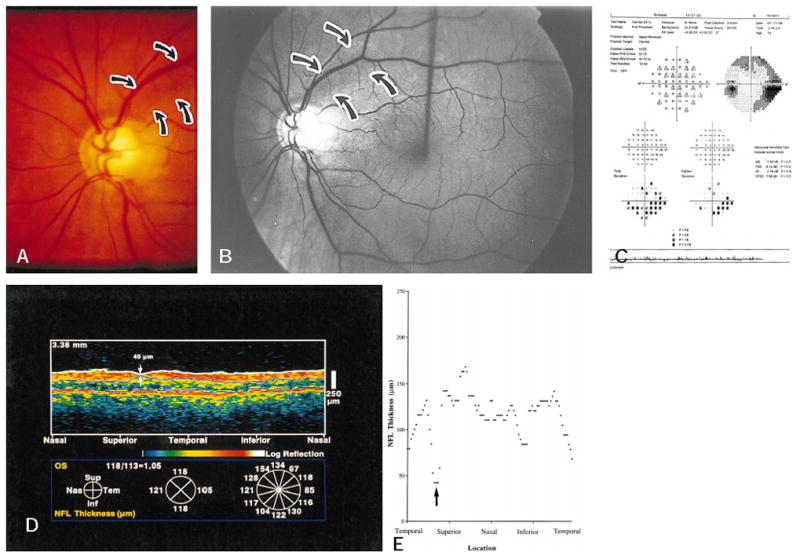
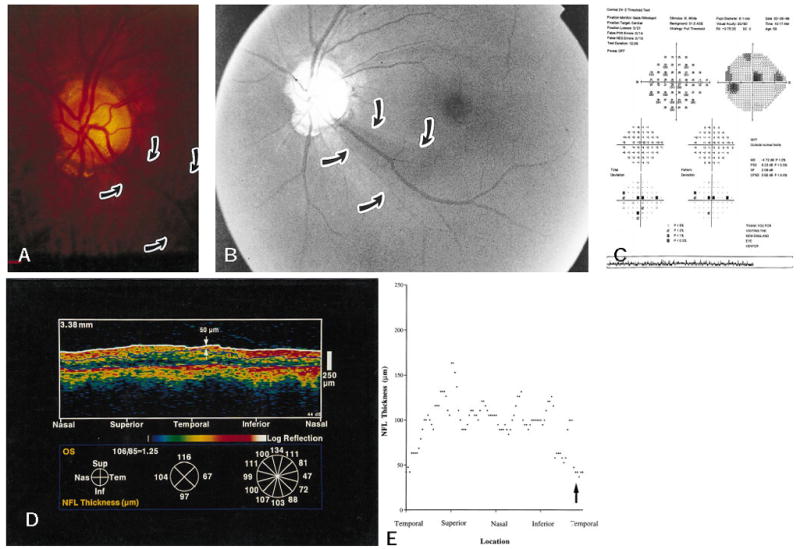
Objective: To analyze glaucomatous eyes with known focal defects of the nerve fiber layer (NFL), relating optical coherence tomography (OCT) findings to clinical examination, NFL and stereoscopic optic nerve head (ONH) photography, and Humphrey 24-2 visual fields.
Design: Cross-sectional prevalence study.
Participants: The authors followed 19 patients in the study group and 14 patients in the control group.
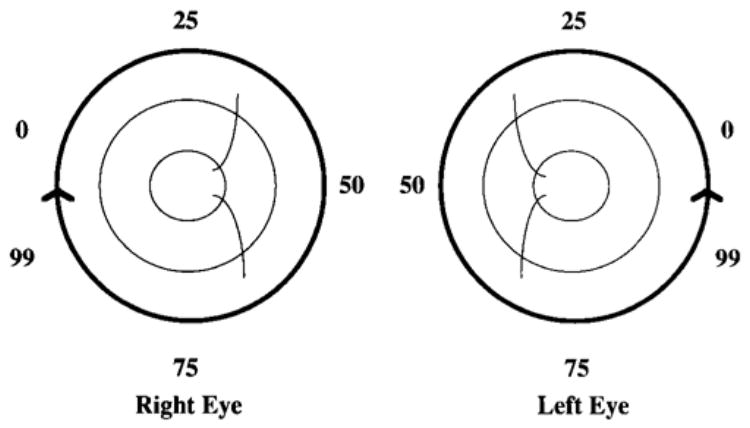
Intervention: Imaging with OCT was performed circumferentially around the ONH with a circle diameter of 3.4 mm using an internal fixation technique. One hundred OCT scan points taken within 2.5 seconds were analyzed.
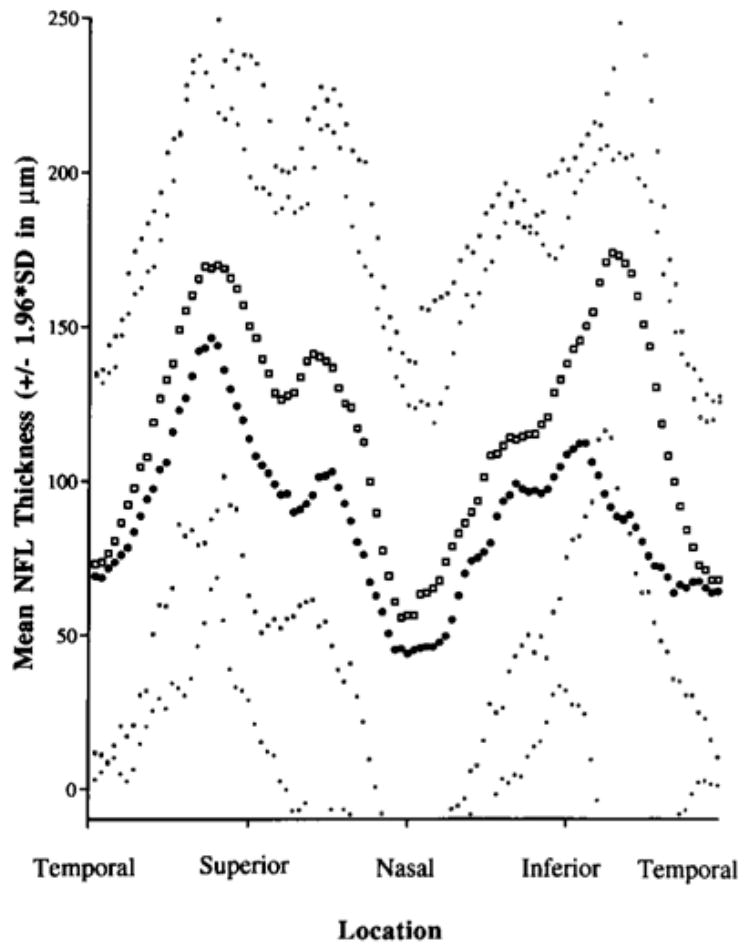
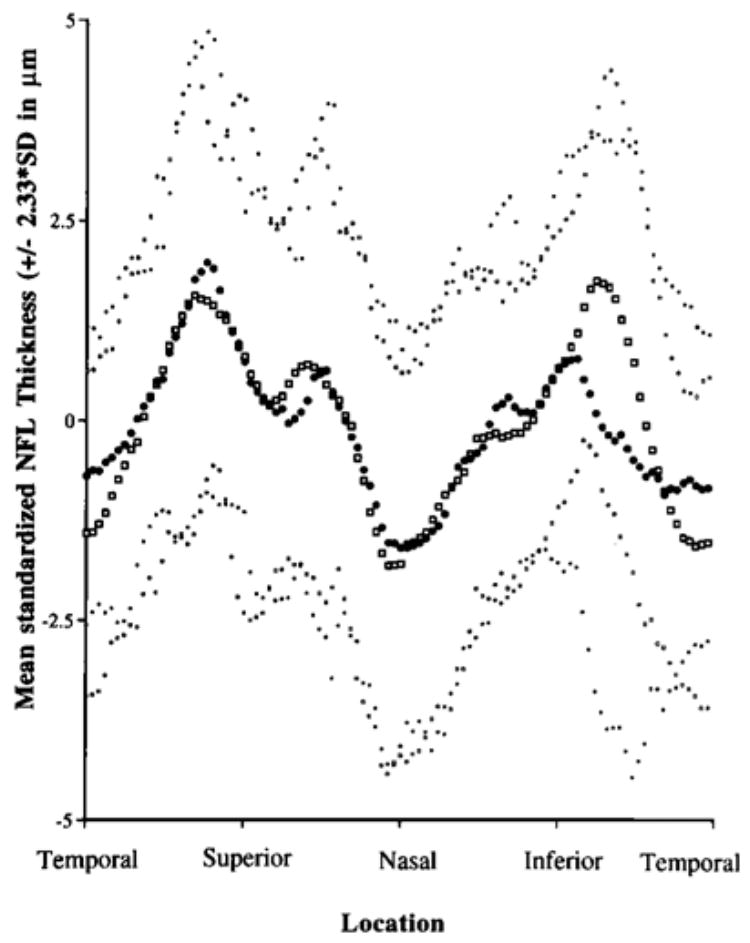
Main outcome measures: Measurements of NFL thickness using OCT were performed.
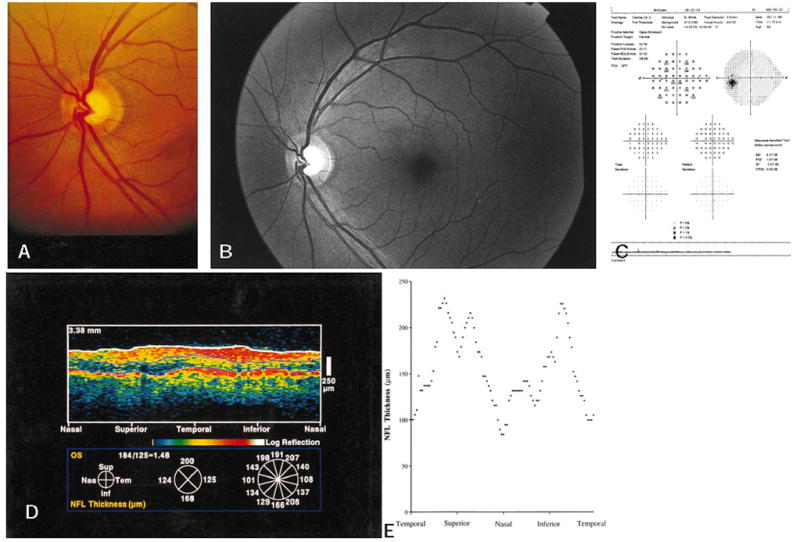
Results: In most eyes with focal NFL defects, OCTs showed significant thinning of the NFL in areas closely corresponding to focal defects visible on clinical examination, to red-free photographs, and to defects on the Humphrey visual fields. Optical coherence tomography enabled the detection of focal defects in the NFL with a sensitivity of 65% and a specificity of 81%.
Conclusion: Analysis of NFL thickness in eyes with focal defects showed good structural and functional correlation with clinical parameters. Optical coherence tomography contributes to the identification of focal defects in the NFL that occur in early stages of glaucoma.
Figures
Similar articles
-
Effect of optic nerve head drusen on nerve fiber layer thickness.Ophthalmology. 1998 May;105(5):878-85. doi: 10.1016/S0161-6420(98)95031-X. Ophthalmology. 1998. PMID: 9593392 Free PMC article.
-
Quantification of nerve fiber layer thickness in normal and glaucomatous eyes using optical coherence tomography.Arch Ophthalmol. 1995 May;113(5):586-96. doi: 10.1001/archopht.1995.01100050054031. Arch Ophthalmol. 1995. PMID: 7748128
-
Optical coherence tomography measurement of macular and nerve fiber layer thickness in normal and glaucomatous human eyes.Ophthalmology. 2003 Jan;110(1):177-89. doi: 10.1016/s0161-6420(02)01564-6. Ophthalmology. 2003. PMID: 12511364 Free PMC article.
-
Optical coherence tomography: a new tool for glaucoma diagnosis.Curr Opin Ophthalmol. 1995 Apr;6(2):89-95. doi: 10.1097/00055735-199504000-00014. Curr Opin Ophthalmol. 1995. PMID: 10150863 Review.
-
Optic nerve and retinal nerve fiber layer analyzers in glaucoma.Curr Opin Ophthalmol. 2002 Apr;13(2):68-76. doi: 10.1097/00055735-200204000-00003. Curr Opin Ophthalmol. 2002. PMID: 11880718 Review.
Cited by
-
Diagnostic tools for glaucoma detection and management.Surv Ophthalmol. 2008 Nov;53 Suppl1(SUPPL1):S17-32. doi: 10.1016/j.survophthal.2008.08.003. Surv Ophthalmol. 2008. PMID: 19038620 Free PMC article. Review.
-
Analysis of normal peripapillary choroidal thickness via spectral domain optical coherence tomography.Ophthalmology. 2011 Oct;118(10):2001-7. doi: 10.1016/j.ophtha.2011.02.049. Epub 2011 Jun 23. Ophthalmology. 2011. PMID: 21703691 Free PMC article.
-
Comparison of Anatomical and Functional Outcomes of Intravitreal Dexamethasone Implant between Phakic and Pseudophakic Eyes with Diabetic Macular Edema.Korean J Ophthalmol. 2020 Oct;34(5):383-391. doi: 10.3341/kjo.2019.0142. Epub 2020 Oct 5. Korean J Ophthalmol. 2020. PMID: 33099560 Free PMC article.
-
Three dimensional optical coherence tomography imaging: advantages and advances.Prog Retin Eye Res. 2010 Nov;29(6):556-79. doi: 10.1016/j.preteyeres.2010.05.005. Epub 2010 Jun 11. Prog Retin Eye Res. 2010. PMID: 20542136 Free PMC article. Review.
-
Characterization of peripapillary atrophy using spectral domain optical coherence tomography.Korean J Ophthalmol. 2010 Dec;24(6):353-9. doi: 10.3341/kjo.2010.24.6.353. Epub 2010 Nov 23. Korean J Ophthalmol. 2010. PMID: 21165234 Free PMC article.
References
-
- Quigley HA, Addicks EM, Green WR. Optic nerve damage in human glaucoma. III. Quantitative correlation of nerve fiber loss and visual field defect in glaucoma, ischemic neuropathy, papilledema, and toxic neuropathy. Arch Ophthalmol. 1982;100:135–46. - PubMed
-
- Quigley HA, Katz J, Derick RJ, et al. An evaluation of optic disc and nerve fiber layer examinations in monitoring progression of early glaucoma damage. Ophthalmology. 1992;99:19–28. - PubMed
-
- Sommer A, Miller NR, Pollack I, et al. The nerve fiber layer in the diagnosis of glaucoma. Arch Ophthalmol. 1977;95:2149–56. - PubMed
-
- Sommer A, Katz J, Quigley HA, et al. Clinically detectable nerve fiber atrophy precedes the onset of glaucomatous field loss. Arch Ophthalmol. 1991;109:77–83. - PubMed
-
- Airaksinen PJ, Drance SM, Douglas GR, et al. Visual field and retinal nerve fiber layer comparisons in glaucoma. Arch Ophthalmol. 1985;103:205–7. - PubMed
Publication types
MeSH terms
Grants and funding
LinkOut - more resources
Full Text Sources
Medical
