. 1999 Apr;67(4):1553-9.
doi: 10.1128/IAI.67.4.1553-1559.1999.

NF-kappaB1 (p50) is upregulated in lipopolysaccharide tolerance and can block tumor necrosis factor gene expression

Affiliations

NF-kappaB1 (p50) is upregulated in lipopolysaccharide tolerance and can block tumor necrosis factor gene expression

S Kastenbauer et al. Infect Immun. 1999 Apr.

Abstract

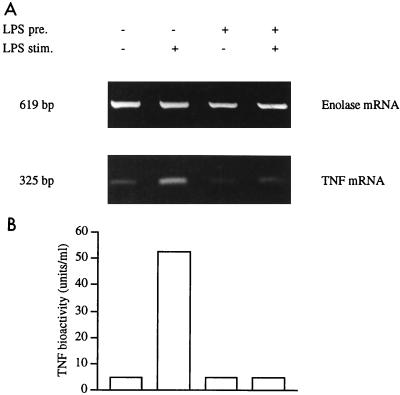
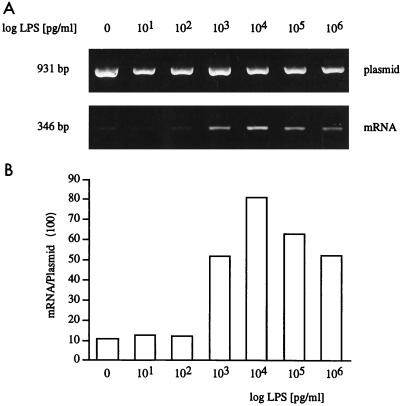
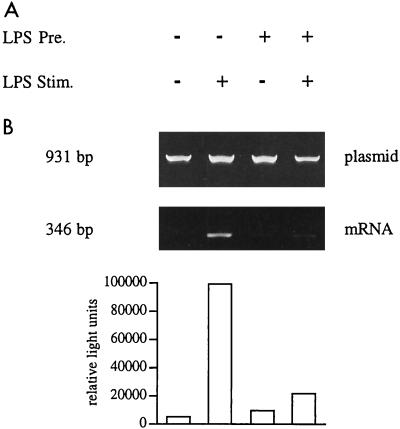
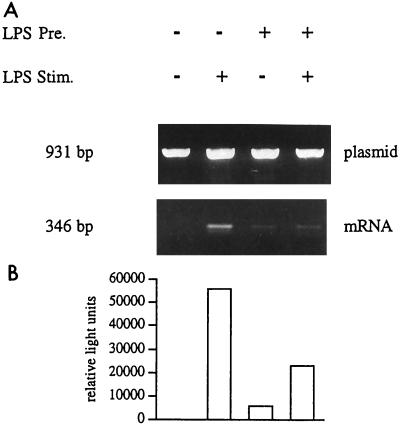
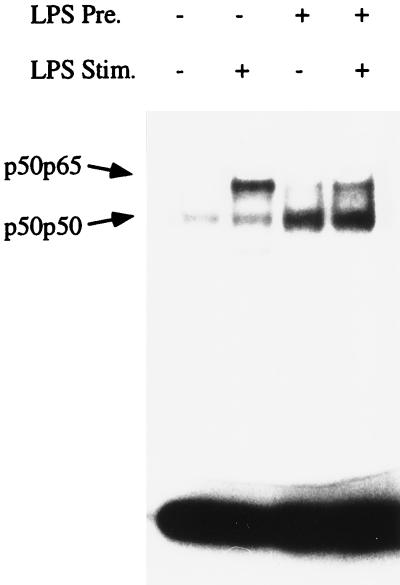
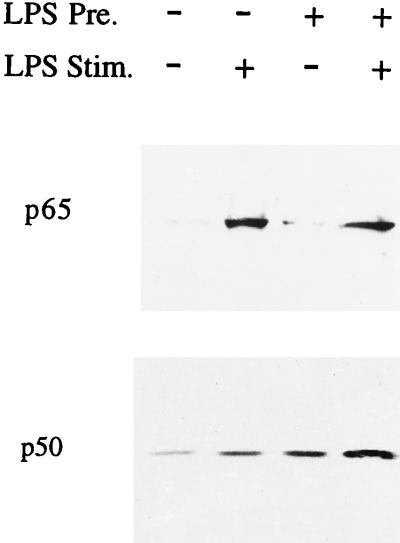
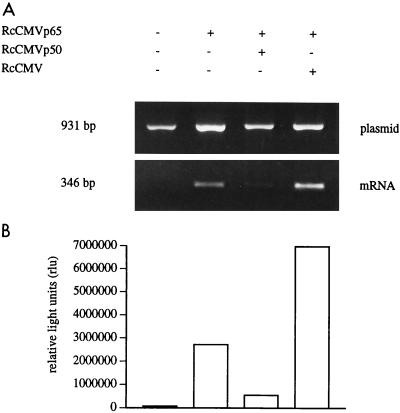
Monocytes respond to lipopolysaccharide (LPS) stimulation with a rapid expression of the tumor necrosis factor (TNF) gene. Upon repeated LPS stimulation there is, however, little production of TNF mRNA and protein; i.e., the cells are tolerant to LPS. Analysis of NF-kappaB proteins in gel shift assays demonstrated that the DNA binding activity that is induced by LPS stimulation in tolerant cells consists mainly of p50-p50 homodimers. Since p50 can bind to DNA but lacks a transactivation domain, this may explain the blockade of TNF gene expression. We now show that in the monocytic cell line Mono Mac 6, this inability to respond can be largely ascribed to NF-kappaB, since a reporter construct directed by a trimeric NF-kappaB motif is strongly transactivated by LPS stimulation of naive cells whereas LPS-tolerant cells exhibit only low activity. Also, Western blot analyses of proteins extracted from purified nuclei showed mobilization of threefold-higher levels of p50 protein in tolerant compared to naive cells, while mobilization of p65 was unaltered. Overexpression of p50 in HEK 293 cells resulted in a strong reduction of p65-driven TNF promoter activity at the levels of both luciferase mRNA and protein. These data support the concept that an upregulation of p50 is instrumental in LPS tolerance in human monocytes.


Figures

FIG. 1
FIG. 1
Induction of LPS tolerance in human Mono Mac 6 cells. Mono Mac 6 cells were precultured for 48 h with or without LPS (20 ng/ml), washed, and stimulated with or without LPS at 1 μg/ml for 1 h (for mRNA determination) or for 6 h (for protein analysis). Isolated RNA was reverse transcribed and amplified for α-enolase (32 cycles) and for TNF (34 cycles). Densitometry values for TNF, corrected for enolase prevalence, were 17.8, 48.7, 9.1, and 17.4% for lanes 1 to 4. In an average of four experiments, −/+ cells (A, lane 2) gave a value of 58.4 ± 16.9%, while for +/+ cells (lane 4) the value was 26.2 ± 15.0% (P < 0.01). Assay of supernatants from the same experiment for TNF protein in the WEHI 164/actinomycin D bioassay (B) gave values of <5 U/ml for all cultures except the LPS-stimulated naive cells in lane 2, which produced 52.2 U/ml. In an average of four experiments, −/+ cells (lane 2) gave 132.7 ± 58.3 U/ml and +/+ cells (lane 4) gave 9.8 ± 6.1 U/ml (P < 0.01).
FIG. 2
FIG. 2
LPS dose dependence of human TNF promoter-directed mRNA expression in Mono Mac 6 cells. Mono Mac 6 cells were transfected by DEAE-dextran and after overnight culture were stimulated with different doses of LPS for 4 h. RNA and plasmid DNA were isolated, and plasmid was amplified directly from cell lysates with 22 PCR cycles; mRNA was reverse transcribed, and cDNA was amplified by using one 5′ primer combined with one 3′ transintron primer (40 cycles). Products were separated on a 1.4% agarose gel (A). (B) Densitometry values for mRNA, expressed as percentage of the plasmid DNA. Data are representative of one experiment of five performed.
FIG. 3
FIG. 3
TNF promoter activity in naive and LPS-tolerant Mono Mac 6 cells. Mono Mac 6 cells were transfected, cultured for 2 days with or without LPS (20 ng/ml), washed, and stimulated with LPS at 1 μg/ml. RNA and plasmid DNA were isolated; the plasmid DNA was amplified directly (30 cycles), while mRNA was reverse transcribed and amplified by using the 3′ transintron primer together with the 5′ primer (40 cycles). Products were separated on a 1.4% agarose gel (A). Densitometry values for mRNA are expressed as proportions of the plasmid DNA are 2.5, 65.9, 7.6, and 24.0% for lanes 1 to 4. Cell samples from the same experiment were taken for three freeze-thaw cycles, and luciferase enzyme activity was determined in the lysates (B). Values for luciferase were 5,218, 98,742, 9,623, and 21,931 relative light units for lanes 1 to 4. Data are representative of one experiment of three performed. The average fold induction for both mRNA and protein was significantly lower in LPS-stimulated tolerant cells than in LPS-stimulated naive cells. For mRNA, levels of induction were 39.8- and 4.4-fold in naive and tolerant cells, respectively; for luciferase protein, they were 13.9- and 2.1-fold for naive and tolerant cells, respectively (P < 0.05 for both mRNA and protein).
FIG. 4
FIG. 4
Promoter activity of the 3×κB construct in naive and LPS-tolerant Mono Mac 6 cells. Mono Mac 6 cells were transfected, cultured for 2 days with or without LPS (20 ng/ml), washed, and stimulated with LPS at 1 μg/ml. RNA and plasmid DNA were isolated; the plasmid DNA was amplified directly (27 cycles), while mRNA was reverse transcribed and amplified by using the 3′ transintron primer together with the 5′ primer (40 cycles). Products were separated on a 1.4% agarose gel (A). Densitometry values for mRNA are expressed as proportions of the plasmid DNA are 0.4, 56.7, 8.4, and 11.1% for lanes 1 to 4. Cell samples from the same experiment were taken for three freeze-thaw cycles, and luciferase enzyme activity was determined in the lysates (B). Values for luciferase were 354, 55,743, 6,022, and 23,208 relative light units for lanes 1 to 4. Data are representative of one experiment of three performed. The average fold induction for mRNA was significantly lower in LPS-stimulated tolerant cells (1.0-fold) compared to LPS-stimulated naive cells (81.8-fold; P < 0.01). The reduction of fold induction at the protein level in tolerant cells was not significant (P > 0.05).
FIG. 5
FIG. 5
Increase of p50 homodimers in tolerant Mono Mac 6 cells. Mono Mac 6 cells were cultured for 2 days with or without LPS (20 ng/ml), washed, and stimulated with LPS at 1 μg/ml. Nuclear extracts were admixed with a double-stranded radiolabeled probe representing the −605 motif of the human TNF promoter; after separation under nondenaturing conditions, the dried polyacrylamide gel was exposed to an X-ray film. The lower band represents p50-p50; the upper band represents p50-p65. Laser densitometry shows that the ratios of p50-p65 to p50-p50 are 2.44 in lane 2 and 0.44 in lane 4. Data are of one experiment of three performed.
FIG. 6
FIG. 6
Increase of p50 protein in nuclei of tolerant Mono Mac 6 cells. Nuclei were generated by Dounce homogenization in the presence of a protease inhibitor cocktail followed by purification over a sucrose gradient. Extracts were separated by gel electrophoresis and blotted on nitrocellulose. Blots were stained with an anti-p65 or anti-p50 antibody and developed by using ECL. In the upper panel densitometry for p65 gave values of 3.0, 41.8, 6.2, and 44.9 for lanes 1 to 4, respectively (one of three experiments). The difference between lanes 3 and 4 was significant (P < 0.05). In the lower panel, densitometry for p50 gave values of 2.6, 6.9, 10.6, and 24.3 arbitrary units for lanes 1 to 4, respectively (one of three experiments). The difference between lanes 2 and 4 was significant (P < 0.05).
FIG. 7
FIG. 7
Effect of p50 overexpression on transactivation of the human TNF promoter. HEK 293 cells were calcium phosphate transfected with 0.5 μg of pTNF-1064 luci-β reporter plasmid and, as indicated with 0.25 μg of RcCMVp65 without or together with 2.5 μg of RcCMVp50 or RcCMV empty vector. Luciferase mRNA and enzyme activity were measured after 24 h. Plasmid-corrected mRNA values (A) were 3.0, 46.2, 21.9, and 103.3% for lanes 1 to 4; luciferase enzyme activities (B) were 66,193, 2,708,986, 538,750, and 6,960,601 relative light units for lanes 1 to 4. Data are representative of three and four experiments for mRNA and protein, respectively. The average fold reduction by p50 compared to empty plasmid was 6.1-fold for mRNA and 10.9-fold for enzyme activity (P < 0.01).

Similar articles

Cited by

References

    1. Blackwell T S, Blackwell T R, Christman J W. Induction of endotoxin tolerance depletes nuclear factor-κB and suppresses its activation in rat alveolar macrophages. J Leukoc Biol. 1997;62:885–891. - PubMed
    1. Coffee K A, Halushka P V, Ashton S H, Tempel G E, Wise W C, Cook J A. Endotoxin tolerance is associated with altered GTP-binding protein function. J Appl Physiol. 1992;73:1008–1013. - PubMed
    1. Dignam J D, Lebovitz R M, Roeder R G. Accurate transcription initiation by RNA polymerase II in a soluble extract from isolated mammalian nuclei. Nucleic Acids Res. 1983;11:1475–1489. - PMC - PubMed
    1. Durando M, Ashton S H, Makhlouf M A, Simmons-Wagner R, Halushka P V, Cook J A. Endotoxin-induced desensitization of THP-1 cells is not associated with altered G protein binding or content. J Endotoxin Res. 1997;4:97–103.
    1. Ertel W, Kremer J-P, Kenney J, Steckholzer U, Jarrar D, Trentz O, Schildberg F W. Downregulation of proinflammatory cytokine release in whole blood from septic patients. Blood. 1995;85:1341–1347. - PubMed

Publication types