. 1999 Mar 8;144(5):857-68.
doi: 10.1083/jcb.144.5.857.

Calreticulin is essential for cardiac development

Affiliations

Calreticulin is essential for cardiac development

N Mesaeli et al. J Cell Biol. .

Abstract

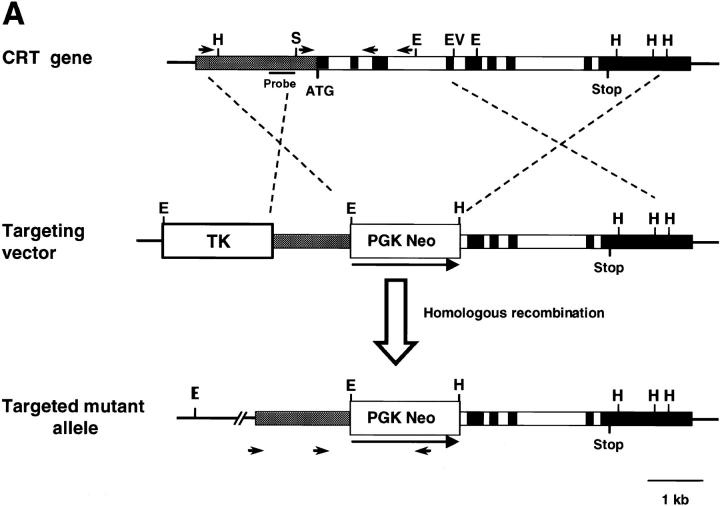
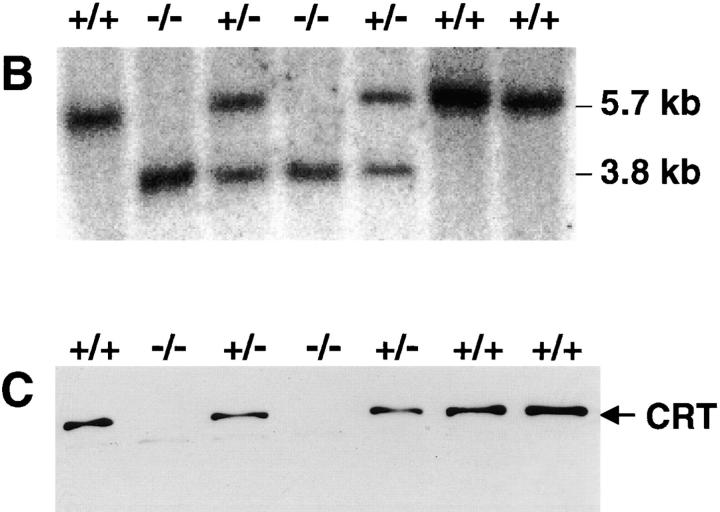
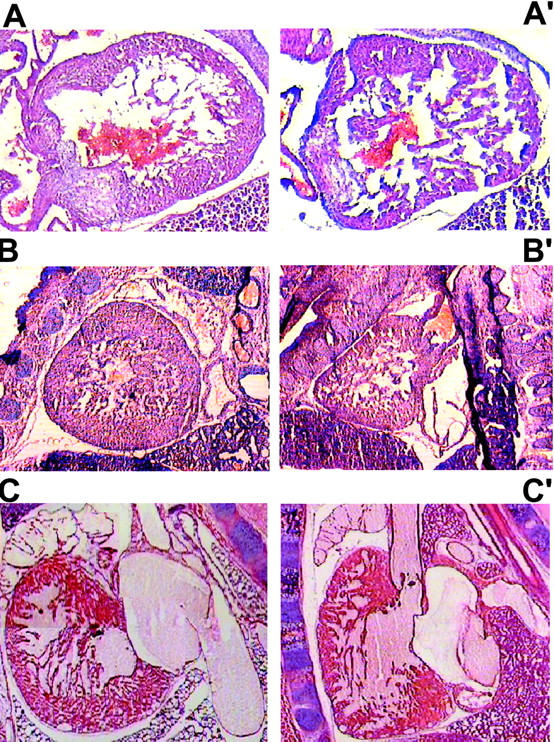
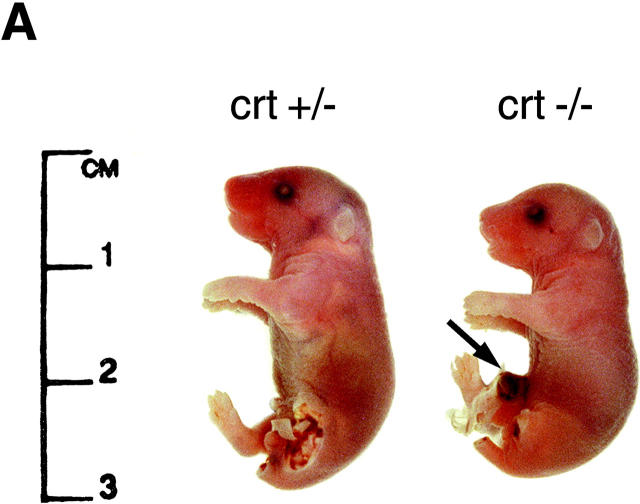
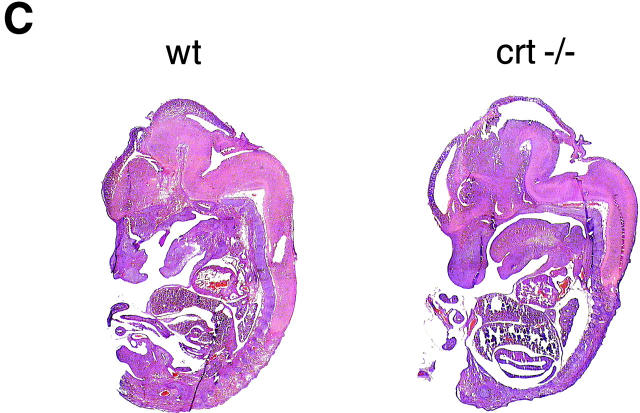
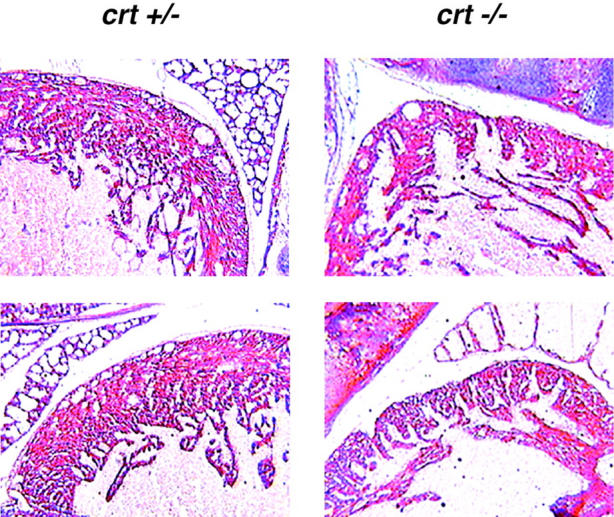
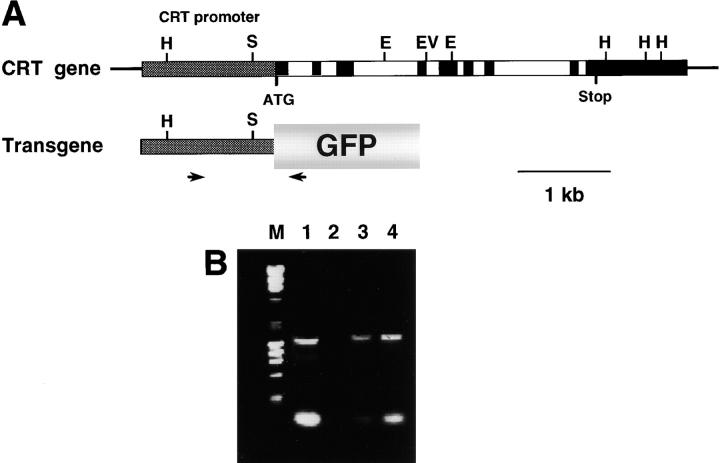
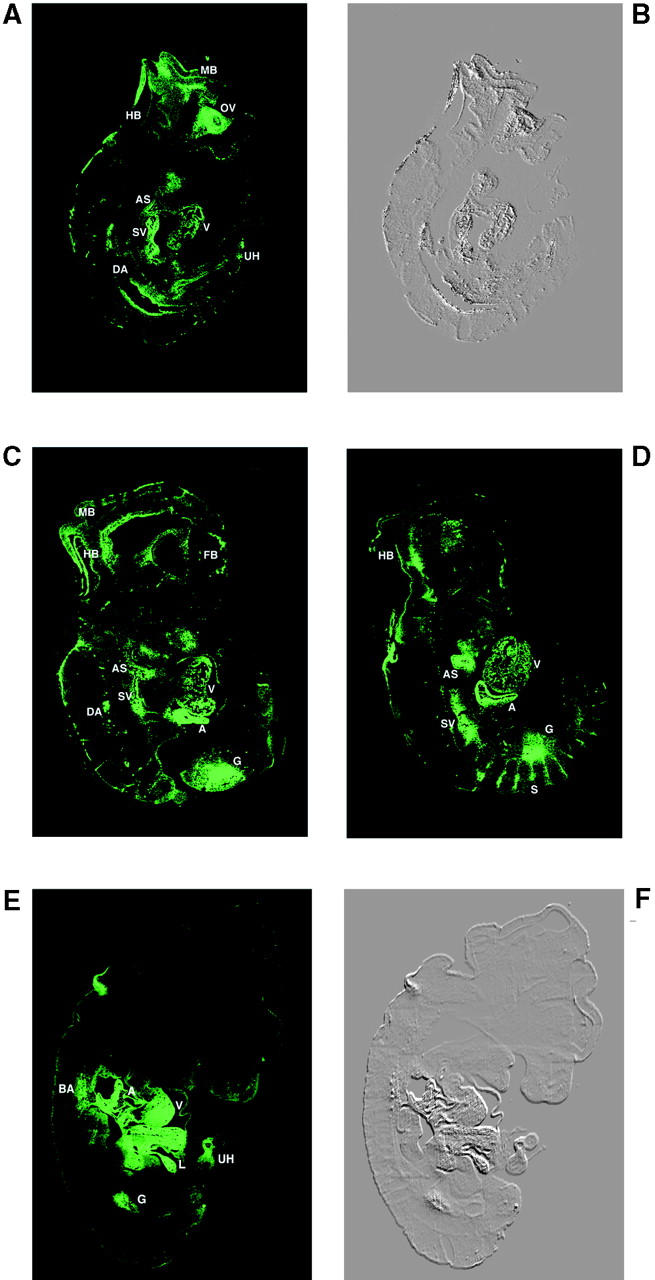
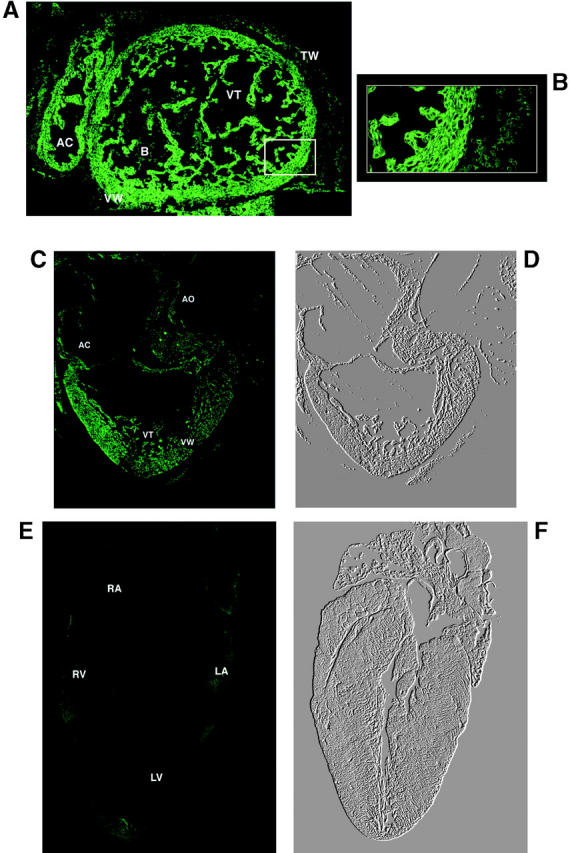
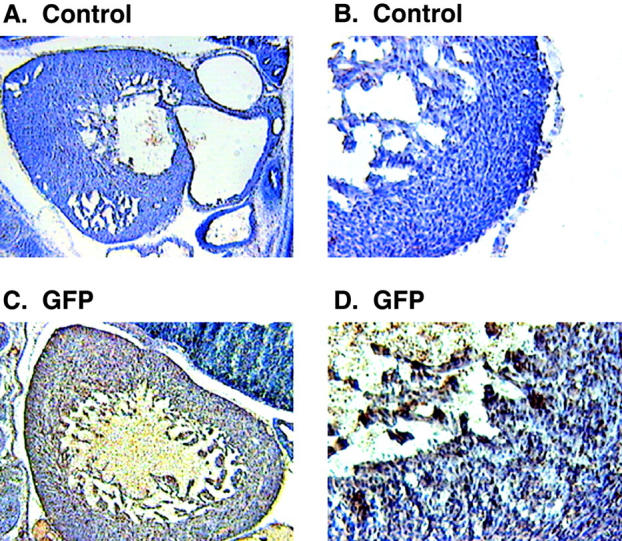
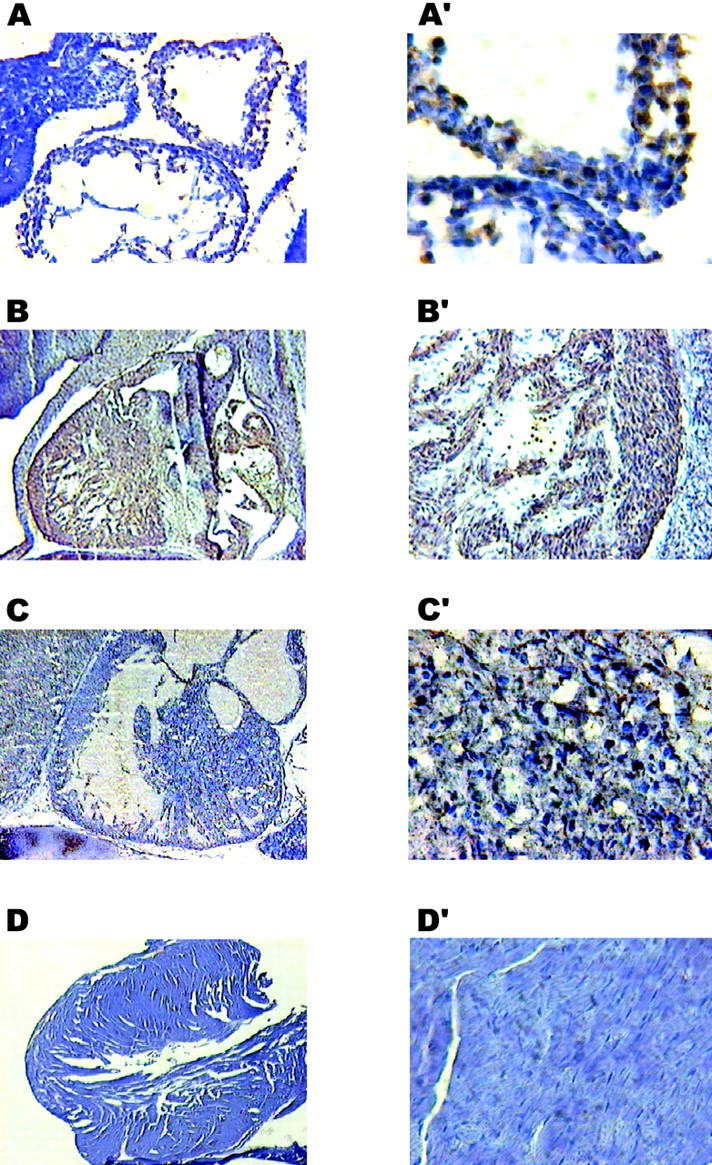
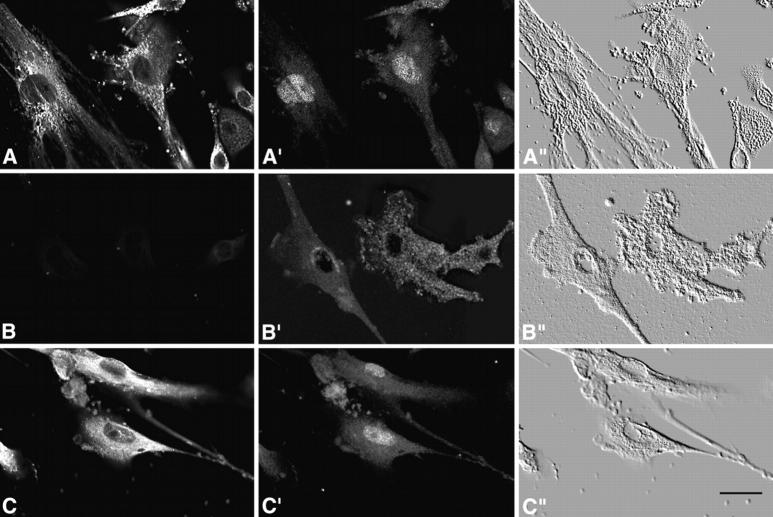
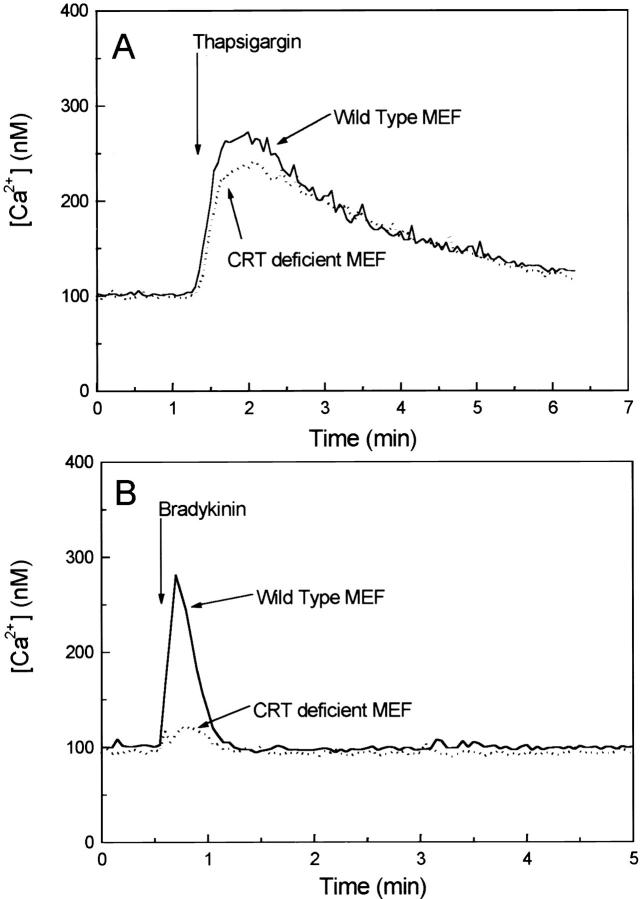
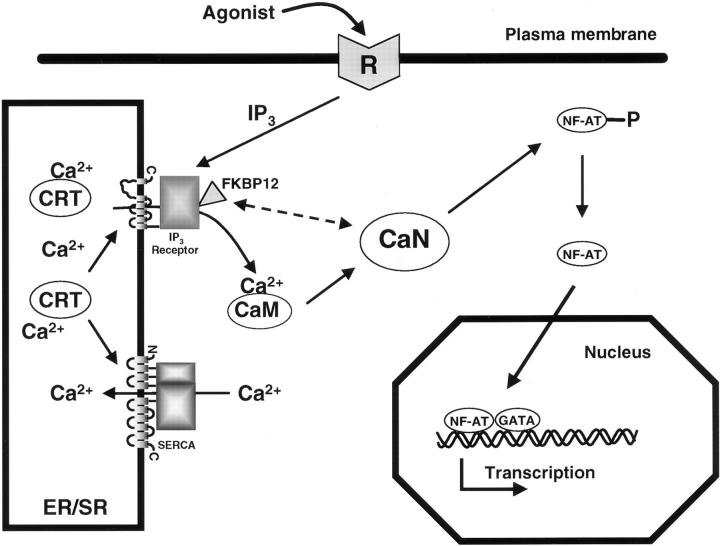
Calreticulin is a ubiquitous Ca2+ binding protein, located in the endoplasmic reticulum lumen, which has been implicated in many diverse functions including: regulation of intracellular Ca2+ homeostasis, chaperone activity, steroid-mediated gene regulation, and cell adhesion. To understand the physiological function of calreticulin we used gene targeting to create a knockout mouse for calreticulin. Mice homozygous for the calreticulin gene disruption developed omphalocele (failure of absorption of the umbilical hernia) and showed a marked decrease in ventricular wall thickness and deep intertrabecular recesses in the ventricular walls. Transgenic mice expressing a green fluorescent protein reporter gene under the control of the calreticulin promoter were used to show that the calreticulin gene is highly activated in the cardiovascular system during the early stages of cardiac development. Calreticulin protein is also highly expressed in the developing heart, but it is only a minor component of the mature heart. Bradykinin-induced Ca2+ release by the InsP3-dependent pathway was inhibited in crt-/- cells, suggesting that calreticulin plays a role in Ca2+ homeostasis. Calreticulin-deficient cells also exhibited impaired nuclear import of nuclear factor of activated T cell (NF-AT3) transcription factor indicating that calreticulin plays a role in cardiac development as a component of the Ca2+/calcineurin/NF-AT/GATA-4 transcription pathway.


Figures

Figure 1
Figure 1
Targeted disruption of the calreticulin gene. (A) Top shows the structure of the mouse calreticulin gene, indicating the ATG start codon and the restriction enzymes utilized (E, EcoRI; EV, EcoRV; H, HindIII; S, SalI). The arrows indicate the PCR primer sets (see Materials and Methods) used for recognition of the wild-type gene. The solid bar is the 5′ probe used for Southern blotting. Middle is the targeting vector designed to replace the first exons with the PGK NEO cassette. The targeted calreticulin allele is shown (bottom). The arrows indicate the PCR primers used for recognition of the mutant allele. (B) Southern blot of the EcoRI-digested genomic DNA isolated from wild-type (+/+), heterozygote (+/−), and homozygote (−/−) mice. The sizes of the wild-type (5.7 kb) and mutant allele (3.8 kb) are indicated. (C) Western blot analysis of proteins extracted from the biopsies of wild-type (+/+), heterozygote (+/−), and homozygote (−/−) mouse embryos. The blot was probed with the affinity-purified rabbit anticalreticulin antibody (Michalak et al., 1996).
Figure 1
Figure 1
Targeted disruption of the calreticulin gene. (A) Top shows the structure of the mouse calreticulin gene, indicating the ATG start codon and the restriction enzymes utilized (E, EcoRI; EV, EcoRV; H, HindIII; S, SalI). The arrows indicate the PCR primer sets (see Materials and Methods) used for recognition of the wild-type gene. The solid bar is the 5′ probe used for Southern blotting. Middle is the targeting vector designed to replace the first exons with the PGK NEO cassette. The targeted calreticulin allele is shown (bottom). The arrows indicate the PCR primers used for recognition of the mutant allele. (B) Southern blot of the EcoRI-digested genomic DNA isolated from wild-type (+/+), heterozygote (+/−), and homozygote (−/−) mice. The sizes of the wild-type (5.7 kb) and mutant allele (3.8 kb) are indicated. (C) Western blot analysis of proteins extracted from the biopsies of wild-type (+/+), heterozygote (+/−), and homozygote (−/−) mouse embryos. The blot was probed with the affinity-purified rabbit anticalreticulin antibody (Michalak et al., 1996).
Figure 3
Figure 3
Histology of the hearts from crt +/− and crt −/− embryos. A, B, and C show histological analysis of the 12.5-, 14.5-, and 18-d-old crt +/− embryos, respectively. A′, B′, and C′ show histology of the 12.5-, 14.5-, and 18-d-old crt −/− embryos. crt −/− embryos show deep intertrabecular recesses and increased fenestration associated with the thinner ventricular wall. Sections were stained with hematoxylin and eosin as described in Materials and Methods.
Figure 2
Figure 2
Phenotypes of heterozygote (crt +/−) and homozygote (crt −/−) mouse embryos. (A) Phenotypes of 18-d-old crt +/− and crt −/− mouse embryos are shown. The arrow indicates the umbilical hernia. Leg and tail biopsies were removed for better visualization of the defect and were used for DNA and protein analysis. (B) Low magnification histology of 18-d-old crt +/− and crt −/− mouse embryos is shown. The arrow indicates the umbilical hernia. (C) Phenotypes of wild-type (wt) and homozygote (crt −/−) 12.5-d-old mouse embryos. Sagittal sections of embryos were stained with eosin and hematoxylin.
Figure 2
Figure 2
Phenotypes of heterozygote (crt +/−) and homozygote (crt −/−) mouse embryos. (A) Phenotypes of 18-d-old crt +/− and crt −/− mouse embryos are shown. The arrow indicates the umbilical hernia. Leg and tail biopsies were removed for better visualization of the defect and were used for DNA and protein analysis. (B) Low magnification histology of 18-d-old crt +/− and crt −/− mouse embryos is shown. The arrow indicates the umbilical hernia. (C) Phenotypes of wild-type (wt) and homozygote (crt −/−) 12.5-d-old mouse embryos. Sagittal sections of embryos were stained with eosin and hematoxylin.
Figure 4
Figure 4
Histological analysis of the heart of crt +/− and crt −/− 18-d-old embryos. Sections were stained with hematoxylin and eosin as described in Materials and Methods. The upper panel shows the apex of the heart in crt +/− and crt −/− embryos. The lower panel shows ventricular walls in crt +/− and crt −/− animals.
Figure 5
Figure 5
Construction and analysis of the GFP reporter gene vector. (A) 2.3-kb calreticulin promoter (Waser et al., 1997) was subcloned upstream of the cDNA encoding GFP. The arrows show the locations of the primer set used for PCR-driven detection of integration of the transgene into the mice genome. (B) PCR analysis of the genomic DNA of transgenic mice: lane M, molecular size ladder; lane 1, positive control purified plasmid DNA used as a template; lane 2, wild-type mouse; and lanes 3 and 4, GFP-transgenic mice.
Figure 6
Figure 6
Developmental activation of calreticulin promoter. (A and B) Sagittal section of a 9.5-d-old mouse embryo expressing the GFP reporter protein under the control of the calreticulin promoter. (B) A phase-contrast of the image seen in A. (C and D) Sagittal sections of 10.5-d-old mouse embryos from GFP transgenic mice. (C) The first section shows high expression of GFP in the atria (A) and ventricles (V). Fluorescent signals are seen mainly in the cardiovascular and the nervous systems. (D) Additional sections of the embryo shown in C indicate high fluorescence in the intersomitic vessels (S). (E and F) Analysis of 13.5-d-old transgenic mouse embryo. (E) Confocal image showing the fluorescent signal in the cardiovascular system, liver, gut, and umbilical hernia. (F) A phase-contrast image of E. Tissues expressing GFP show a highly fluorescent signal: A, atria; AS, aortic sac; BA, branchial arteries and branches from the pulmonary arteries and arches of the aorta; DA, dorsal aorta; FB, fore brain; G, gut; HB, hind brain; L, liver; MB, mid brain; MG, midgut; OV, optic vesicle; SV, sinus venosus; S, somite; UH, umbilical hernia; and V, ventricles.
Figure 7
Figure 7
Confocal image of the hearts at different stages of development. (A and B) Cross-sections of the heart from 14.5-d-old embryo. GFP expression is localized to both atrial and ventricular walls but the fluorescent signal is also seen in the atrial and ventricular trabeculae. (B) The highest fluorescent signal found in the cardiomyocytes is shown. (C) GFP expression in the heart of 18-d-old embryo. (D) A phase-contrast image of C. (E) A negligible level of expression of GFP in the heart of 3-wk-old mouse is shown. (F) A phase-contrast image of E. Symbols: AC, atrial chamber; B, blood cells; TW, thoracic wall; VT, ventricular trabeculae; and VW, ventricular wall.
Figure 8
Figure 8
Immunohistochemical analysis of the GFP transgenic mice. Sagittal sections of 13.5-d-old mouse embryos were stained with specific antibodies followed by DAB (brown color). The sections were counter-stained with hematoxylin to visualize the nuclei. Low (A) and high magnification (B) images from cryostat sections of a wild-type mouse embryo stained with anti-GFP antibody. Low (C) and high (D) magnification images from GFP transgenic mouse showing the GFP positive staining in the ventricular myocytes.
Figure 9
Figure 9
Immunohistochemical analysis of the transgenic mice with anticalreticulin antibodies. Sagittal sections of 9.5- (A), 13.5- (B), and 18- (C) d-old embryos and mature (D) mouse hearts were stained with anticalreticulin antibodies followed by DAB (brown color). High magnification picture (A′–D′) shows that calreticulin protein was highly expressed in myocytes during early stages of embryonic development (A′, B′, and C′). No significant staining for calreticulin was detected in the mature heart (D′). The sections were counterstained with hematoxylin.
Figure 10
Figure 10
Inhibition of nuclear import of NF-AT3 transcription factor in crt −/− cells. Mouse embryonic fibroblasts isolated from 14.5-d-old crt +/− (row A) and crt −/− (rows B and C) embryos were transiently transfected with either NF-AT3 (rows A and B) or NF-AT3 and calreticulin (row C) expression vectors. A, B, and C show localization of calreticulin, while A′, B′, and C′ show localization of NF-AT3 in the same cells. Cells were stimulated with 200 nM bradykinin. A′ shows that in the stimulated crt +/− cells NF-AT3 translocates to the nucleus. In crt −/− cells the majority of NF-AT3 is found in the cytoplasm (B′). In crt −/− cells transfected with calreticulin expression vector, NF-AT3 is again able to translocate the nucleus after stimulation (C′). A″, B″, and C″ are phase-contrast images of the same cells. Bar, 25 μm.
Figure 11
Figure 11
Bradykinin-induced elevation of cytoplasmic Ca2+ concentration is inhibited in crt −/− cells. Wild-type and crt −/− mouse embryonic fibroblasts (MEF) were loaded with the fluorescent Ca2+ indicator fura-2. Cells were stimulated with 1 μM thapsigargin, a Ca2+-ATPase inhibitor (A), or with 200 nM bradykinin (B). Solid line shows wild-type mouse embryonic fibroblasts and the dotted line shows calreticulin (CRT)-deficient mouse embryonic fibroblasts.
Figure 12
Figure 12
A model for the proposed role of calreticulin in the regulation of cardiac development. Myogenic signal from extracellular space activates the production of IP3 that results in the release of Ca2+ from ER under the regulation of calreticulin (CRT). Increased intracellular Ca2+ binds to calmodulin (CaM) and activates calcineurin (CaN). CaN dephosphorylates NF-AT that translocates to the nucleus. In the nucleus NF-AT forms complexes with the GATA-4 transcription factors leading to activation of transcription of genes essential for cardiac development (Molkentin et al., 1998).

References

    1. Andrin C, Pinkoski MJ, Burns K, Atkinson EA, Krahenbuhl O, Hudig D, Fraser SA, Winkler U, Tschopp J, Opas M, et al. Interaction between a Ca2+binding protein calreticulin and perforin, a component of the T-cell granules. Biochemistry. 1998;37:10386–10394. - PubMed
    1. Ausubel, F.M., R.E. Kingston, D.D. Moore, J.G. Seidman, J.A. Smith, and K. Struhe. 1989. Current Protocols in Molecular Biology. Vol. 1–3. John Wiley & Sons, Inc., New York.
    1. Baksh S, Michalak M. Expression of calreticulin in Escherichia coli and identification of its Ca2+binding domains. J Biol Chem. 1991;266:21458–21465. - PubMed
    1. Bastianutto C, Clementi E, Codazzi F, Podini P, De Giorgi F, Rizzuto R, Meldolesi J, Pozzan T. Overexpression of calreticulin increases the Ca2+ capacity of rapidly exchanging Ca2+stores and reveals aspects of their lumenal microenvironment and function. J Cell Biol. 1995;130:847–855. - PMC - PubMed
    1. Brillantes AB, Ondrias K, Scott A, Kobrinsky E, Ondriasova E, Moschella MC, Jayaraman T, Lander M, Ehrlich BE, Marks AR. Stabilization of calcium release channel (ryanodine receptor) function by FK506-binding protein. Cell. 1994;77:513–523. - PubMed

Publication types

MeSH terms