. 1999 Mar 8;144(5):977-87.
doi: 10.1083/jcb.144.5.977.

Microtubule dynamics from mating through the first zygotic division in the budding yeast Saccharomyces cerevisiae

Affiliations

Microtubule dynamics from mating through the first zygotic division in the budding yeast Saccharomyces cerevisiae

P Maddox et al. J Cell Biol. .

Abstract

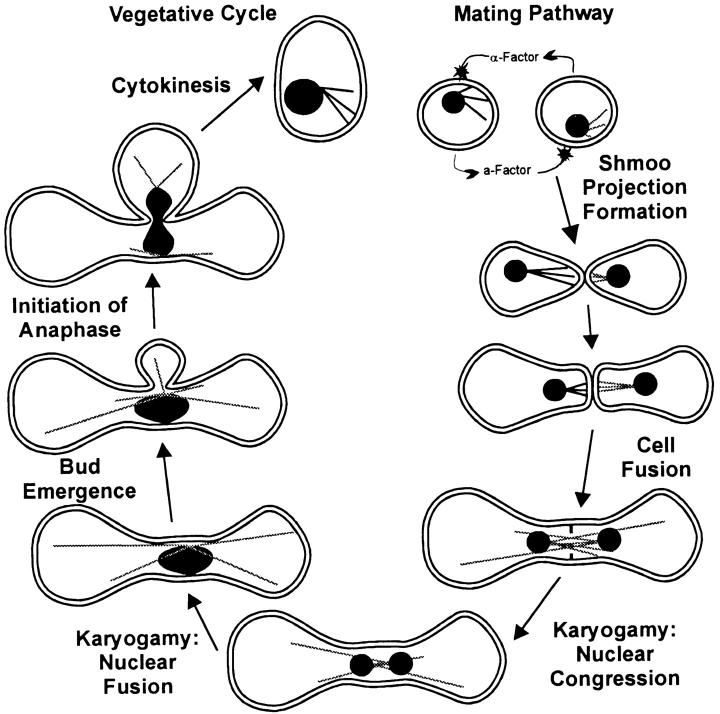
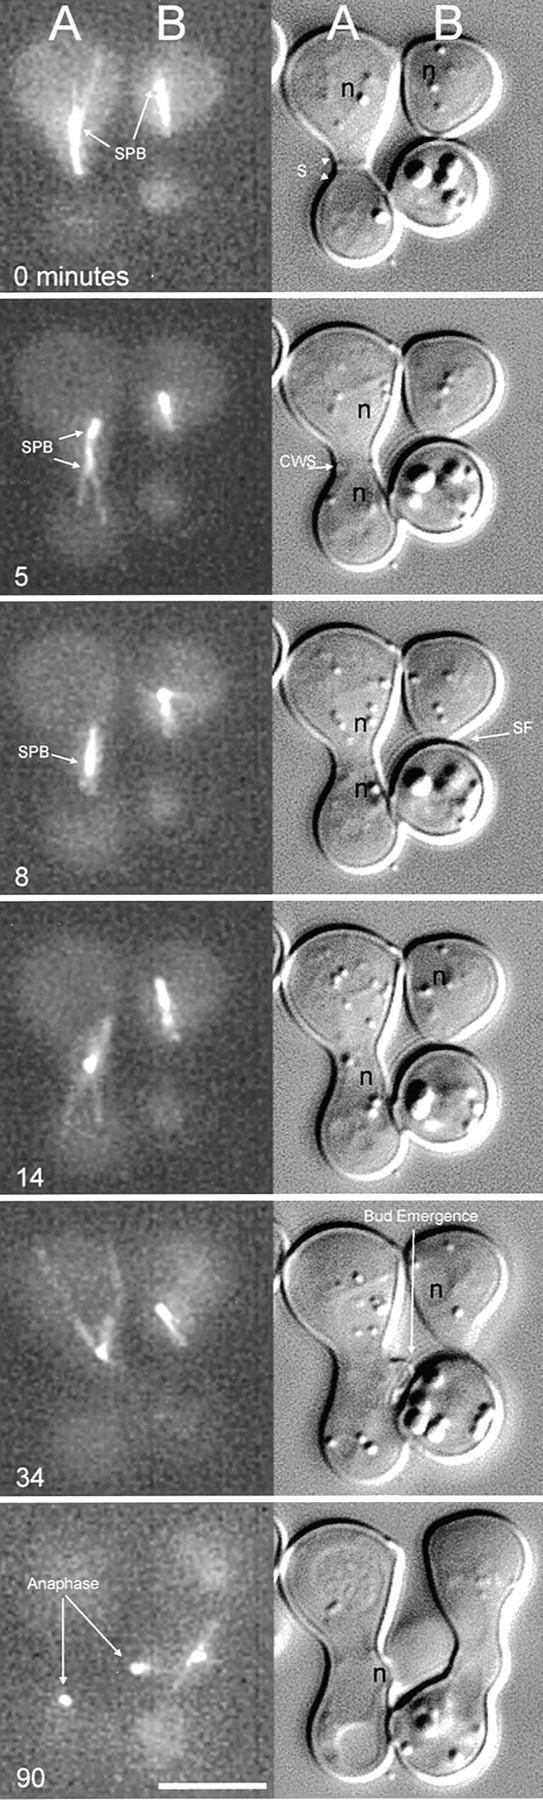
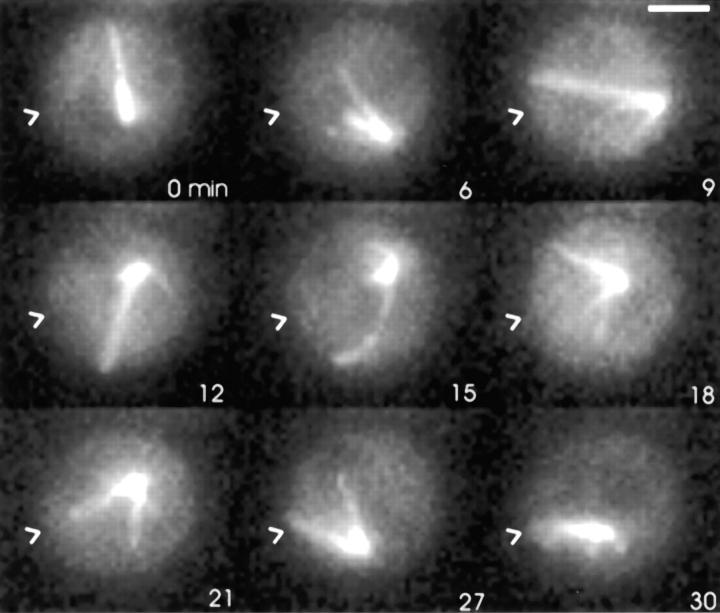
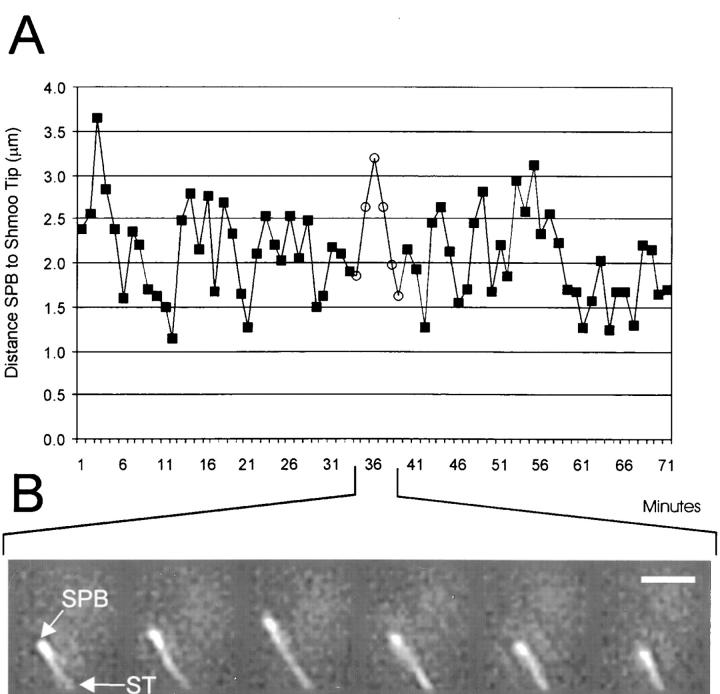
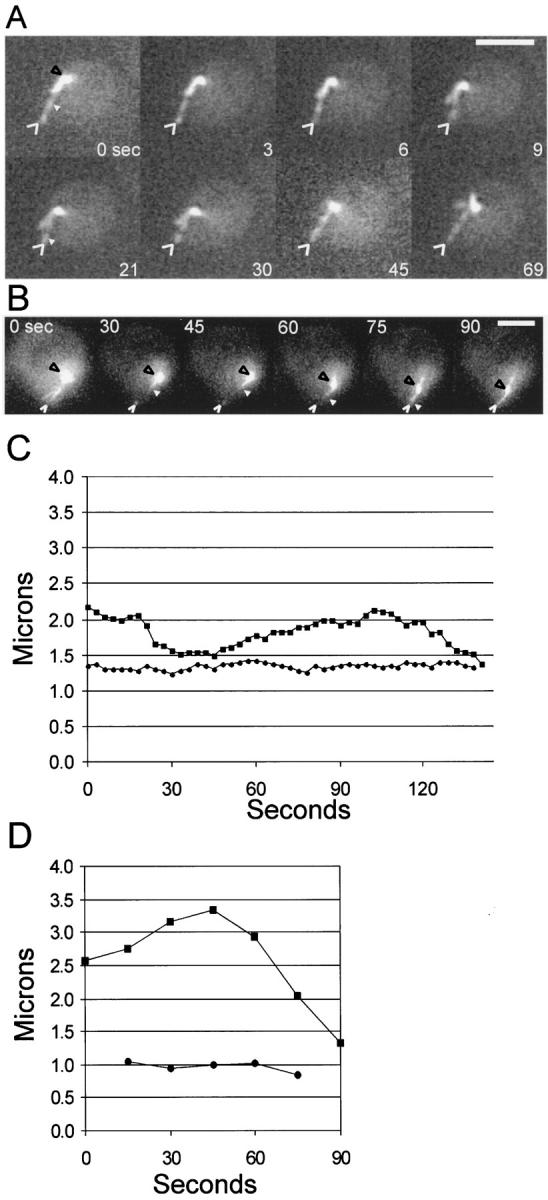
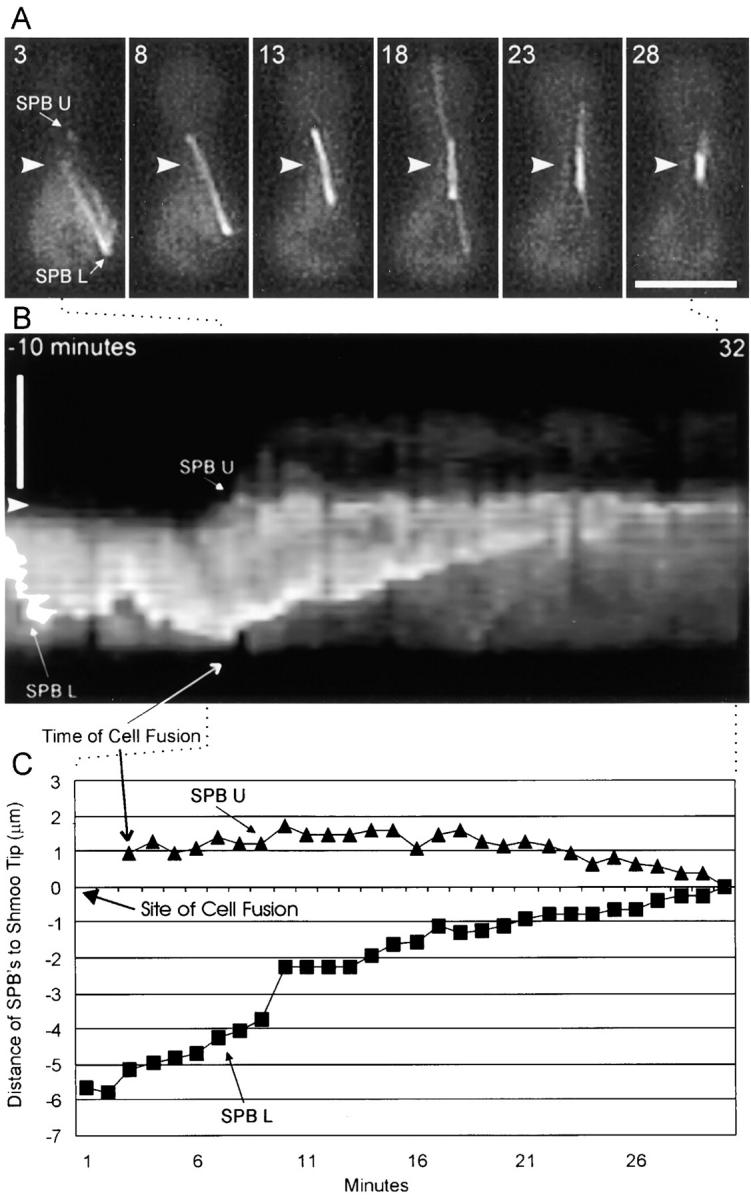
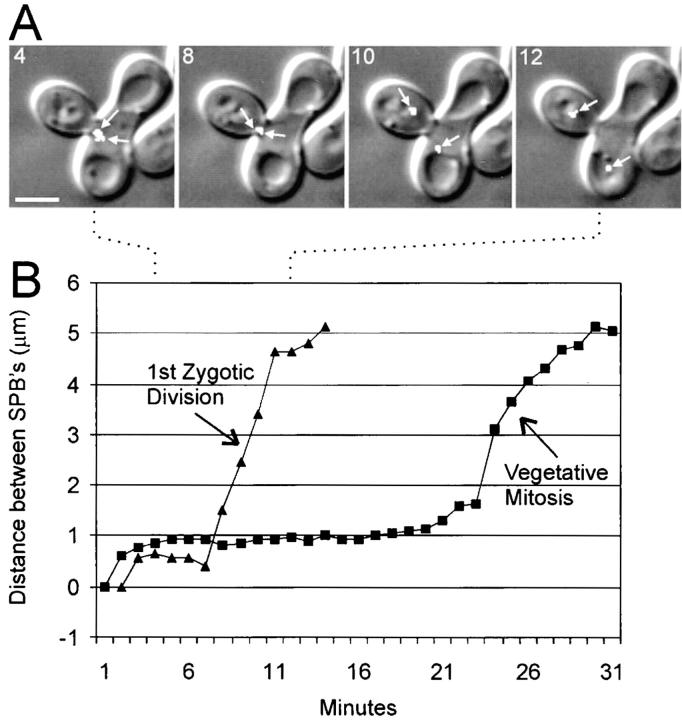
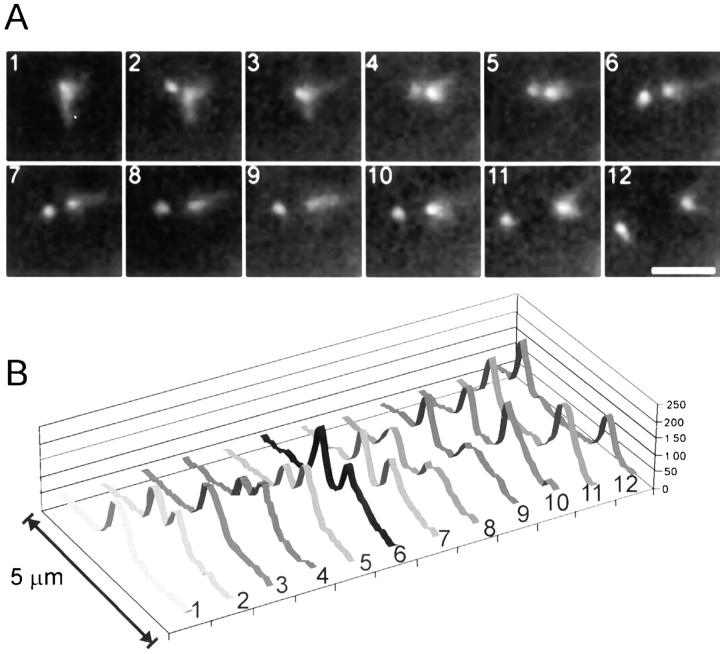
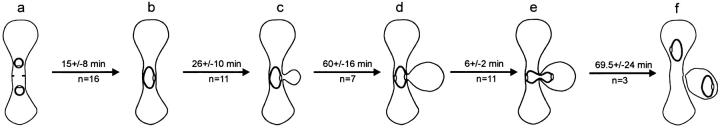
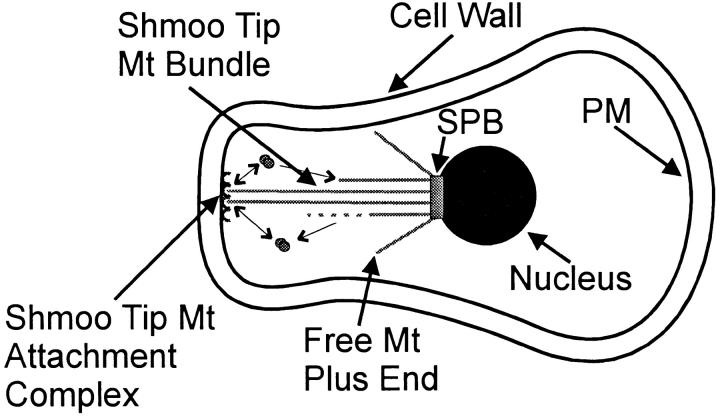
We have used time-lapse digital imaging microscopy to examine cytoplasmic astral microtubules (Mts) and spindle dynamics during the mating pathway in budding yeast Saccharomyces cerevisiae. Mating begins when two cells of opposite mating type come into proximity. The cells arrest in the G1 phase of the cell cycle and grow a projection towards one another forming a shmoo projection. Imaging of microtubule dynamics with green fluorescent protein (GFP) fusions to dynein or tubulin revealed that the nucleus and spindle pole body (SPB) became oriented and tethered to the shmoo tip by a Mt-dependent search and capture mechanism. Dynamically unstable astral Mts were captured at the shmoo tip forming a bundle of three or four astral Mts. This bundle changed length as the tethered nucleus and SPB oscillated toward and away from the shmoo tip at growth and shortening velocities typical of free plus end astral Mts (approximately 0.5 micrometer/min). Fluorescent fiduciary marks in Mt bundles showed that Mt growth and shortening occurred primarily at the shmoo tip, not the SPB. This indicates that Mt plus end assembly/disassembly was coupled to pushing and pulling of the nucleus. Upon cell fusion, a fluorescent bar of Mts was formed between the two shmoo tip bundles, which slowly shortened (0.23 +/- 0.07 micrometer/min) as the two nuclei and their SPBs came together and fused (karyogamy). Bud emergence occurred adjacent to the fused SPB approximately 30 min after SPB fusion. During the first mitosis, the SPBs separated as the spindle elongated at a constant velocity (0.75 micrometer/min) into the zygotic bud. There was no indication of a temporal delay at the 2-micrometer stage of spindle morphogenesis or a lag in Mt nucleation by replicated SPBs as occurs in vegetative mitosis implying a lack of normal checkpoints. Thus, the shmoo tip appears to be a new model system for studying Mt plus end dynamic attachments and much like higher eukaryotes, the first mitosis after haploid cell fusion in budding yeast may forgo cell cycle checkpoints present in vegetative mitosis.


Figures

Figure 1
Figure 1
A diagram of the stages of the mating pathway and first mitosis in budding yeast. The stages are derived from previous fixed time point assays (Marsh and Rose, 1997) and here in living cells using dynein–GFP (astral Mts) Nuf2–GFP (SPBs), GFP– tubulin (spindles), and DIC multimode time-lapse microscopy.
Figure 2
Figure 2
Composite view of the mating process and first division as seen by time-lapse multimode microscopy. Each panel contains a maximum intensity projection image of dynein–GFP (left, see Materials and Methods) and the corresponding DIC image (right). Two pairs of mating cells (A and B) are shown. In each case, the top cell contains dynein–GFP, whereas the bottom cell does not before mating. At t = 0 min, each cell in the A pair has well-developed shmoos. The mating pair is beginning the polarization process as evident by the astral Mts in the top cell (B). t = 5 min shows the A pair undergoing cell fusion. Dynein–GFP becomes distributed to all zygotic Mts and both SPBs. The CWS can be seen in the DIC image at the 5-min time point; however, the membranes must have fused based on the distribution of dynein–GFP in the lower partner cell. The top B cell is maintaining the shmoo tip Mt bundle attachment and therefore maintaining nuclear orientation toward the shmoo tip. At t = 8 min, the SPBs of the A pair have congressed and are no longer resolvable as two fluorescent spots; the nuclei appear to still be separate in the DIC image. The B pair is undergoing shmoo formation (SF) as is evident in DIC. At t = 14 min, the nuclei of the A mating pair have completed karyogamy, forming one nucleus and the astral Mts are extending throughout the zygote, exhibiting dynamic instability (see Table I for dynamic parameters). The B pair is still in the shmoo formation stage with the astral Mts of the dynein– GFP expressing cell clearly maintaining nuclear orientation to the shmoo tip. At t = 34 min, a bud can be seen emerging from the A mating pair zygote. The SPB remained at the site of cell fusion and was never seen to traverse around the zygote as observed in vegetative G1 cells. At t = 90 min, anaphase is underway in the A zygote. The B pair has now fused to form a zygote and the SPBs have congressed as seen previously for the 8-min time point in the A pair. Bar, 5 μm.
Figure 3
Figure 3
Astral Mts orient to the shmoo tip by a search and capture mechanism. A mixture of MATa and dynein–GFP containing MATα cells were observed by time-lapse multimode microscopy. The cell pictured was observed from completion of mitosis (therefore before initiating the mating response) to the end of karyogamy. Arrowheads point to the site of shmoo growth. Bar, 2 μm.
Figure 4
Figure 4
(A) Graph of a representative example of SPB oscillations toward and away from the shmoo tip which are coupled to the shortening and growth of the shmoo tip bundle of astral Mts. The distance from SPB to shmoo tip is plotted on the y-axis and time in mins is plotted along the x-axis. Open circles indicate time points used for images in B. Measurements were repeated three times and differed by less than 0.15 μm (data not shown). (B) Projection images (see text) of dynein–GFP for time points corresponding to mins 34–39 (open circles) on graph in A. SPB, spindle pole body; ST, shmoo tip. Bar, 2 μm.
Figure 5
Figure 5
Shmoo tip Mt bundles dynamically grow and shorten at their plus ends. (A) A shmooing haploid cell containing GFP–tubulin. Fluorescent speckles (see text) are visible (white arrowhead) in the shmoo tip Mt bundle. Black arrowheads point to the SPB and the open white arrowheads point to the shmoo tip. Eight images are shown from a time-lapse sequence of 3-s intervals. (B) Photomarking of the shmoo tip Mt bundle. A photobleached mark was made using the 488-nm line from an argon laser as described in the text. Shown are six images (processed as described in the text). Black arrowhead points to the SPB, white arrowhead points to the edge of the mark closest to the SPB, and the open white arrowhead points to the shmoo tip. The laser was targeted midway between the white arrowhead and the open white arrowhead. (C) Graph of the distance of shmoo tip and the FSM (see text) fiduciary mark seen in (A, small arrowhead in 0- and 21-s frames) relative to the SPB over time. Squares represent the distance between the SPB and the shmoo tip, whereas circles represent distance from the SPB to the fluorescent speckle. (D) Graph of relative movements in B. Squares represent the distance between the SPB and the shmoo tip, circles show the distance between the SPB and the edge of the mark (small white arrowhead in B). Bars: (A) 2 μm; (B) 3 μm.
Figure 6
Figure 6
Cell fusion and Mt-mediated SPB congression during the mating process. (A) Six time points are shown at 5-min intervals of dynein–GFP. The 3-min time point shows a mating pair as cell fusion is occurring. The SPBs from both cells (SPB of the nonexpressing partner cell is SPB U and SPB of the dynein–GFP expressing cell is SPB L) are visible. Only the bottom cell contained dynein–GFP before membrane fusion. Arrowhead marks the CWS in A and B as seen in corresponding DIC images (data not shown). (B) Kymograph made by taking a 4-pixel wide linescan over time along the long axis of the mating cells. The linescan was placed along the overlapping Mt bundle in frame 8 and spanned the entire frame. The orientation and length of the linescan was constant for each frame. The cells are in the same orientation as in A. Time proceeds from −10 min to 32 min (left to right) with reference to the graph in C. Arrowhead indicates site of CWS (as in A). Intensity fluctuations seen in the kymograph are mainly due to lateral movement of the bundle away from the linescan over time. (C) Graph of the distance of SPB U (triangles) and SPB L (squares) to the cell wall septum (0 on the y-axis). Before cell fusion, only SPB L was visible. Dotted lines connecting A and C to B approximate what portions of the kymograph are represented in A and C. Bars, 5 μm.
Figure 7
Figure 7
Anaphase of the first zygotic division occurs without a pause at the 1–2 μm stage of spindle elongation. (A) Overlay of Nuf2–GFP (arrows point to separated poles as seen by Z series analysis) and DIC in a zygote undergoing mitosis for the first time after diploid formation. Time in min is shown in the upper left corner of each panel. (B) Graph of spindle elongation in the zygote shown in A as compared with spindle elongation in vegetative mitosis (images not shown). See Fig. 9 for statistical information. Bar, 3 μm.
Figure 8
Figure 8
Dynein–GFP decorates both SPBs immediately after SPB separation. (A) Sequential projection images at 1-min intervals of dynein–GFP fluorescence during SPB separation of the first division after zygote formation. (B) Graph showing linescans through the axis of the spindle in each of the frames shown in A. The scale on the z axis is arbitrary fluorescence units. Frame three appears as one SPB because of rotation of the spindle axis placing the two SPBs in the same x, y position, but separated in z by ∼1 μm. Bar, 2 μm.
Figure 9
Figure 9
The timing of events during the mating process through karyogamy and first division in wild-type cells. The stages are: (a) cell fusion, (b) SPB fusion, (c) bud emergence, (d) SPB separation, (e) anaphase onset, and (f) cell separation. The elapsed times are averages with standard deviations of n observations of each stage.
Figure 10
Figure 10
Enlarged view of a prezygotic mating cell after the nucleus has become tethered to the shmoo tip by a bundle of astral Mts. PM, plasma membrane; SPB, spindle pole body; Mt, microtubule. Small arrows indicate assembly/disassembly at the plus ends of the bundle of astral Mts.

Similar articles

Cited by

References

    1. Beinhauer JD, Hagan IM, Hegemann J, Fleig U. Mal3, the fission yeast homologue of the human APC-interacting protein EB-1 is required for microtubule integrity and the maintenance of the cell form. J Cell Biol. 1997;139:717–728. - PMC - PubMed
    1. Bi E, Maddox P, Lew DJ, Salmon ED, McMillan JN, Yeh E, Pringle JR. Involvement of an actomyosin contractile ring in Saccharomyces cerevisiaecytokinesis. J Cell Biol. 1998;142:1301–1312. - PMC - PubMed
    1. Brinkley RR. Microtubule organizing centers. Ann Rev Cell Biol. 1985;1:145–172. - PubMed
    1. Byers, B. 1981. Cytology of the yeast life cycle. In The Molecular Biology of the Yeast Saccharomyces: Life Cycle and Inheritance. J. Strachern, E.W. Jones, and J.R. Broach, eds. Cold Spring Harbor Laboratory Press, Cold Spring Harbor, NY. 59–96.
    1. Byers B, Goetsch L. Behavior of spindles and spindle plaques in the cell cycle and conjugation of Saccharomyces cerevisiae. . J Bacteriol. 1975;124:511–523. - PMC - PubMed

Publication types

MeSH terms