. 1999 Mar 8;144(5):1019-31.
doi: 10.1083/jcb.144.5.1019.

Protein tyrosine phosphatase-PEST regulates focal adhesion disassembly, migration, and cytokinesis in fibroblasts

Affiliations

Protein tyrosine phosphatase-PEST regulates focal adhesion disassembly, migration, and cytokinesis in fibroblasts

A Angers-Loustau et al. J Cell Biol. .

Abstract

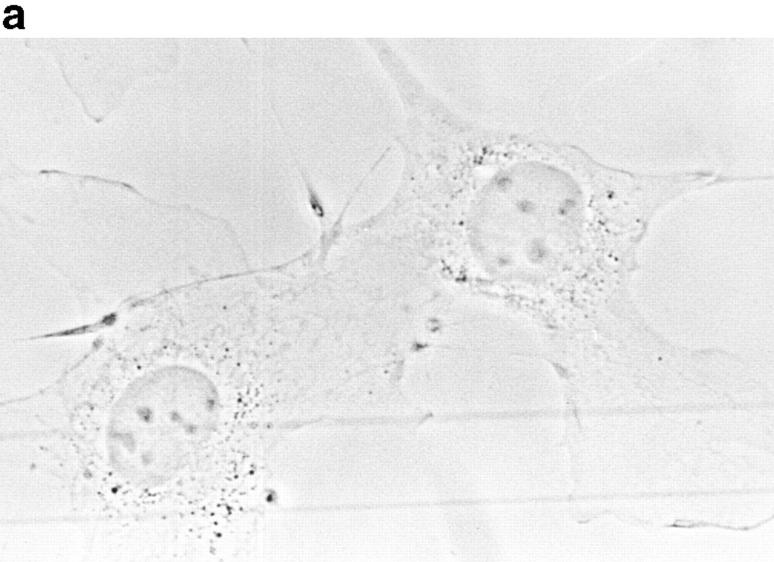
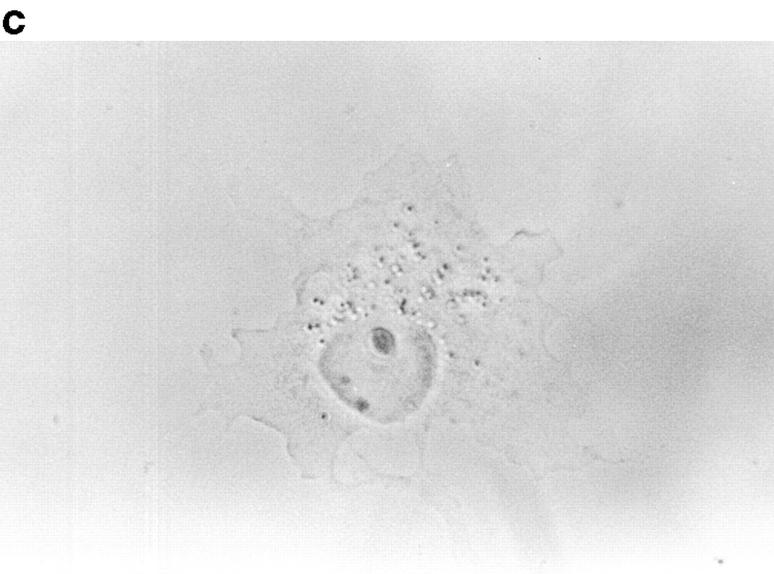
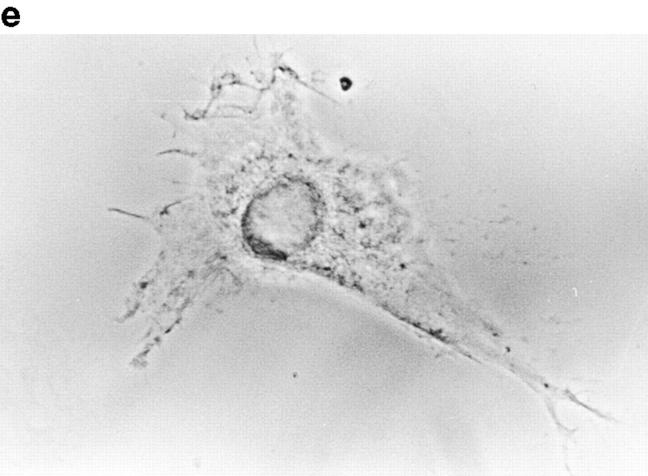
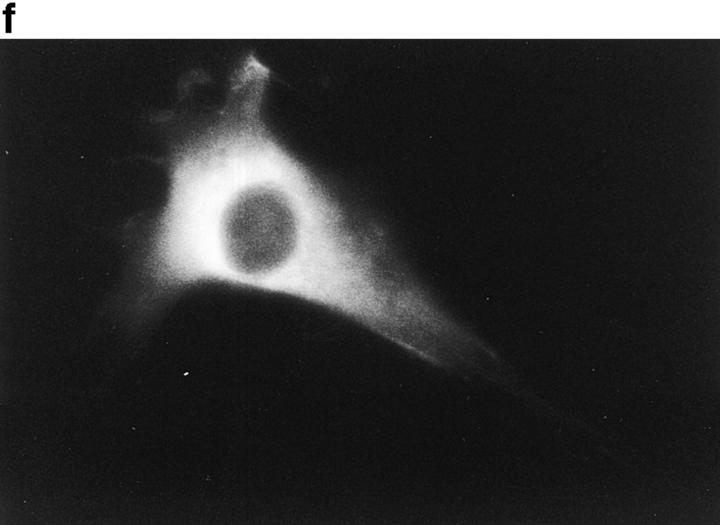
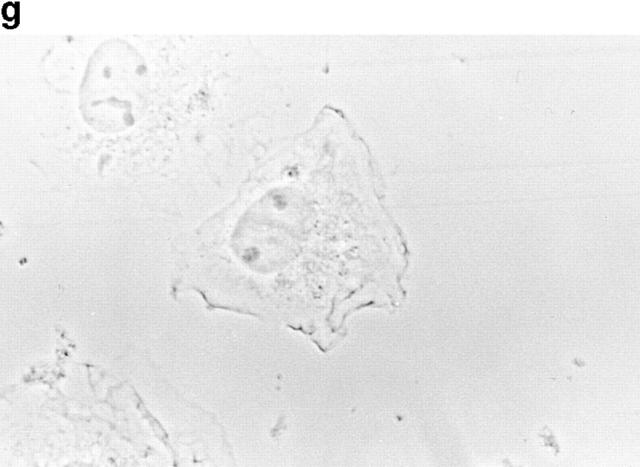
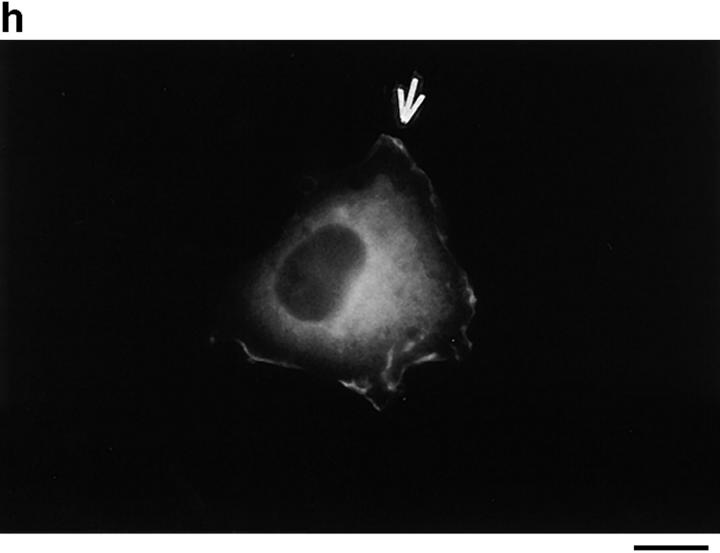
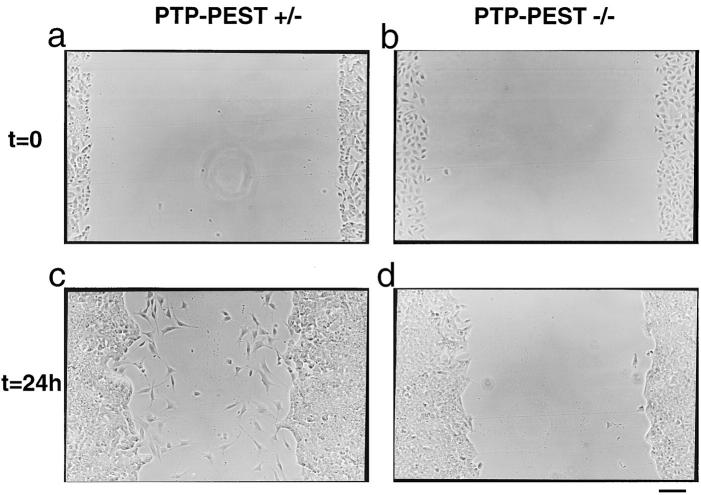
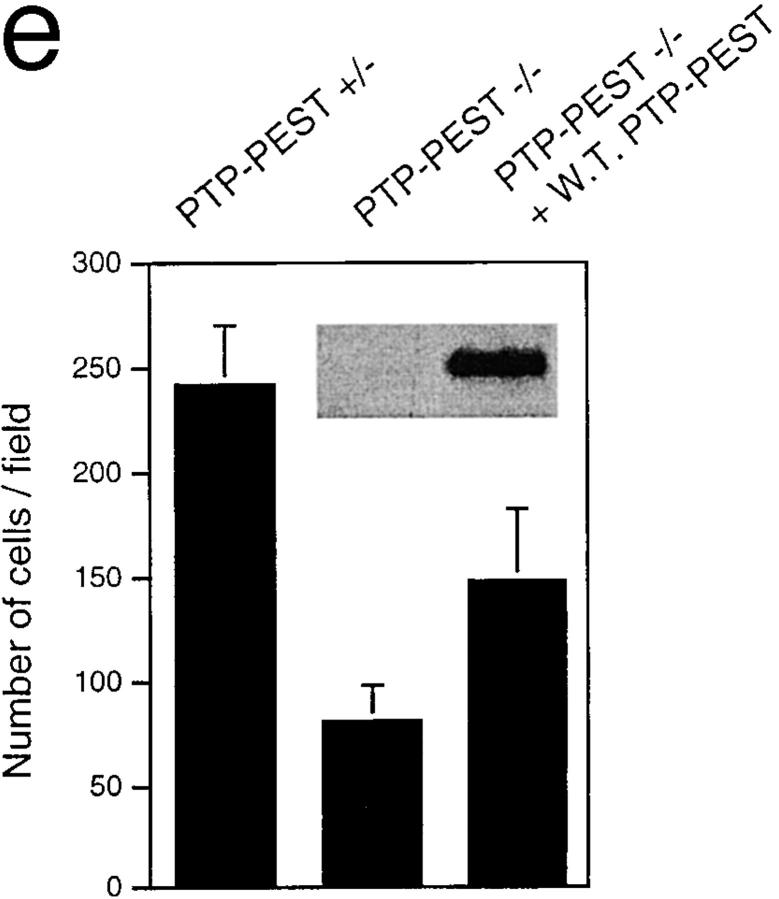
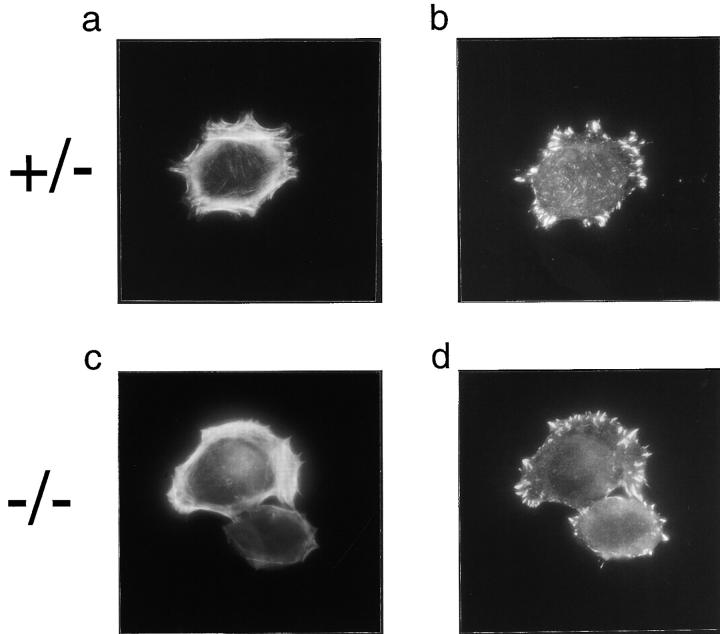
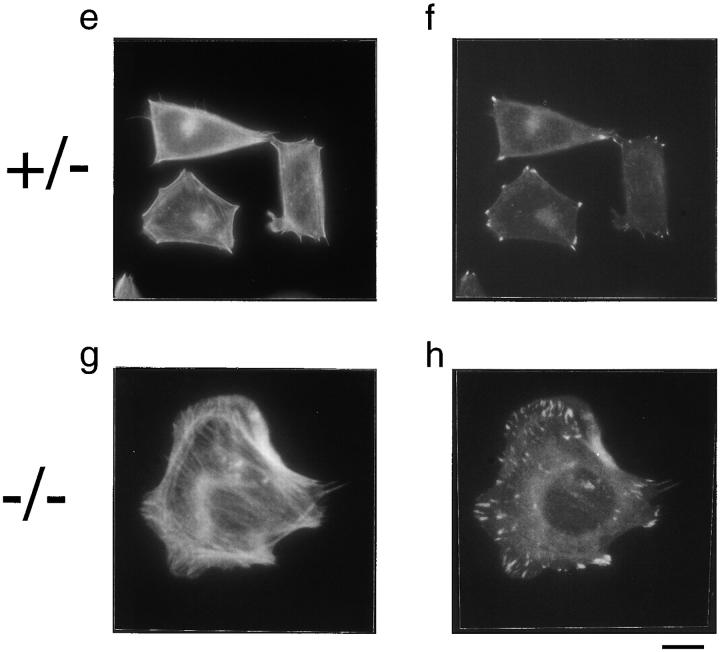
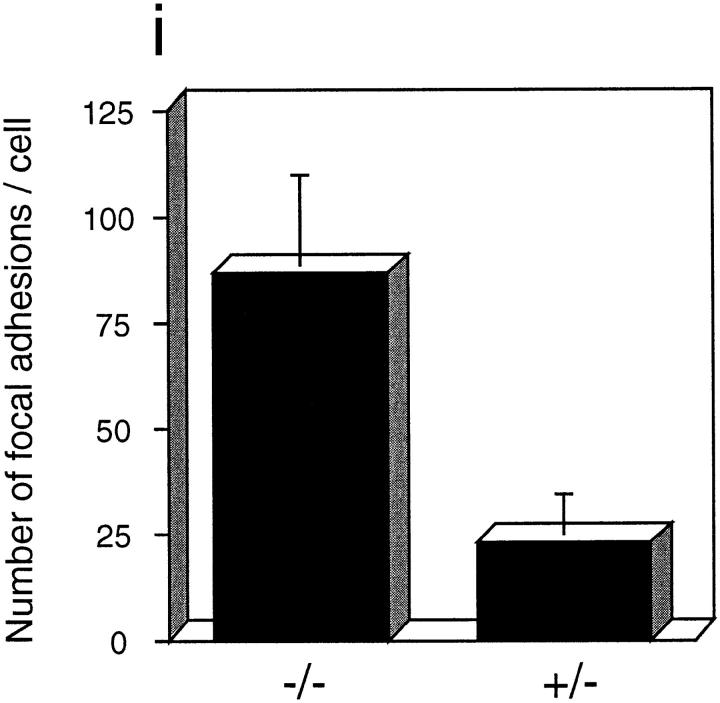
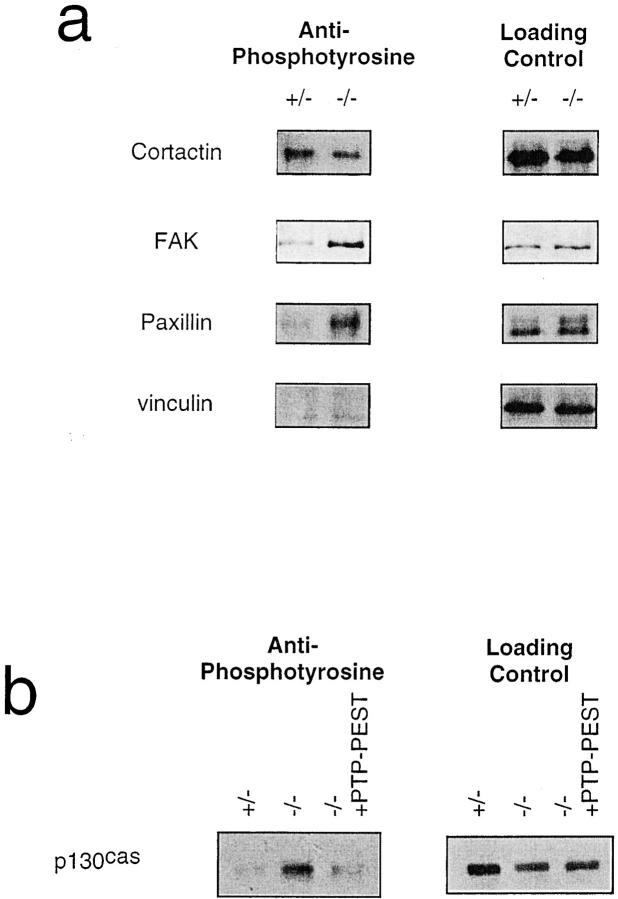
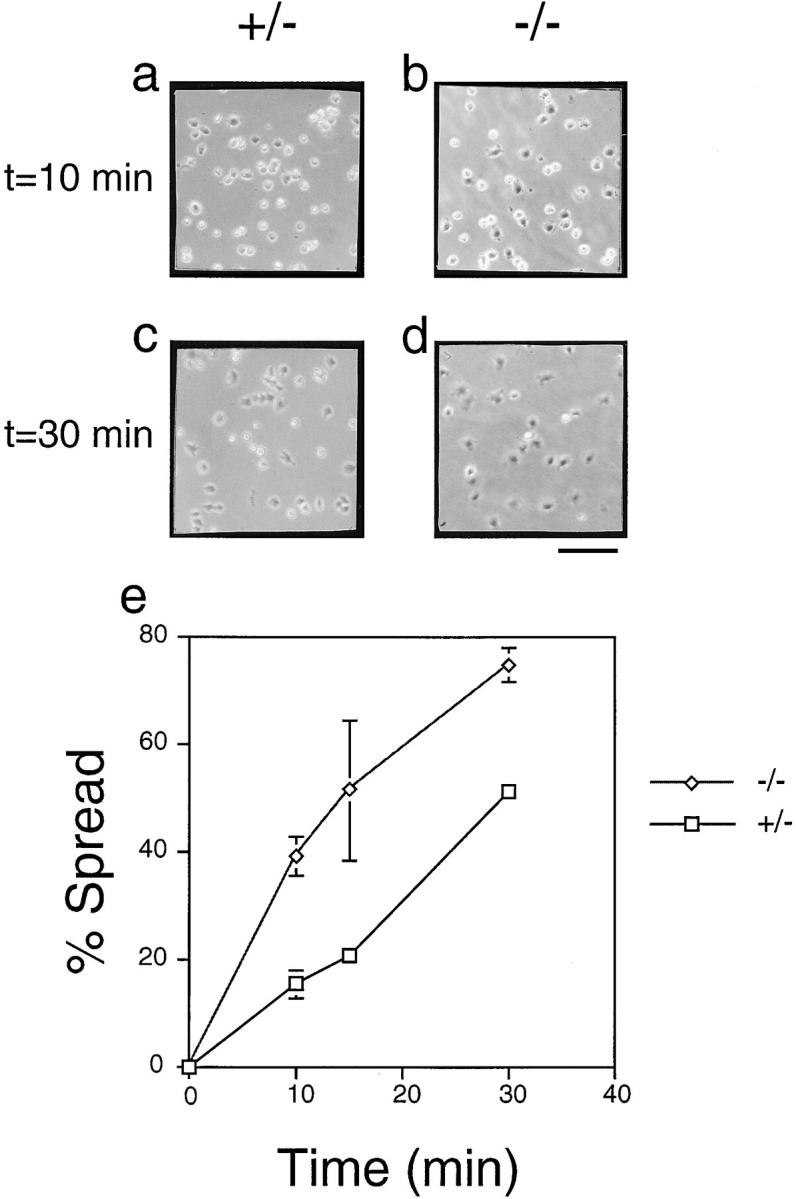
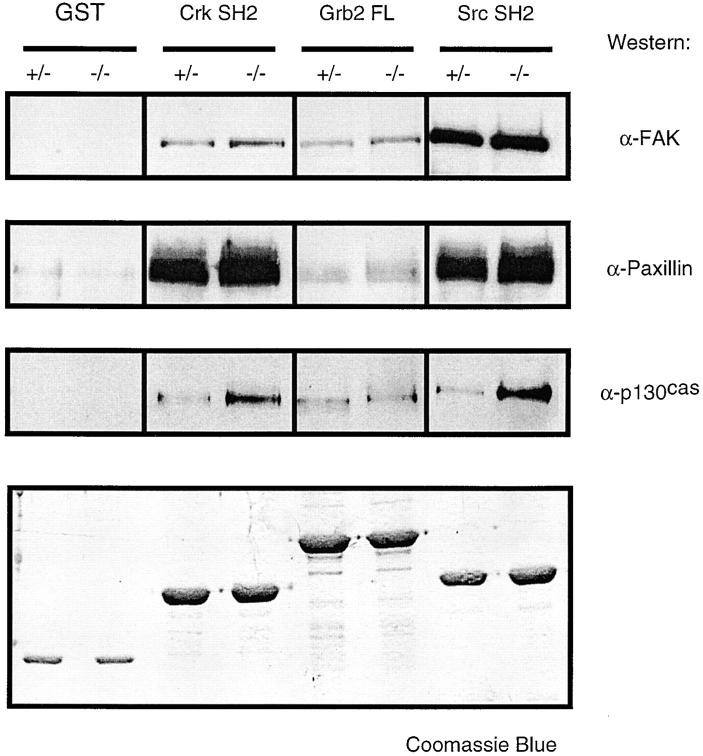
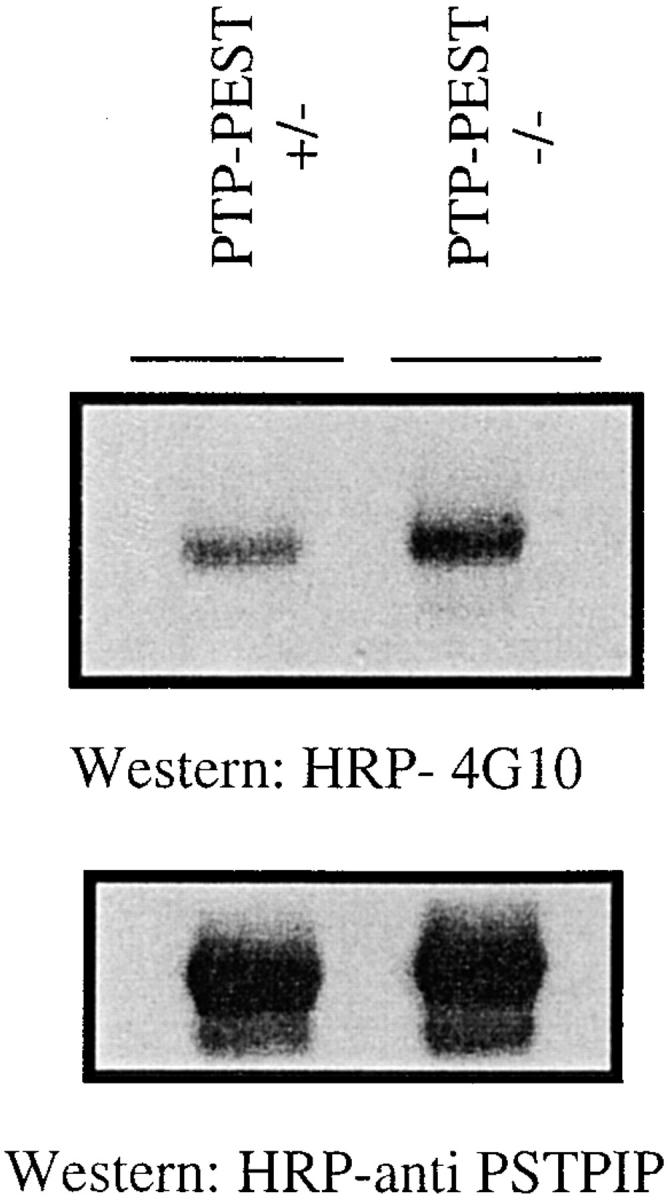
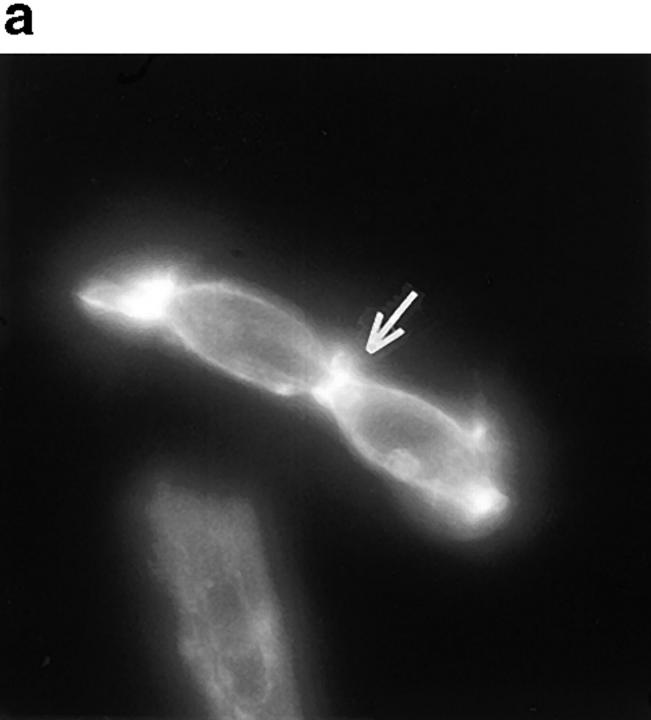
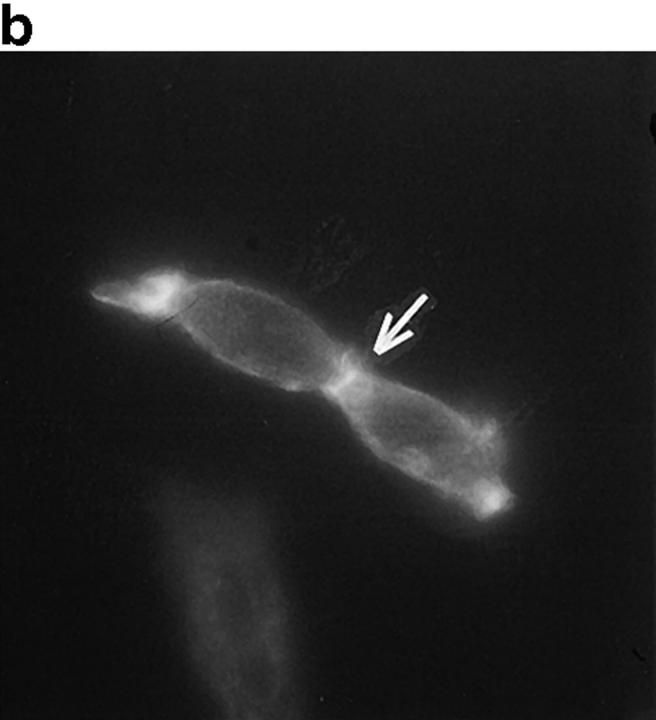
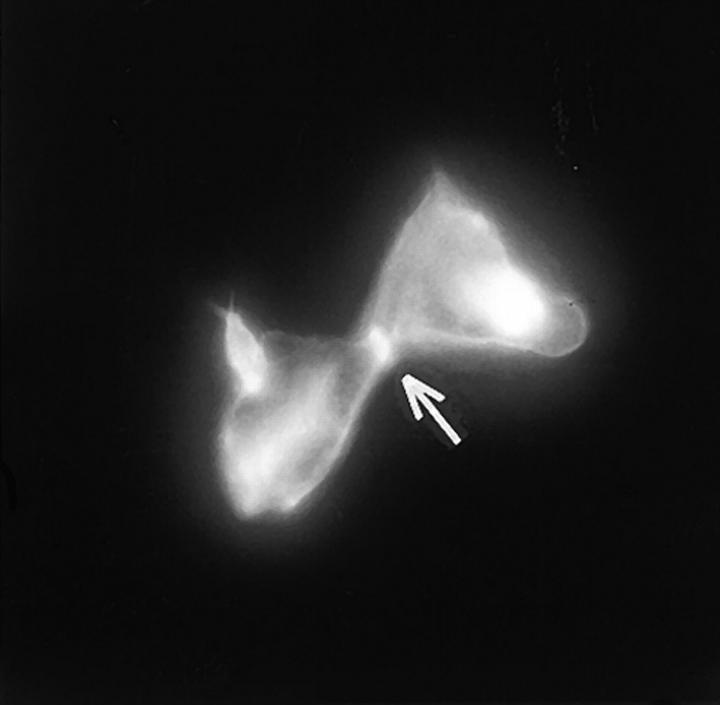
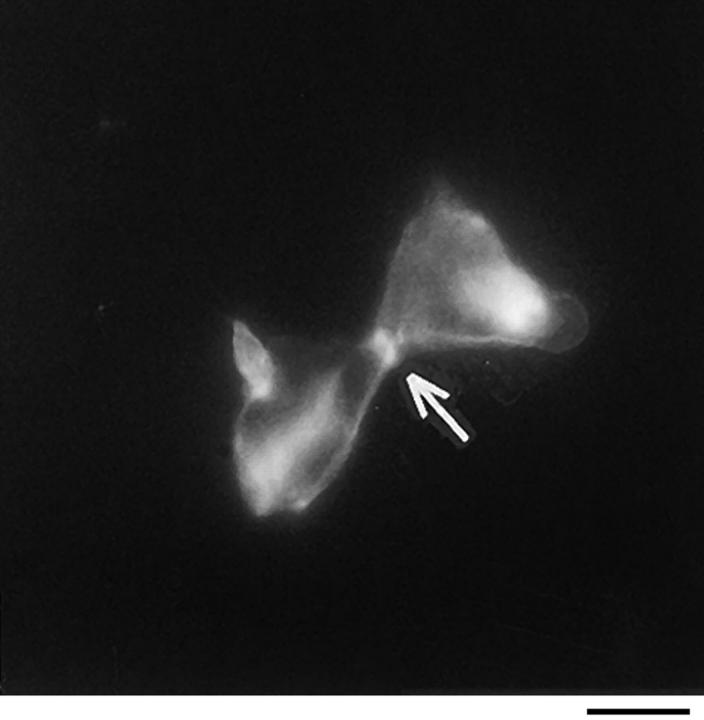
In this article, we show that, in transfected COS-1 cells, protein tyrosine phosphatase (PTP)-PEST translocates to the membrane periphery following stimulation by the extracellular matrix protein fibronectin. When plated on fibronectin, PTP-PEST (-/-) fibroblasts display a strong defect in motility. 3 h after plating on fibronectin, the number and size of vinculin containing focal adhesions were greatly increased in the homozygous PTP-PEST mutant cells as compared with heterozygous cells. This phenomenon appears to be due in part to a constitutive increase in tyrosine phosphorylation of p130(CAS), a known PTP-PEST substrate, paxillin, which associates with PTP-PEST in vitro, and focal adhesion kinase (FAK). Another effect of this constitutive hyperphosphorylation, consistent with the focal adhesion regulation defect, is that (-/-) cells spread faster than the control cell line when plated on fibronectin. In the PTP-PEST (-/-) cells, an increase in affinity for the SH2 domains of Src and Crk towards p130(CAS) was also observed. In (-/-) cells, we found a significant increase in the level of tyrosine phosphorylation of PSTPIP, a cleavage furrow-associated protein that interacts physically with all PEST family members. An effect of PSTPIP hyperphosphorylation appears to be that some cells remain attached at the site of the cleavage furrow for an extended period of time. In conclusion, our data suggest PTP-PEST plays a dual role in cell cytoskeleton organization, by promoting the turnover of focal adhesions required for cell migration, and by directly or indirectly regulating the proline, serine, threonine phosphatase interacting protein (PSTPIP) tyrosine phosphorylation level which may be involved in regulating cleavage furrow formation or disassembly during normal cell division.


Figures

Figure 1
Figure 1
PTP-PEST translocates to the membrane periphery following fibronectin stimulation of COS-1 cells. a, c, e, and g are phase-contrast images while b, d, f, and h are HA epitope indirect immunofluorescence. (a and b) Untransfected cells. (c and d) Transfected, unstimulated cells. (e and f) Transfected cells starved for 16 h in 0.1% serum, then stimulated for 10 min with 100 ng/ml of EGF. (g and h) Transfected cells plated on fibronectin slides for 45 min before fixing and staining (see Materials and Methods). The arrow in h shows an example of membrane periphery translocation of the immunofluorescence staining. Bar, 20 μm.
Figure 1
Figure 1
PTP-PEST translocates to the membrane periphery following fibronectin stimulation of COS-1 cells. a, c, e, and g are phase-contrast images while b, d, f, and h are HA epitope indirect immunofluorescence. (a and b) Untransfected cells. (c and d) Transfected, unstimulated cells. (e and f) Transfected cells starved for 16 h in 0.1% serum, then stimulated for 10 min with 100 ng/ml of EGF. (g and h) Transfected cells plated on fibronectin slides for 45 min before fixing and staining (see Materials and Methods). The arrow in h shows an example of membrane periphery translocation of the immunofluorescence staining. Bar, 20 μm.
Figure 2
Figure 2
Gene targeting of the PTP-PEST suppresses fibroblast motility on the extracellular matrix fibronectin. Monolayers of each cell line were wounded (a and b) and maintained at 37°C for 24 h before fixing (c and d). The ability to migrate into the wound was monitored by phase-contrast microscopy of unstained cells which were photographed (×100). The aspect of each wound represents the typical result obtained after five independent experiments. In a chamber-type assay (e), the bottom side of the polycarbonate membrane was coated with fibronectin, and 105 cells were added to the top chamber. After 5 h, the cells that translocated to the bottom side of the membrane were counted and the result is shown as an average of eight fields from four independent experiments (error bars: standard deviation). PTP-PEST (−/−) cells stably overexpressing wild-type PTP-PEST were also tested by the same method. (Inset) Western blotting against PTP-PEST in the two cell lines. The band that appears represents overexpression since the antibody is known not to detect endogenous levels of PTP-PEST. Bar, 200 μm.
Figure 2
Figure 2
Gene targeting of the PTP-PEST suppresses fibroblast motility on the extracellular matrix fibronectin. Monolayers of each cell line were wounded (a and b) and maintained at 37°C for 24 h before fixing (c and d). The ability to migrate into the wound was monitored by phase-contrast microscopy of unstained cells which were photographed (×100). The aspect of each wound represents the typical result obtained after five independent experiments. In a chamber-type assay (e), the bottom side of the polycarbonate membrane was coated with fibronectin, and 105 cells were added to the top chamber. After 5 h, the cells that translocated to the bottom side of the membrane were counted and the result is shown as an average of eight fields from four independent experiments (error bars: standard deviation). PTP-PEST (−/−) cells stably overexpressing wild-type PTP-PEST were also tested by the same method. (Inset) Western blotting against PTP-PEST in the two cell lines. The band that appears represents overexpression since the antibody is known not to detect endogenous levels of PTP-PEST. Bar, 200 μm.
Figure 3
Figure 3
Actin and focal adhesions staining in PTP-PEST (+/−) (a, b, e, and f) and (−/−) (c, d, g, and h) cells plated on fibronectin. After 20 min (a–d), there are no qualitative differences on the actin filaments, stained using a rhodamine-phalloidin conjugate (a and c) or in focal adhesions, stained with an antivinculin antibody and highlighted using a FITC-conjugated second antibody (b and d). However, when the cells were left for 3 h before fixing, the (+/−) cells became rounded (e) and only formed punctual focal adhesions at their periphery (f), whereas the (−/−) cells continued to spread, forming numerous stress fibers (g), and numerous focal adhesion plaques scattered throughout their ventral surface (h). The number of focal adhesions after 3 h in each cell was counted from photographs and the results are shown in i. Bar, 20 μm.
Figure 3
Figure 3
Actin and focal adhesions staining in PTP-PEST (+/−) (a, b, e, and f) and (−/−) (c, d, g, and h) cells plated on fibronectin. After 20 min (a–d), there are no qualitative differences on the actin filaments, stained using a rhodamine-phalloidin conjugate (a and c) or in focal adhesions, stained with an antivinculin antibody and highlighted using a FITC-conjugated second antibody (b and d). However, when the cells were left for 3 h before fixing, the (+/−) cells became rounded (e) and only formed punctual focal adhesions at their periphery (f), whereas the (−/−) cells continued to spread, forming numerous stress fibers (g), and numerous focal adhesion plaques scattered throughout their ventral surface (h). The number of focal adhesions after 3 h in each cell was counted from photographs and the results are shown in i. Bar, 20 μm.
Figure 4
Figure 4
(a) Constitutive hyperphosphorylation of FAK and paxillin in PTP-PEST (−/−) cells. Left column shows extent of tyrosine phosphorylation of immunoprecipitates as detected by the 4G10 antiphosphotyrosine mAb; right column shows evaluation of the amount of protein loaded using the same antibody as the immunoprecipitation. (b) Rescue of p130CAS hyperphosphorylation in PTP-PEST (−/−) overexpressing wild-type PTP-PEST. p130CAS was already shown to be a substrate for PTP-PEST (Garton et al., 1996) and to be hyperphosphorylated in the PEST (−/−) cells (Côté et al., 1998). Left panel shows phosphorylation levels of p130CAS in each cell line; right panel shows loading control.
Figure 5
Figure 5
Analysis of cell spreading following PTP-PEST targeting in fibroblasts. Both PTP-PEST (+/−) and (−/−) were allowed to spread on fibronectin-coated tissue culture dishes, and the number of spread cells was assayed after 10, 15, and 30 min. Phase-contrast of random fields after 10 (a and b) and 30 (c and d) min are shown for PTP-PEST (+/−; a and c) and PTP-PEST (−/−; b and d) cells. PTP-PEST (−/−) cells showed significantly higher cell spreading. A quantitative evaluation was expressed as the number of cells spread as a percentage of the total number of cells in the field (e). Average number of cells per field: 300; n = 8. Error bars represent the standard deviation of the mean. Bar, 200 μm.
Figure 6
Figure 6
Constitutive interactions of FAK, paxillin, and p130CAS with the SH2-domains of Crk, Grb2, and Src in binding assays. TNE cell lysates were prepared from exponentially growing PTP-PEST (+/−) and PTP-PEST (−/−) cells. Lysates were incubated with the indicated GST fusion proteins coupled to glutathione-agarose as described in Materials and Methods. The precipitates were analyzed by sequential stripping and immunoblotting of the same membrane with the indicated antibodies.
Figure 7
Figure 7
Constitutive hyperphosphorylation of PSTPIP in unsynchronized PTP-PEST (−/−) cells. PSTPIP was immunoprecipitated from PTP-PEST (+/−) and PTP-PEST (−/−) cell lysates and probed with a HRP-conjugated antiphosphotyrosine antibody (top). PSTPIP was hyperphosphorylated in the (−/−) cells. (Bottom) Anti-PSTPIP blot of the same membrane to ensure equal loading of the protein.
Figure 8
Figure 8
Cytokinesis defect in PTP-PEST (−/−) cells. Unsynchronized PTP-PEST (−/−) cells were plated on uncoated tissue culture glass slides and stained using rhodamine-conjugated phalloidin to highlight the actin-rich cleavage furrows (a). An antiphosphotyrosine immunostaining of cells in the same population is shown in b. Bar, 30 μm.
Figure 8
Figure 8
Cytokinesis defect in PTP-PEST (−/−) cells. Unsynchronized PTP-PEST (−/−) cells were plated on uncoated tissue culture glass slides and stained using rhodamine-conjugated phalloidin to highlight the actin-rich cleavage furrows (a). An antiphosphotyrosine immunostaining of cells in the same population is shown in b. Bar, 30 μm.

References

    1. Akasaka T, van Leeuwen RL, Yoshinaga IG, Mihm MC, Jr, Byers HR. Focal adhesion kinase (p125FAK) expression correlates with motility of human melanoma cell lines. J Investig Dermatol. 1995;105:104–108. - PubMed
    1. Arregui CO, Balsamo J, Lilien J. Impaired integrin-mediated adhesion and signaling in fibroblasts expressing a dominant-negative mutant PTP1B. J Cell Biol. 1998;143:861–873. - PMC - PubMed
    1. Black DS, Bliska JB. Identification of p130CAS as a substrate of YersiniaYopH (Yop51), a bacterial protein tyrosine phosphatase that translocates into mammalian cells and targets focal adhesions. EMBO (Eur Mol Biol Organ) J. 1997;16:2730–2744. - PMC - PubMed
    1. Burridge K, Chrzanowska-Wodnicka M. Focal adhesions, contractility, and signaling. Annu Rev Cell Dev Biol. 1996;12:463–518. - PubMed
    1. Calalb MB, Polte TR, Hanks SK. Tyrosine phosphorylation of focal adhesion kinase at sites in the catalytic domain regulates kinase activity: a role for Src family kinases. Mol Cell Biol. 1995;15:954–963. - PMC - PubMed

Publication types

MeSH terms