Case Reports
. 1999 Apr 1;19(7):2619-27.
doi: 10.1523/JNEUROSCI.19-07-02619.1999.

Topographic organization of human visual areas in the absence of input from primary cortex

Affiliations
Case Reports

Topographic organization of human visual areas in the absence of input from primary cortex

H A Baseler et al. J Neurosci. .

Abstract

Recently, there has been evidence for considerable plasticity in primary sensory areas of adult cortex. In this study, we asked to what extent topographical maps in human extrastriate areas reorganize after damage to a portion of primary visual (striate) cortex, V1. Functional magnetic resonance imaging signals were measured in a subject (G.Y.) with a large calcarine lesion that includes most of primary visual cortex but spares the foveal representation. When foveal stimulation was present, intact cortex in the lesioned occipital lobe exhibited conventional retinotopic organization. Several visual areas could be identified (V1, V2, V3, V3 accessory, and V4 ventral). However, when stimuli were restricted to the blind portion of the visual field, responses were found primarily in dorsal extrastriate areas. Furthermore, cortex that had formerly shown normal topography now represented only the visual field around the lower vertical meridian. Several possible sources for this reorganized activity are considered, including transcallosal connections, direct subcortical projections to extrastriate cortex, and residual inputs from V1 near the margin of the lesion. A scheme is described to explain how the reorganized signals could occur based on changes in the local neural connections.


Figures

Fig. 1.
Fig. 1.
Two lesions in G.Y.’s brain. Topimages contain a three-dimensional rendering of the cortical surface near the boundary between gray and white matter, obtained from structural MRI data. Bottom images contain single slices from structural data. A, Medial aspect of G.Y.’s left hemisphere. A large lesion is visible near the location ordinarily occupied by calcarine cortex (dashed curve). The sagittal slice below shows the same lesion. B, Lateral aspect of G.Y.’s right hemisphere showing the smaller right parietal lesion (dashed curve), with a corresponding coronal image.
Fig. 2.
Fig. 2.
Measurement of G.Y.’s visual field sensitivity, using specialized visual perimetry. White area indicates normal sensitivity; gray area indicates region of visual field loss. (Modified from Barbur et al., 1993.)
Fig. 3.
Fig. 3.
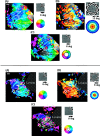
Top. Representations of a control subject’s (A.P.) unfolded left occipital cortex. The underlying gray scale image, which is mainly obscured by the overlaid activity, represents the unfolded cortex. In all images in this and Figure 4, dorsal isup, ventral is down, posterior isleft, and anterior is right. The gray scale represents the lateral–medial dimension; dark pixelsoriginate from lateral parts in the three-dimensional folded cortex, and light pixels originate from medial parts. Scale bar (inA), 1 cm. Anatomical landmarks are indicated by thestar (occipital pole) and the solid white line(fundus of the calcarine sulcus). The color overlay in each image represents the stimulus position that caused activity at each point in cortex. Color overlays are shown only at positions above the estimated noise level, a correlation of 0.2. The icons to theright of each panel indicate the stimulus type (top) and the relationship between color and visual field position (bottom). Rotating wedge stimuli spanned an 8° radius; expanding ring stimuli spanned a 13° radius. Visual area boundaries are represented by white dashed lines drawn by hand along the horizontal and vertical meridians; areas are labeled inA. Black dashed lines represent 4 and 8° eccentricity (the extent of the annular wedge), drawn based on the eccentricity map inB. A, Representation of the angular dimension mapped by the rotating full wedge stimulus. B, Representation of visual field eccentricity mapped by the expanding ring stimulus. C, Representation of the angular dimension mapped by the rotating annular wedge stimulus.
Fig. 5.
Fig. 5.
Summary of the fMRI responses within individual visual areas to the two types of rotating wedge stimulus in G.Y.’s left (damaged) occipital lobe. Each column summarizes responses from a different visual area: V1, V2, or V3. Dorsal and ventral portions of V2 and V3 are combined here. The horizontal axis represents angular position of the visual field representation as inferred from the phase of the fMRI signal. Thevertical axis indicates the number of voxels exceeding the 0.2 stimulus correlation level for each histogram bin. A, Measurements using the full wedge stimulus. Mean correlations were as follows: V1, 0.33; V2, 0.33; V3, 0.33. (See Results, Phase analyses, for explanation of mean correlation calculation.) B, Measurements using the annular wedge stimulus. Mean correlations were as follows: V1, 0.16; V2, 0.22; V3, 0.26.
Fig. 6.
Fig. 6.
Summary of the fMRI responses within individual visual areas to the two types of rotating wedge stimulus in the left occipital lobe of the control subject A.P. Details are as in Figure 5.A, Measurements using the full wedge stimulus. Mean correlations were as follows: V1, 0.52; V2, 0.46; V3, 0.45.B, Measurements using the annular wedge stimulus. Mean correlations were as follows: V1, 0.30; V2, 0.38; V3, 0.31.
Fig. 7.
Fig. 7.
Summary of the fMRI responses within individual visual areas to the two types of rotating wedge stimulus in the nonlesioned right occipital lobe of G.Y. Details are as in Figure 5.A, Measurements using the full wedge stimulus. Mean correlations were as follows: V1, 0.35; V2, 0.38; V3, 0.36.B, Measurements using the annular wedge stimulus. Mean correlations were as follows: V1, 0.22; V2, 0.29; V3, 0.29.
Fig. 8.
Fig. 8.
Comparison of the fMRI responses within dorsal and ventral areas to the two types of rotating wedge stimulus in G.Y.’s left (lesioned) occipital lobe. Responses from areas V2 and V3 are combined in each histogram. A, Dorsal responses, full wedge stimulus. B, Dorsal responses, annular wedge stimulus.C, Ventral responses, full wedge stimulus. D, Ventral responses, annular wedge stimulus. Other features are as in Figure 5.
Fig. 9.
Fig. 9.
Comparison of angular visual field representation measured in the full (horizontal axis) and annular (vertical axis) wedge conditions. Voxels exceeding a correlation threshold of 0.33 in both stimulus conditions are shown. Responses from V1, V2, and V3, dorsal and ventral, and V3a and V4v are pooled in each graph. The identity line is plotted for comparison. Because of the cyclic nature of the angular dimension, points falling at the far right (top) margin of the graph also could be plotted at the far left (bottom) margin. A, Control subject A.P., right hemisphere; B, control subject A.P., left hemisphere; C, G.Y., right hemisphere;D, G.Y., left hemisphere.
Fig. 10.
Fig. 10.
A framework for explaining G.Y.’s cortical responses. For simplicity, only the connectivity between V1 and V2d is illustrated. In both panels, the shaded gray regionrepresents V1, and the lightly hatched area represents V2d.Circles with lines describe the angular representation at different cortical locations. The fovea is represented on theleft and periphery on the right in each panel.A, Intact occipital lobe. Primary, feed-forward inputs to V2d are shown as thin arrows. B, Lesioned occipital lobe in G.Y. The lesion is indicated by the dark hatched area. Altered inputs to V2d, possibly mediated by long-range horizontal connections, are represented by bold arrows. The principal source of signals for either the full or annular wedge condition is identified by the stimulus icons.

References

    1. Barbur JL, Ruddock KH. Spatial characteristics of movement detection mechanisms in human vision. I. Achromatic vision. Biol Cybern. 1980;37:77–92. - PubMed
    1. Barbur JL, Ruddock KH, Waterfield VA. Human visual responses in the absence of the geniculo-calcarine projection. Brain. 1980;103:905–928. - PubMed
    1. Barbur JL, Watson JDG, Frackowiak RSJ, Zeki S. Conscious visual perception without V1. Brain. 1993;116:1293–1302. - PubMed
    1. Berson DM, Stein JJ. Retinotopic organization of the superior colliculus in relation to the retinal distribution of afferent ganglion cells. Vis Neurosci. 1995;12:671–686. - PubMed
    1. Blythe IM, Kennard C, Ruddock KH. Residual vision in patients with retrogeniculate lesions of the visual pathways. Brain. 1987;110:887–905. - PubMed

Publication types

LinkOut - more resources