. 1999 Apr 1;19(7):2681-92.
doi: 10.1523/JNEUROSCI.19-07-02681.1999.

Optic flow selectivity in the anterior superior temporal polysensory area, STPa, of the behaving monkey

Affiliations

Optic flow selectivity in the anterior superior temporal polysensory area, STPa, of the behaving monkey

K C Anderson et al. J Neurosci. .

Abstract

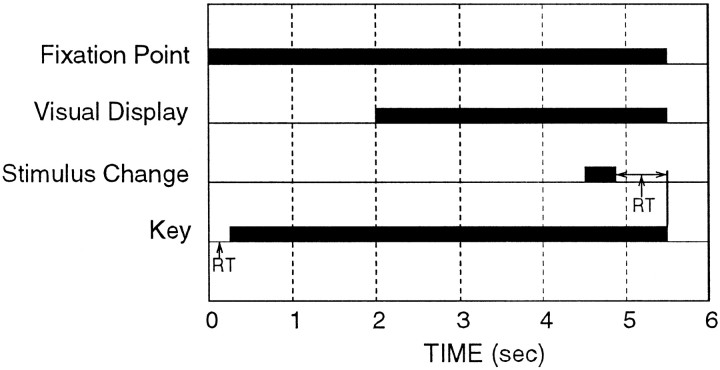
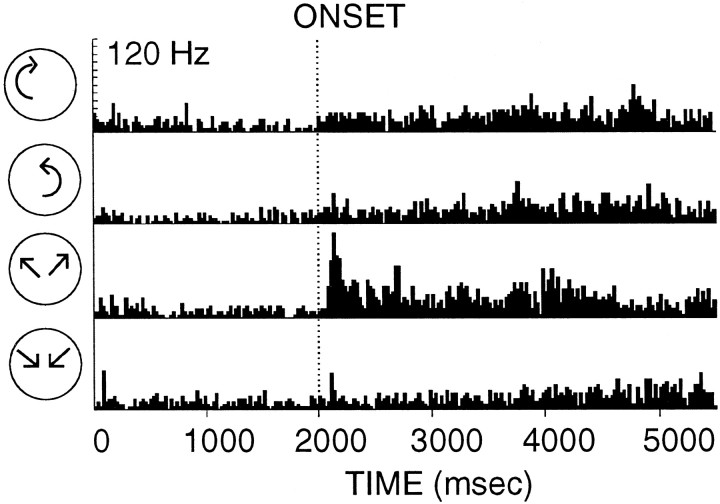
Earlier studies of neurons in the anterior region of the superior temporal polysensory area (STPa) have demonstrated selectivity for visual motion using stimuli contaminated by nonmotion cues, including texture, luminance, and form. The present experiments investigated the motion selectivity of neurons in STPa in the absence of form cues using random dot optic flow displays. The responses of neurons were tested with translation, rotation, radial, and spiral optic flow displays designed to mimic the types of motion that occur during locomotion. Over half of the neurons tested responded significantly to at least one of these displays. On a cell by cell basis, 60% of the neurons tested responded selectively to rotation, radial, and spiral motion, whereas 20% responded selectively to translation motion. The majority of neurons responded maximally to single-component optic flow displays but was also significantly activated by the spiral displays that contained their preferred component. Moreover, there was a bias in the selectivity of the neurons for radial expansion motion. These results suggest that neurons within STPa are contributing to the analysis of optic flow. Furthermore, the preponderance of cells selective for radial expansion provides evidence that this area may be specifically involved in the processing of forward locomotion and/or looming stimuli. Finally, these results provide carefully controlled physiological evidence for an extension and specialization of the motion-processing pathway into the anterior temporal lobe.


Figures

Fig. 1.
Fig. 1.
Temporal sequence of the behavioral task of the monkey for one trial. The fixation point came on at time 0, and the animal was required to fixate and pull back the key within 400 msec to initiate a trial. A stimulus appeared 2 sec after the onset of the fixation point. The stimulus changed at a random time between 3500 and 6000 msec into the trial (indicated at 4500 msec in this figure). The period over which the stimulus change occurs is exactly equal to the point life (533 msec). The animal was required to respond to the change within 800 msec of its initiation to receive a juice reward.RT, Reaction time.
Fig. 2.
Fig. 2.
Examples of the optic flow stimuli used in these experiments. Arrows indicate the velocity vector of each point within the displays. A, Radial expansion.B, Clockwise rotation. C, Spiral combination of clockwise rotation and radial expansion. The stimuli depicted in A–C contained velocity gradients. Shorter motion vectors in the middle of the stimuli and longer vectors at the edges schematically illustrate this.D, Translation motion displays. No velocity gradients were present in these stimuli.
Fig. 3.
Fig. 3.
Lesion site. Right, MRI image section of one animal taken 17.6 mm anterior to the interaural line. The white box indicates the area of the histology section on the left. Left, Coronal section (25 μm) taken from the left hemisphere of the same animal at approximately the same level as the MRI section on theright. This section has been stained with thionin and shows an electrode track leading to a lesion in the upper bank of the STS. SF, Sylvian fissure; AP, anteroposterior location.
Fig. 4.
Fig. 4.
Peristimulus time histograms illustrating the receptive field properties of three cells in STPa. Receptive fields were mapped with a stationary square at nine positions on a 40° × 40° grid. The position of each histogram corresponds to the location of the static square on the screen. The dotted linesrepresent the onset of the square. The square was visible for 1 sec.A, A cell that responded best to the square in the center position of the screen. B, A cell that showed maximal activity for positions around the center but also above-baseline activity for the center position. C, Responses of a cell that showed inhibition to the center position. Bin size for all histograms was 50 msec.
Fig. 5.
Fig. 5.
Directionally selective responses of cells to translation motion in STPa. A, Peristimulus time histogram of the responses of a cell averaged over eight trials that showed direction selectivity to translating motion. The position of each histogram corresponds to the direction of motion within the displays. Planar translation to the right was assigned to 0° angle, and translation in the upward direction was assigned to 90°. Thedotted lines represent the onset of the motion display. Data are plotted for the first 2000 msec of the trial.B, Best fit regression curve for the responses of the cell in A. The responses of this cell showed broad, unidirectional tuning for motion moving in the upward (90°) direction. The mean ± SE is plotted for the response to each direction of motion. The dotted line represents the baseline activity of the cell. C, Peristimulus time histograms for a cell that could not be modeled by a sinusoidal function. In contrast to the cell in A, the response showed more activity for opposite directions of motion (leftward and rightward), as well as for motion moving down and to the left (225°) and down and to the right (315°) (Bonferroni post hoctest; p < 0.05). Bin size for histograms inA and C is 50 msec. Theasterisks in A and Cindicate directions that elicited significant increases in the firing rate of the cell. D, Number of cells showing selectivity for each direction of planar translation motion. The distribution of preferred directions for translation motion was computed for those cells whose preferred direction could be determined with either of the above tests. Icons above each category indicate the direction of translation motion. The horizontal axisshows the corresponding angles assigned to each direction.
Fig. 6.
Fig. 6.
Tuning of an STPa neuron to radial, rotation, and spiral stimuli. A–C are data from the same cell that showed selective responses for EXP, CWE, and CCWE optic flows.A, Peristimulus time histogram of the average response for eight trials to each optic flow display. Icons to the left indicate the type of motion in each display. The dotted line represents the onset of the motion displays. B, The data from the first 2500 msec of the trials have been replotted in spiral space. Responses to rotation are plotted along the y-axis, and responses to radial motion are plotted along the x-axis. Responses to spiral displays are plotted at intermediate locations corresponding to the amount of each optic flow component in the spiral. The dotted lines in A and B represents the onset of the displays. Bin size, 25 msec. C, Best fit regression curve for the responses of this cell. The mean firing rate and SE are plotted for the response to each display. This cell fired maximally for expansion and spirals containing expansion. Thedotted line indicates baseline activity.
Fig. 7.
Fig. 7.
Distribution of neurons responding maximally to the onset of each optic flow display. A, Distribution of neurons tested with eight displays, including the spiral combinations of rotation and radial motion. The All single andAll spiral categories represent the neurons that had significantly different responses to the single-component compared with the spiral optic flow displays but did not show differences in firing rates for a particular single-component or spiral display.B, Distribution of neurons tested with only single-component optic flow patterns.
Fig. 8.
Fig. 8.
Expansion-selective cell. Peristimulus time histogram of a cell tested with four single-component optic flow displays. This cell responded strongest to radial expansion optic flow. Conventions are the same as in Figure 5.
Fig. 9.
Fig. 9.
Distribution of optic flow selectivity and translation selectivity on a cell by cell basis. Two hundred fifteen cells were tested with both blocks of stimuli, and the resulting mean firing rates were subject to a two-way ANOVA with significance set atp < 0.05. Selectivity indicated that at least one of the responses within a block was different from the others. Each cell was grouped depending on whether it was selective to either of the stimulus blocks (Optic flow selective,Translation flow selective) or to both. The No response category refers to cells that did not respond above baseline for any of the stimulus conditions. The No tuning category refers to cells that responded above baseline to the onset of the stimuli but were not selective to the stimuli within a block (e.g., a cell that responded equally regardless of the type or direction of motion that was presented).

References

    1. Albright TD. Direction and orientation selectivity of neurons in visual area MT of the macaque. J Neurophysiol. 1984;52:1106–1130. - PubMed
    1. Allman JM, Kaas JH, Lane RH. The middle temporal visual area (MT) in the bushbaby, Galago senegalensis. Brain Res. 1973;57:197–202. - PubMed
    1. Andersen RA, Asanuma C, Essick GK, Siegel RM. Corticocortical connections of anatomically and physiologically defined subdivisions within inferior parietal lobule. J Comp Neurol. 1990;296:65–113. - PubMed
    1. Andersen RA, Snyder LH, Bradley DC, Xing J. Multimodal representation of space in the posterior parietal cortex and its use in planning movements. Annu Rev Neurosci. 1997;20:303–330. - PubMed
    1. Anderson KC, Siegel RM. Psychophysical studies of rotation, radial, and spiral motion in monkey. Soc Neurosci Abstr. 1993;19:774.

Publication types

LinkOut - more resources