. 1999 Apr 1;19(7):2693-705.
doi: 10.1523/JNEUROSCI.19-07-02693.1999.

Choline and selective antagonists identify two subtypes of nicotinic acetylcholine receptors that modulate GABA release from CA1 interneurons in rat hippocampal slices

Affiliations

Choline and selective antagonists identify two subtypes of nicotinic acetylcholine receptors that modulate GABA release from CA1 interneurons in rat hippocampal slices

M Alkondon et al. J Neurosci. .

Abstract

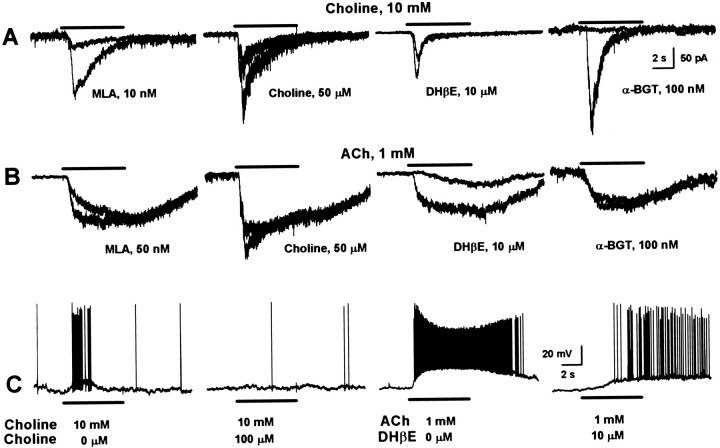
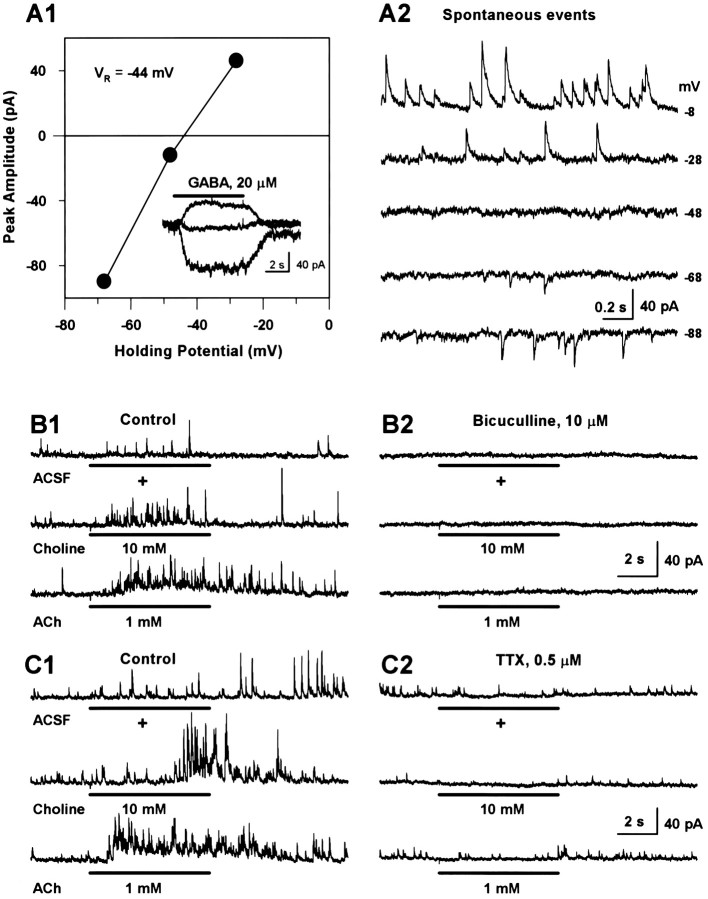
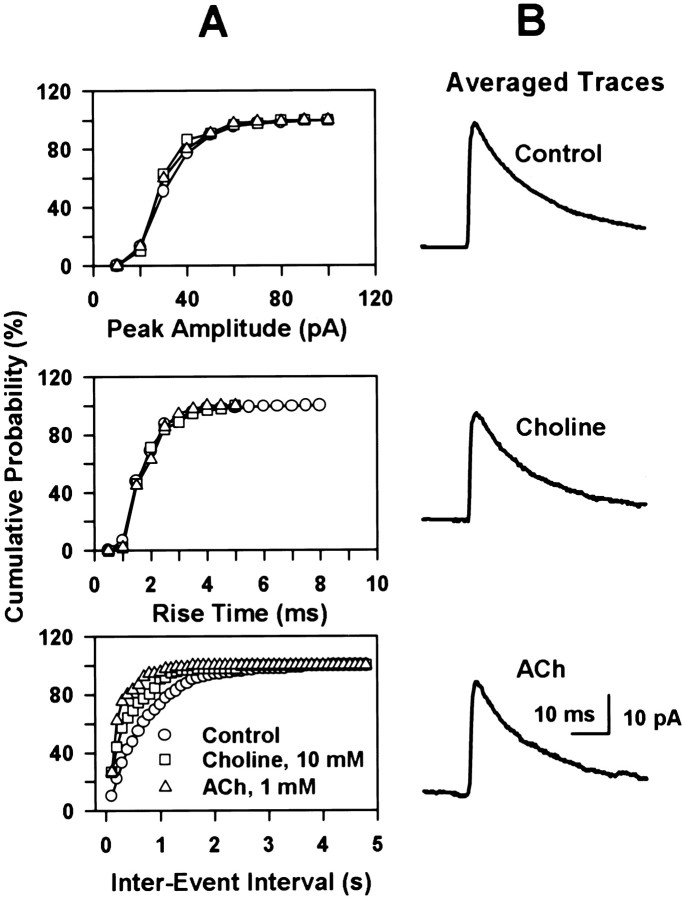
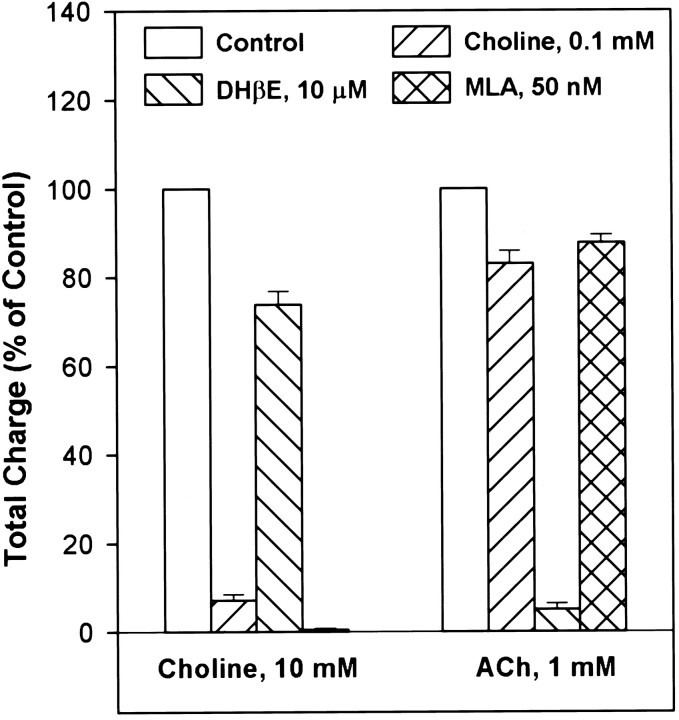
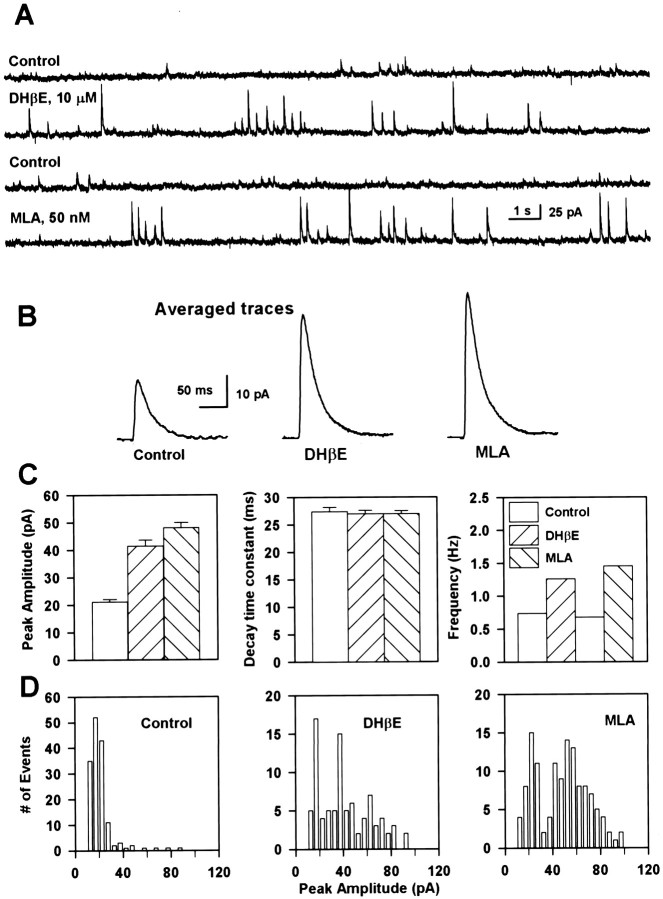
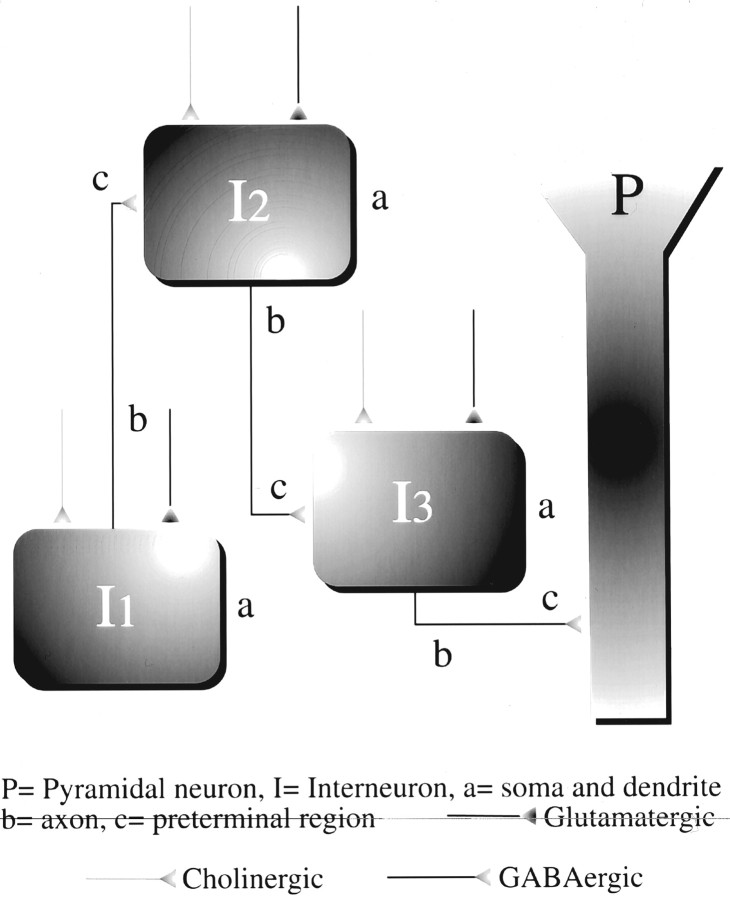
Neuronal nicotinic receptors (nAChR) are known to control transmitter release in the CNS. Thus, this study was aimed at exploring the diversity and localization of nAChRs present in CA1 interneurons in rat hippocampal slices. The use of a U-tube as the agonist delivery system was critical for the reliable detection of nicotinic responses induced by brief exposure of the neurons to ACh or to the alpha7 nAChR-selective agonist choline. The present study demonstrated that CA1 interneurons, in addition to expressing functional alpha7 nAChRs, also express functional alpha4beta2-like nAChRs and that activation of both receptors facilitates an action potential-dependent release of GABA. Depending on the experimental condition, one of the following nicotinic responses was recorded from the interneurons by means of the patch-clamp technique: a nicotinic whole-cell current, depolarization accompanied by action potentials, or GABA-mediated postsynaptic currents (PSCs). Responses mediated by alpha7 nAChRs were short-lasting, whereas those mediated by alpha4beta2 nAChRs were long-lasting. Thus, phasic or tonic inhibition of CA1 interneurons may be achieved by selective activation of alpha7 or alpha4beta2 nAChRs, respectively. It can also be suggested that synaptic levels of choline generated by hydrolysis of ACh in vivo may be sufficient to control the activity of the alpha7 nAChRs. The finding that methyllycaconitine and dihydro-beta-erythroidine (antagonists of alpha7 and alpha4beta2 nAChRs, respectively) increased the frequency and amplitude of GABAergic PSCs suggests that there is an intrinsic cholinergic activity that sustains a basal level of nAChR activity in these interneurons.


Figures

Fig. 1.
Fig. 1.
Choline and ACh produce distinct responses in CA1 interneurons. A, Nicotinic currents evoked by pressure application via a single pipette of choline or ACh (50 msec pulse, 10 pSi) to the soma of two interneurons. Horizontal bar on the top (or bottom) of the traces represents the duration of agonist pulse. Vertical barin the beginning of each trace represents the stimulus artifact arising from the activation of the drug delivery system. Membrane potential was held at −68 mV in all voltage-clamp recordings unless otherwise stated. BE, Responses of four interneurons to U-tube application of choline and ACh for 6 sec.B, Agonist-induced responses show only marginal difference in kinetics. C, The ACh-evoked current decayed much slower than the choline-induced current. D, In a current-clamped interneuron, both agonists induced similar depolarization and bursts of action potentials. E, In another current-clamped neuron, ACh induced responses that were more intense and lasted longer than those evoked by choline. The resting membrane potential of the neurons in D andE fluctuated around −69 mV. Atropine (1 μm) was present in the ACSF in all the experiments. TTX (0.5 μm) was present in the ACSF (inAC) while recording the nicotinic currents in all the experiments. In most of the experiments under voltage clamp, QX-314 (5 mm) was present in the pipette solution. CNQX (10 μm) and bicuculline (10 μm) were present in the ACSF during current-clamp recordings. Calibration scale shown in B is applicable to all traces inAC, however, the vertical calibration for the ACh trace in A is 25 pA. The calibration scale in D is also applicable to the traces inE.
Fig. 2.
Fig. 2.
Pharmacological agents identify different nicotinic responses. A, Fast-decaying nicotinic currents elicited by choline in four interneurons under control condition (the largest response in each) and after 5–10 min exposure to different inhibitory agents (the smallest response in each). B, Slowly decaying nicotinic currents elicited by ACh in four interneurons under control condition (the largest response in each) and after 5–10 min exposure to different inhibitory agents (the smallest response in each). C, Choline-induced responses in a current-clamped interneuron before (first trace) and after 5 min continuous exposure to choline (100 μm) (second trace). ACh-induced responses in another current-clamped interneuron before (first trace) and after 5 min continuous exposure to DHβE (fourth trace).
Fig. 3.
Fig. 3.
Nicotinic currents rectify inwardly and show differences in sensitivity to activation by agonists. A, Fast-decaying currents (type IA) evoked by different concentrations of ACh in an interneuron. B, Type IA currents induced by different concentrations of choline in another neuron.C, In the same interneuron as in B, a 20 sec pulse of choline (0.5 mm) also elicited a current. The decay phase of this current was fit by a single exponential function (fit represented by solid line through the data) with a decay time constant of 4.2 sec. D, Graph shows the plot of the peak amplitude versus membrane potential for choline- and ACh-evoked type IA currents; the data were obtained from two neurons each. Inset shows the current traces evoked by choline in a single experiment. At positive membrane potentials, no outward nicotinic currents were evoked, although the spontaneous GABAergic PSCs were present. In all experiments, the pipette solution contained methane sulfonate as the main anion and MgCl2.E, Slowly decaying currents (type IB) evoked by various concentrations of ACh in another interneuron. F, Concentration–response relationship for ACh and choline in inducing different responses. The amplitude of the currents evoked by the highest agonist concentration tested was taken as 100% and used to normalize the amplitude of the currents evoked by the other concentrations. Data points are the average from two neurons for choline and ACh in type IA and from one neuron in type IB. Solid lines passing through data points represent the fit of the data to a Hill equation. For type IB, two EC50s and two Hill coefficients were assumed. G, Graph shows the plot of the peak amplitude versus membrane potential of ACh-evoked type IB currents from a single interneuron. Inset shows the current traces at different membrane potentials.
Fig. 4.
Fig. 4.
Nicotinic agonists trigger GABAergic PSCs in interneurons in an action potential-dependent manner.A1, Plot of the membrane potential versus peak amplitude of GABA-evoked currents. Data points are from the traces shown inA2, inset. Spontaneous PSCs recorded from another interneuron at different membrane potentials. Note that both spontaneous PSCs and GABA-evoked whole-cell currents reversed at approximately −44 mV. B, Recording of PSCs spontaneously occurring or evoked by nicotinic agonists in an interneuron at +2 mV. Traces on the left column(B1) were obtained under control condition, and those on the right (B2) were obtained 3–9 min after exposure of the neuron to bicuculline. C, Panel of traces showing spontaneous and agonist-evoked (6 sec pulse) PSCs under control (C1) and 3–7 min after exposure to TTX (C2). Data were obtained from a single interneuron at +2 mV. All experiments with PSCs were performed using a pipette solution that contained Cs-methanesulfonate as the main anion and QX-314 (5 mm).
Fig. 5.
Fig. 5.
the PSC frequency that outlasted the duration of the agonist pulse, particularly at the highest concentrations of ACh (third and fourth traces).C, Traces shown in A were expanded for better visualization of the PSCs. Under control (first two traces), individual PSCs are well (Figure legend continues)separated. With choline (10 mm), the PSCs summated such that individual events could not be identified (third trace). In the presence of ACh (10 μm), individual PSCs could still be identified. However, in the presence of 100 μm and 1 mm ACh, the PSCs summated such that the frequency could not be analyzed.D, An example of an experiment in which charge analysis of the PSCs was performed. Traces shown in B were used for this analysis. Charge movement per 2 sec segment was calculated in the traces before, during, and after the end of pulse and plotted against time. The 10th sec in the time scale corresponds to activation of the agonist-delivery system. Membrane potential, +2 mV.Choline and ACh differ in their ability to trigger GABAergic PSCs. A, A 6 sec pulse of choline induced a burst of PSCs that did not outlast the agonist pulse (top trace). Note that the evoked PSCs were preceded by a small inward current that was induced by choline. In the same neuron, application of ACh induced a concentration-dependent increase in the PSC frequency (second, third, andfourth traces). The PSCs outlasted the ACh pulse. Membrane potential, −8 mV. B, In another neuron, a 12 sec pulse of choline (1 mm) also induced a burst of PSCs. The delay for the onset of the response was shortened by increasing the concentration of choline to 10 mm. In the same neuron, ACh induced a concentration-dependent increase in
Fig. 6.
Fig. 6.
Nicotinic agonists increase the frequency of PSCs. Analysis of the peak amplitude, 10–90% rise time, and interevent intervals of PSCs that occurred either spontaneously (270 sec data) or in response to choline (40 sec data, two pulses applied) and ACh (20 sec data, one pulse applied) in a CA1 interneuron. Data were from the same experiment as illustrated in Figure 5B.A, Cumulative distribution of peak amplitude, rise time, and interevent intervals of events recorded under different experimental conditions. This representation clearly shows that nicotinic agonists increased the frequency but not other parameters of the PSCs. B, Several PSCs were averaged: 304 spontaneous events, 81 events recorded in the presence of choline, and 57 events recorded in the presence of ACh. These averaged traces show very little differences in their decay phase.
Fig. 7.
Fig. 7.
Pharmacological agents identify the nAChR subtypes that trigger PSCs. Agonist-evoked PSCs under different conditions were quantitated using charge analysis. The values obtained before perfusion of the neurons with the antagonists were taken as 100%. The data are mean ± SE calculated from three experiments. The values in the antagonist group were significantly different from control (p ≤ 0.02 according to the Student’st test). Note that the bar representing choline-induced PSCs in the presence of MLA is not visible because of a complete blocking effect.
Fig. 8.
Fig. 8.
Nicotinic antagonists increase the frequency of large-amplitude PSCs. A, PSCs recorded at −8 mV from an interneuron before and 1 min after exposure to each of the antagonists. During exposure to these agents, large-amplitude events appeared frequently, and this effect reversed after wash. B, The averaged PSC traces obtained from several individual PSCs in each group indicated marked changes in the PSC amplitude. C, The arithmetic mean and SE of the peak amplitudes (left graph) and decay time constants (middle graph) of PSCs are shown for each group. The number of PSCs (both small- and large-amplitude events) per second before and during exposure of the neurons to the antagonists was calculated and is depicted in theright graph. D, Distribution of the peak amplitude of PSCs recorded for 450 sec in the absence of antagonists, for 150 sec in the presence of DHβE, and for 150 sec in the presence of MLA. Note that large-amplitude events are more prevalent in the presence than in the absence of the antagonists.
Fig. 9.
Fig. 9.
Schematic representation of an interneuron circuitry in the CA1 region that can be affected by nicotinic cholinergic activity. This scheme is based on the anatomical evidence that is reported in the literature and on the functional evidence that is presented in this study. For simplicity, we have shown three interneurons (I1I3) and one pyramidal neuron (P) connected in series. The present results and those of our previous study (Alkondon et al., 1997a) suggest that nAChRs are located in preterminal sites (c) of axons (b) and in somatodendritic regions of CA1 interneurons. Endogenous nicotinic cholinergic activity can induce either inhibition or disinhibition depending on the interneuron that is activated in the circuitry. A properly timed cholinergic signal to one interneuron (e.g.,I1) can effectively nullify the ability of a glutamatergic signal to drive a second interneuron (e.g.,I2), resulting in the disinhibition of a synaptically connected neuron (e.g., I3). The ability of nicotinic antagonists to increase the frequency of GABAergic PSCs in the interneurons supports such a scheme.

References

    1. Acsády L, Görcs TJ, Freund TF. Different populations of vasoactive intestinal polypeptide-immunoreactive interneurons are specialized to control pyramidal cells or interneurons in the hippocampus. Neuroscience. 1996;73:317–334. - PubMed
    1. Albuquerque EX, Alkondon M, Pereira EFR, Castro NG, Schrattenholz A, Barbosa CTF, Bonfante-Cabarcas R, Aracava Y, Eisenberg HM, Maelicke A. Properties of neuronal nicotinic acetylcholine receptors: Pharmacological characterization and modulation of synaptic function. J Pharmacol Exp Ther. 1997;280:1117–1136. - PubMed
    1. Alkondon M, Albuquerque EX. Initial characterization of the nicotinic acetylcholine receptors in rat hippocampal neurons. J Recept Res. 1991;11:1001–1022. - PubMed
    1. Alkondon M, Albuquerque EX. Diversity of nicotinic acetylcholine receptors in rat hippocampal neurons. I. Pharmacological and functional evidence for distinct structural subtypes. J Pharmacol Exp Ther. 1993;265:1455–1473. - PubMed
    1. Alkondon M, Pereira EFR, Wonnacott S, Albuquerque EX. Blockade of nicotinic currents in hippocampal neurons defines methyllycaconitine as a potent and specific receptor antagonist. Mol Pharmacol. 1992;41:802–808. - PubMed

Publication types

LinkOut - more resources