. 1999 Apr 1;19(7):2706-16.
doi: 10.1523/JNEUROSCI.19-07-02706.1999.

Reorganization of cholinergic terminals in the cerebral cortex and hippocampus in transgenic mice carrying mutated presenilin-1 and amyloid precursor protein transgenes

Affiliations

Reorganization of cholinergic terminals in the cerebral cortex and hippocampus in transgenic mice carrying mutated presenilin-1 and amyloid precursor protein transgenes

T P Wong et al. J Neurosci. .

Abstract

Cholinergic deficits are one of the most consistent neuropathological landmarks in Alzheimer's disease (AD). We have examined transgenic mouse models (PS1M146L, APPK670N,M671L) and a doubly transgenic line (APPK670N,M671L + PS1M146L) that overexpress mutated AD-related genes [presenilin-1 (PS1) and the amyloid precursor protein (APP)] to investigate the effect of AD-related gene overexpression and/or amyloidosis on cholinergic parameters. The size of the basal forebrain cholinergic neurons and the pattern of cholinergic synapses in the hippocampus and cerebral cortex were revealed by immunohistochemical staining for choline acetyltransferase and the vesicular acetylcholine transporter, respectively. At the time point studied (8 months), no apparent changes in either the size or density of cholinergic synapses were found in the PS1M146L mutant relative to the nontransgenic controls. However, the APPK670N,M671L mutant showed a significant elevation in the density of cholinergic synapses in the frontal and parietal cortices. Most importantly, the double mutant (APPK670N,M671L + PS1M146L), which had extensive amyloidosis, demonstrated a prominent diminution in the density of cholinergic synapses in the frontal cortex and a reduction in the size of these synapses in the frontal cortex and hippocampus. Nonetheless, no significant changes in the size of basal forebrain cholinergic neurons were observed in these three mutants. This study shows a novel role of APP and a synergistic effect of APP and PS1 that correlates with amyloid load on the reorganization of the cholinergic network in the cerebral cortex and hippocampus at the time point studied.


Figures

Fig. 1.
Fig. 1.
Light microscopical representations of Aβ aggregations and cholinergic distrophic dendrites in doubly transgenic mice. A, Aβ aggregations were present across different regions of the cerebral cortex and hippocampus. This micrograph depicts a typical plaque-like Aβ aggregation in the cerebral cortex from a doubly transgenic (APPK670N,M671L + PS1M146L) mouse. B, VAChT-IR cholinergic grossly distrophic neurites concentrated around a plaque. Some enlarged cholinergic boutons can be found in the remaining neuropile (arrowheads). Scale bar, 100 μm.
Fig. 2.
Fig. 2.
Density of VAChT-IR presynaptic boutons/1000 μm2 and the size of VAChT boutons in different brain regions from control mice (n = 5). Note the relatively rich cholinergic innervation characteristic of the hippocampus and the lack of correlation between bouton density and size across CNS regions (see also Fig. 3). Data represent the mean ± SEM. Pair-wise comparisons that revealed significant differences are shown (*p < 0.05; **p < 0.01; ***p < 0.001).
Fig. 3.
Fig. 3.
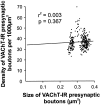
Variation in the density of VAChT-IR presynaptic boutons and the size of VAChT boutons. Observe the lack of correlation between the two variables (r2 = 0.003).
Fig. 4.
Fig. 4.
VAChT-IR presynaptic bouton density and size in the hippocampus of different transgenic mice. Data represent the mean ± SEM. Statistically significant differences between animal groups could be found when comparing the density (p < 0.05) and the size (p < 0.05) of VAChT boutons. Pair-wise comparison with control mice revealed only a significant reduction in the size of VAChT boutons of doubly transgenic mice (***p < 0.001).
Fig. 5.
Fig. 5.
VAChT-IR presynaptic bouton density and size in the frontal cortex of different transgenic mice. A comparison of the global density (weighted mean from all cortical laminae) and the mean size of VAChT boutons between different transgenic mice revealed an elevated number in the APPK670N,M671L transgenic line and a diminished number in the doubly transgenic line accompanied by shrunken bouton size (*p < 0.05; **p < 0.01; ***p < 0.001). Data represent the mean ± SEM.
Fig. 6.
Fig. 6.
Density and size of VAChT boutons in different cortical laminae of the frontal cortex from different transgenic mice.A, Comparison to control mice revealed a statistically significant increase in the density of VAChT boutons in lamina I (p < 0.05) and lamina VI (p < 0.05) of APPK670N,M671Ltransgenic mice. A similar comparison between control and doubly transgenic mice depicted a selective decrease in VAChT bouton density in lamina II, III (p < 0.001) and lamina V (p < 0.001). B, These decreases were accompanied by significantly smaller VAChT boutons in lamina I (p < 0.05), lamina II, III (p < 0.05), and lamina V (p < 0.05). Note the different extent of changes in these two properties of cholinergic synapses across different cortical laminae (*p < 0.05; **p < 0.01; ***p < 0.001). Data represent the mean ± SEM.
Fig. 7.
Fig. 7.
VAChT-IR presynaptic bouton density and size in the parietal cortex of different transgenic mice. Statistically significant differences between animal groups could be found when comparing the global density (weighted mean from all cortical laminae) of VAChT boutons (p < 0.01). Data represent the mean ± SEM. Pair-wise comparison with control mice showed a significant elevation in VAChT bouton density in APPK670N,M671L transgenic mice (p < 0.01). No statistical differences were found when comparing VAChT bouton size between different mice groups.
Fig. 8.
Fig. 8.
VAChT-IR presynaptic bouton density and size in the entorhinal cortex of different transgenic mice. Data represent the mean ± SEM. Observe the lack of a significant effect on cholinergic innervation after overexpression of different transgenes in this cortical area.
Fig. 9.
Fig. 9.
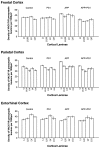
Illustration of the overall pattern of expressing PS1M146L, APPK670N,M671L, and APPK670N,M671L + PS1M146L transgenes on the laminar organization of the density of cholinergic synapses (VAChT-IR presynaptic boutons per 1000 μm2). Data represent the mean ± SEM. Results from repeated measurement ANOVA displayed a significant difference between mice groups when comparing the laminar organization of cholinergic synapses in the frontal cortex (p < 0.001), thus implying a significant reorganization of the cholinergic network after the expression of the human, mutated transgenes. Note the different patterns of cholinergic synaptic laminar distribution in APPK670N,M671L and doubly transgenic mice, but not in the PS1M146L transgenic mice, when compared with control mice. Less prominent changes (p = 0.06) were found in the parietal cortex, which could be caused by the prominent elevation in VAChT bouton density of APPK670N,M671L transgenic mice. In contrast, the cholinergic synaptic laminar distribution in the entorhinal cortex of the different transgenic mice displayed similar patterns (p = 0.24) after repeated measurements ANOVA.
Fig. 10.
Fig. 10.
Light microscopic representation of VAChT-immunoreactive fibers and boutons in the hippocampus (AD) and in lamina V of frontal cortex (E, F) from different transgenic mice groups. Note the similar density of VAChT-IR boutons in PS1M146L transgenic mice (B,F), elevated density of VAChT-IR boutons in APPK670N,M671L transgenic mice (C,G), and diminished density of VAChT-IR boutons in doubly transgenic mice (D, H) when compared with control mice (A, E). Observe also the significant decrease in the size of VAChT-IR in both the hippocampus and the frontal cortex of doubly transgenic mice (D, H). Scale bar, 10 μm.
Fig. 11.
Fig. 11.
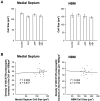
Cross-sectional areas of ChAT-IR neurons from the medial septum and NBM and the relationship of their size with VAChT-IR bouton density in the corresponding brain regions receiving their cholinergic inputs. Data represent the mean ± SEM.A, Note the lack of significant difference between cholinergic cell size in the medial septum (p = 0.14) and the NBM (p = 0.74) in the different transgenic mice groups. B, No correlation between cholinergic cell size in the medial septum and NBM with the density of VAChT boutons in, respectively, the hippocampus (r2 = 0.002) and frontal cortex (r2 = 0.004) can be found.

References

    1. Borchelt DR, Thinakaran G, Eckman CB, Lee MK, Davenport F, Ratovitsky, Prada CM, Kim G, Seekins S, Yager D, Slunt HH, Wang R, Seeger M, Levey AI, Gandy SE, Copeland NG, Jenkins NA, Price DL, Younkin SG, Sisodia SS. Familial Alzheimer’s disease-linked presenilin 1 variants elevate Abeta1–42/1–40 ratio in vitro and in vivo. Neuron. 1996;17:1005–1013. - PubMed
    1. Borchelt DR, Ratovitski T, van Lare J, Lee MK, Gonzales V, Jenkins NA, Copeland NG, Price DL, Sisodia SS. Accelerated amyloid deposition in the brains of transgenic mice coexpressing mutant presenilin 1 and amyloid precursor proteins. Neuron. 1997;19:939–945. - PubMed
    1. Bowen DM, Smith CB, White P, Davison AN. Neurotransmitter-related enzymes and indices of hypoxia in senile dementia and other abiotrophies. Brain. 1976;99:459–496. - PubMed
    1. Braak H, Braak E. Evolution of the neuropathology of Alzheimer’s disease. Acta Neurol Scand [Suppl] 1996;165:3–12. - PubMed
    1. Braak H, Braak E, Bohl J. Staging of Alzheimer-related cortical destruction. Eur Neurol. 1993;33:403–408. - PubMed

Publication types