. 1999 Mar 22;144(6):1271-84.
doi: 10.1083/jcb.144.6.1271.

Endocytic sorting of lipid analogues differing solely in the chemistry of their hydrophobic tails

Affiliations

Endocytic sorting of lipid analogues differing solely in the chemistry of their hydrophobic tails

S Mukherjee et al. J Cell Biol. .

Abstract

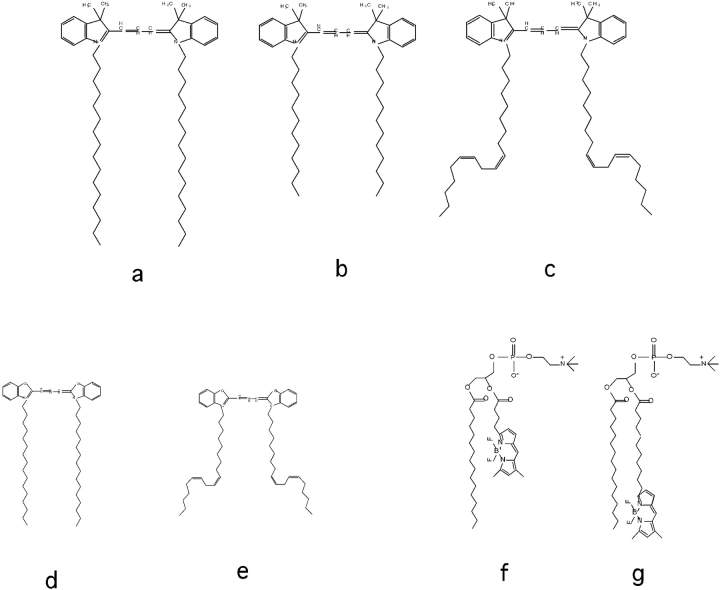
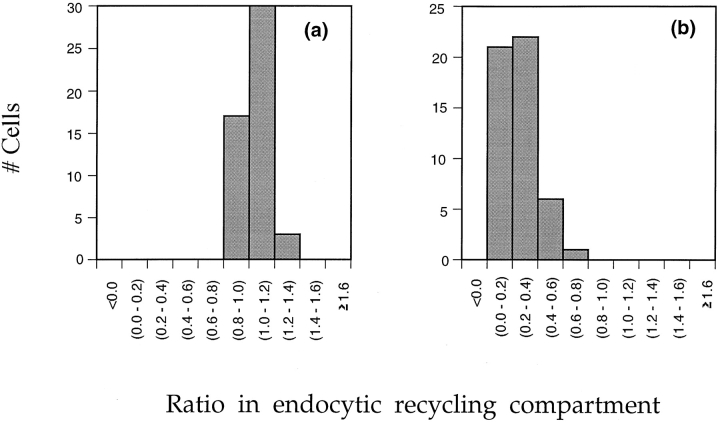
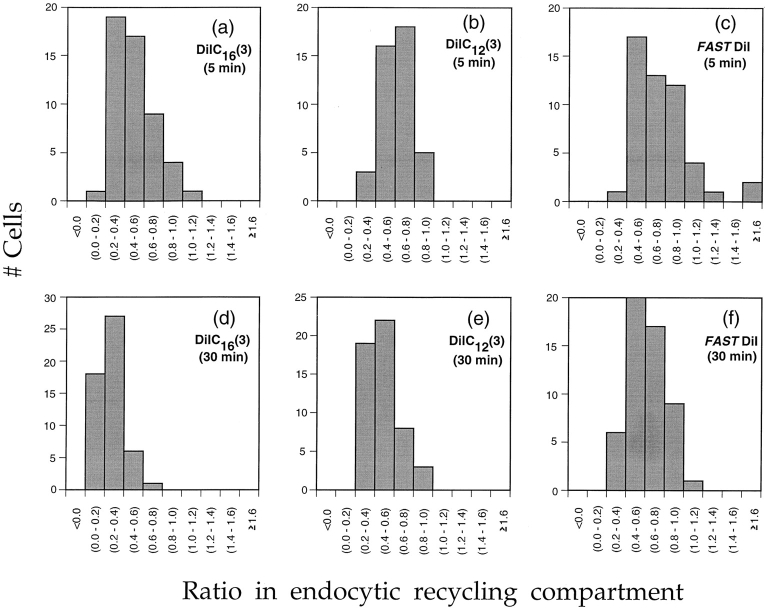
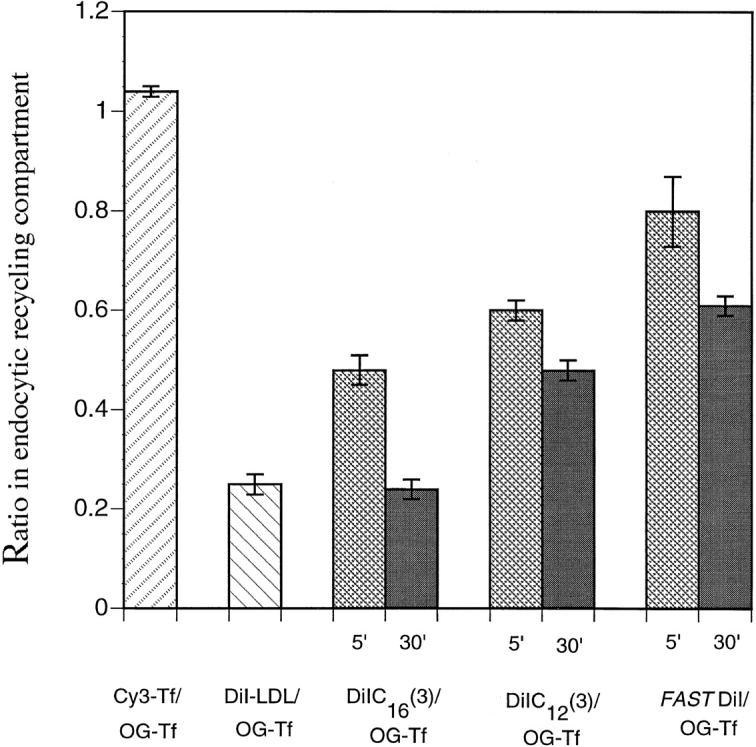
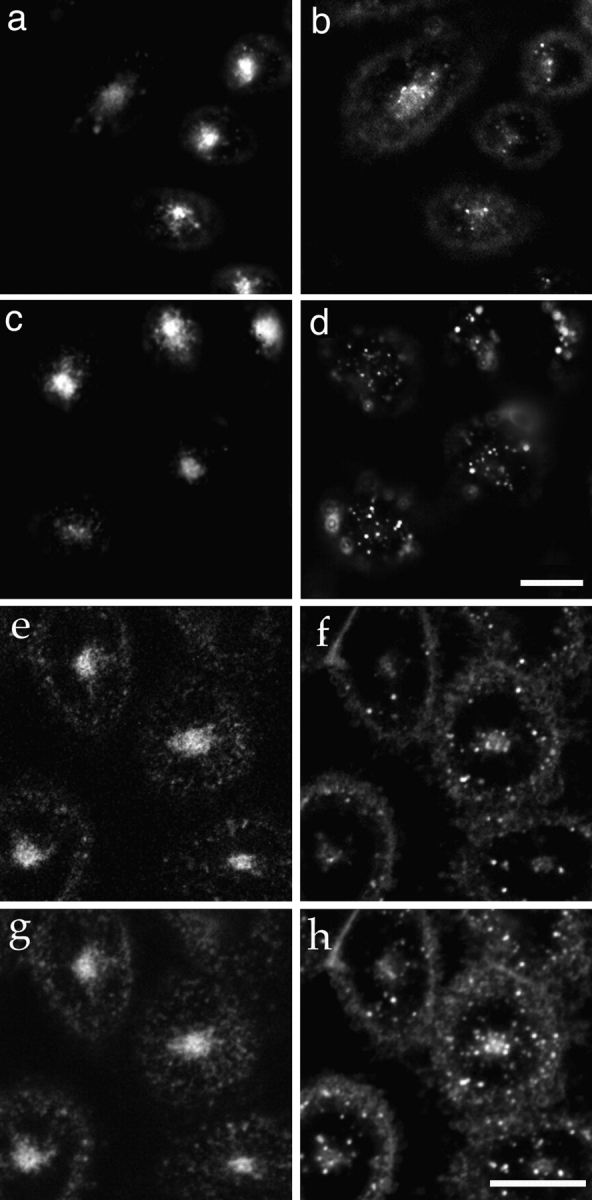
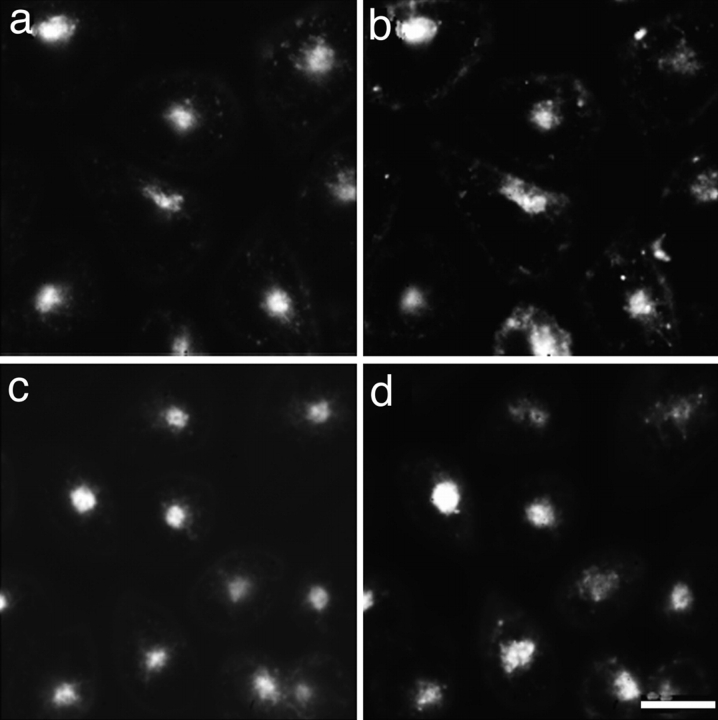
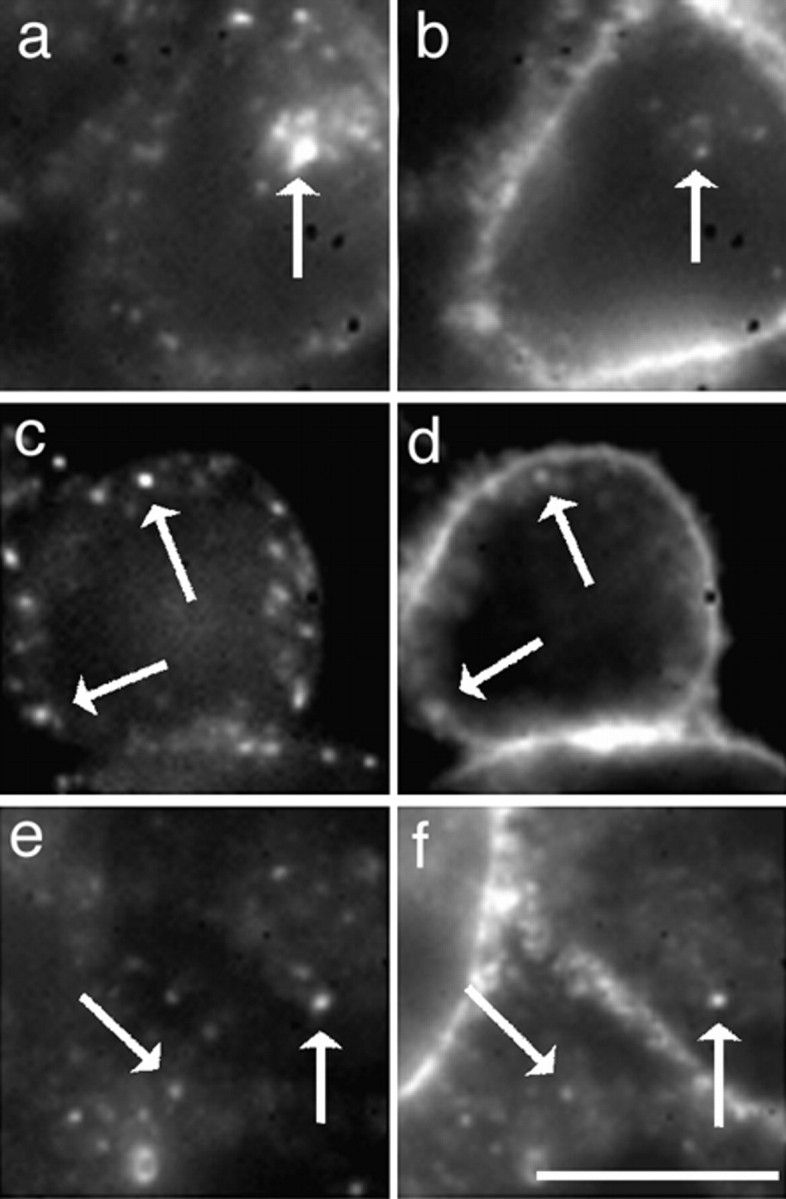
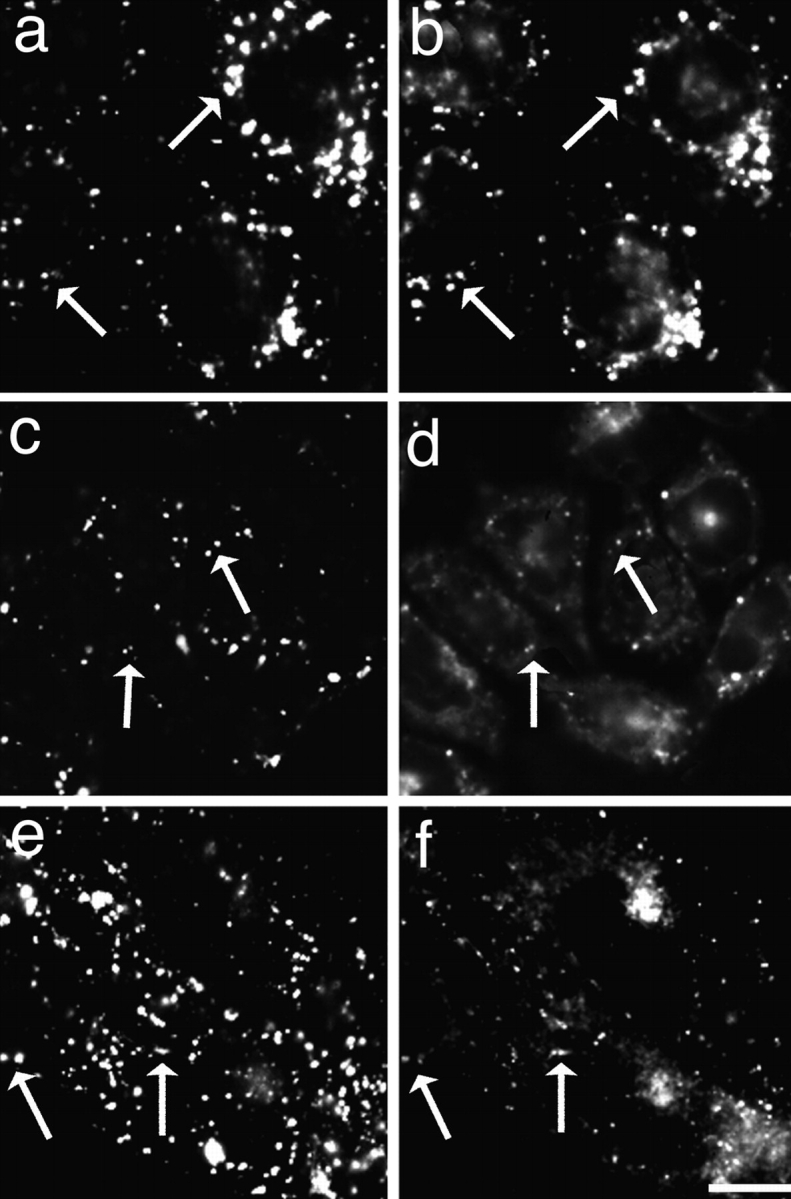
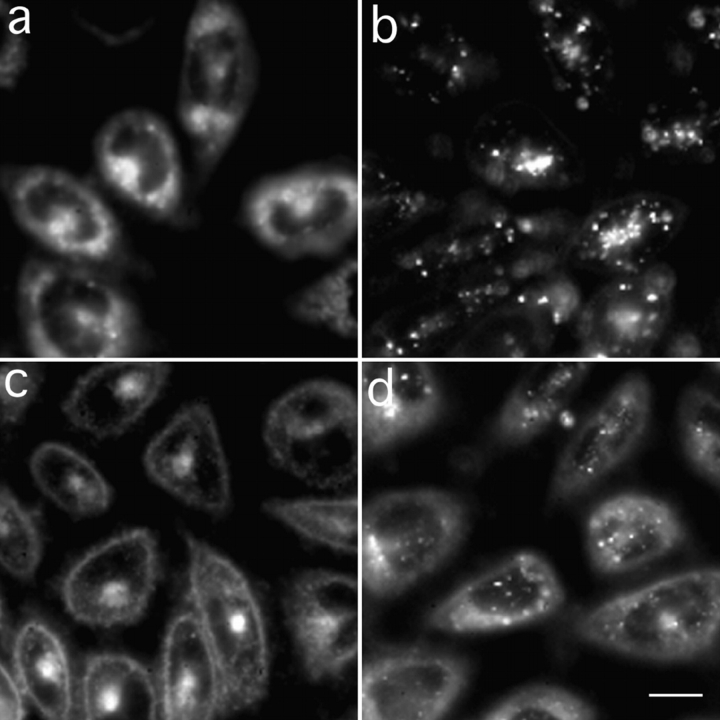
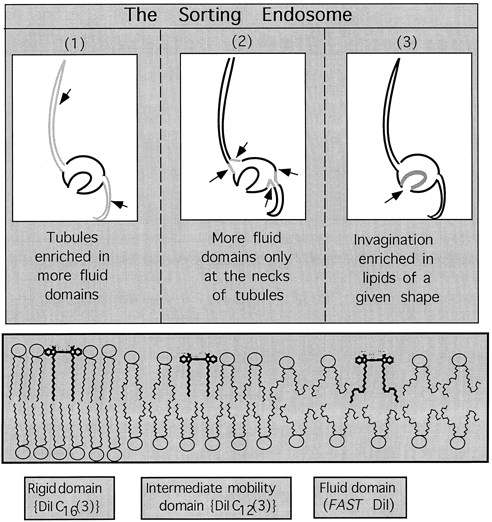
To understand the mechanisms for endocytic sorting of lipids, we investigated the trafficking of three lipid-mimetic dialkylindocarbocyanine (DiI) derivatives, DiIC16(3) (1,1'-dihexadecyl-3,3,3',3'-tetramethylindocarbocyanine perchlorate), DiIC12(3) (1,1'- didodecyl-3,3,3',3'-tetramethylindocarbocyanine perchlorate), and FAST DiI (1,1'-dilinoleyl-3,3,3', 3'-tetramethylindocarbocyanine perchlorate), in CHO cells by quantitative fluorescence microscopy. All three DiIs have the same head group, but differ in their alkyl tail length or unsaturation; these differences are expected to affect their distribution in membrane domains of varying fluidity or curvature. All three DiIs initially enter sorting endosomes containing endocytosed transferrin. DiIC16(3), with two long 16-carbon saturated tails is then delivered to late endosomes, whereas FAST DiI, with two cis double bonds in each tail, and DiIC12(3), with saturated but shorter (12-carbon) tails, are mainly found in the endocytic recycling compartment. We also find that DiOC16(3) (3,3'- dihexadecyloxacarbocyanine perchlorate) and FAST DiO (3, 3'-dilinoleyloxacarbocyanine perchlorate) behave similarly to their DiI counterparts. Furthermore, whereas a phosphatidylcholine analogue with a BODIPY (4,4-difluoro-4-bora-3a,4a-diaza-s-indacene) fluorophore attached at the end of a 5-carbon acyl chain is delivered efficiently to the endocytic recycling compartment, a significant fraction of another derivative with BODIPY attached to a 12-carbon acyl chain entered late endosomes. Our results thus suggest that endocytic organelles can sort membrane components efficiently based on their preference for association with domains of varying characteristics.


Figures

Figure 1
Figure 1
Chemical structures of the lipid analogues used in this study: (a) DiIC16(3), (b) DiIC12(3), (c) FAST DiI, (d) DiOC16(3), (e) FAST DiO, (f) BODIPY FL C5-HPC, and (g) BODIPY FL C12-HPC. In the nomenclature, the subscripted numbers refer to the length of the alkyl chains, while the numbers in the parentheses refer to the number of carbons bridging the two indocarbocyanine rings that constitute the head group.
Figure 7
Figure 7
Control experiments to assign limits on the ratios in the ERC that can be reliably measured by our image analysis protocol. (a) A case where both probes traffic identically. TRVb-1 cells were coincubated with 10 μg/ml OG-Tf and 5 μg/ml Cy3-Tf for 30 min at 37°C, and washed and fixed as discussed in Fig. 2. The analysis regime is discussed in detail in Materials and Methods. This figure shows a frequency histogram (n = 50) where the number of cells having ratios of Cy3-Tf/OG-Tf in different ratio intervals are shown. (b) A case where the two probes completely segregate from each other. In this case, cells were coincubated with 1 μg/ml DiI-LDL and 10 μg/ml OG-Tf for 5 min at 37°C, rinsed, chased for another 5 min at 37°C, and fixed as described in Fig. 2. The figure shows a frequency histogram of DiI-LDL/OG-Tf (n = 50).
Figure 8
Figure 8
Quantitative analysis of the results presented in Figs. 4–6. The results are shown as frequency histograms of the ratio of the various DiI derivatives to Tf in the ERC at various time points. a–c show the ratios in the ERC after 5 min, while d–f show them after 30 min. DiIC16(3) (a and d), DiIC12(3) (b and e), and FAST DiI (c and f).
Figure 9
Figure 9
The mean values for the ratios of various DiI derivatives to OG-Tf in the ERC after 5 or 30 min of endocytosis. The values were obtained from the frequency distributions presented in Figs. 7 and 8. Bars represent the standard errors in the data.
Figure 2
Figure 2
Cell surface (plasma membrane) labeling by (a) DiIC16(3), (b) DiIC12(3), and (c) FAST DiI. The cells were labeled for 2 min at 37°C with a final concentration of 2 μM DiIC16(3), 31 nM DiIC12(3), and 75 nM FAST DiI. They were then washed several times with ice-cold Medium 1 supplemented with 2 g/liter glucose and fixed with 2% paraformaldehyde for 10 min on ice. The excess paraformaldehyde was rinsed thoroughly and the cells were warmed to room temperature before microscopy. Bar, 10 μm.
Figure 4
Figure 4
Distribution of receptor-bound OG-Tf (a and c) and DiIC16(3) (b and d) in TRVb-1 cells double labeled with 10 μg/ml OG-Tf and 2 μM DiIC16(3), imaged using wide-field epifluorescence microscopy. The cells were labeled for 2 min at 37°C with DiIC16(3), rinsed, and then incubated further at 37°C in the presence of OG-Tf for 5 (a and b) or 30 (c and d) min. The cells were then washed and fixed as described in Fig. 2. e–h show cells double labeled with 10 μg/ml Alexa 488–Tf and 2 μM DiIC16(3) after 5 min chase, imaged using laser scanning confocal microscopy. e and g show the distributions of Alexa 488–Tf, while f and h show those of DiIC16(3) in the same cells. e and f present a single optical section through the cells, where the ERC is in sharp focus. g and h show summation projection of all the optical slices from the same cells. Bars, 10 μm.
Figure 5
Figure 5
Distribution of receptor-bound OG-Tf (a and c) and DiIC12(3) (b and d) in TRVb-1 cells double labeled with 10 μg/ml OG-Tf and 31 nM DiIC12(3). The cells were labeled for 2 min at 37°C DiIC12(3), rinsed, and then incubated further at 37°C in the presence of OG-Tf for 5 min (a and b) or 30 min (c and d). The cells were then washed and fixed as described in Fig. 2. Bar, 10 μm.
Figure 6
Figure 6
Distribution of receptor-bound OG-Tf (a and c) and FAST DiI (b and d) in TRVb-1 cells double labeled with 10 μg/ml OG-Tf and 75 nM FAST DiI. The cells were labeled for 2 min at 37°C FAST DiI, rinsed, and then incubated further at 37°C in the presence of OG-Tf for 5 (a and b) or 30 (c and d) min. The cells were then washed and fixed as described in Fig. 2. Bar, 10 μm.
Figure 3
Figure 3
Distribution of receptor-bound Tf and various DiI derivatives in TRVb-1 cells double labeled with OG-Tf and one of the DiI derivatives at very early times after endocytosis. The cells were colabeled for 1 min at 37°C by a mixture containing both the DiI labeling solution (same final concentrations as in Fig. 2) and 15 μg/ml OG-Tf, rinsed once with ice-cold Medium 1, transferred immediately into an ice-water bath to arrest further endocytosis. The cells were then quickly rinsed several times with ice-cold Medium 1 and fixed on ice with prechilled 2% paraformaldehyde for 10 min. Further treatments were identical to those described in Fig. 2. a, c, and e show OG-Tf labeling, while b, d, and f show labeling with DiIC16(3), DiIC12(3), and FAST DiI, respectively. Arrows indicate identical positions in matched images to facilitate identification of endosomes that contain both the fluorophores. Bar, 10 μm.
Figure 10
Figure 10
Distribution of fluorescein-dextran and the various DiI derivatives in TRVb-1 cells double labeled with 1 mg/ml fluorescein-dextran (a, c, and e) and 2 mM DiIC16(3) (b), 21 nM DiIC12(3) (d), and 75 nM FAST DiI (f), respectively. The cells were labeled for 2 min at 37°C with the DiI labeling solution, rinsed, and then incubated further at 37°C in the presence of fluorescein-dextran for 60 min. Further treatments were identical to those described in Fig. 2. Arrows indicate endosomes that contain both the fluorophores. Bar, 10 μm.
Figure 11
Figure 11
Distribution of lipid analogues in TRVb-1 cells. Cells were labeled with 150 nM FAST DiO (a), 2 μM DiOC16(3) (b), 30 nM BODIPY FL C5-HPC (c), or 1 μM BODIPY FL C12-HPC (d). The cells were labeled for 2 min at 37°C with each labeling solution, rinsed, and then incubated further at 37°C in Medium 1 for 30 min. Further treatments were identical to those described in Fig. 2. Bar, 10 μm.
Figure 12
Figure 12
A schematic representation of the endocytic sorting of lipid analogues occurring at the sorting endosomes. Molecules internalized from the cell surface enter the tubulovesicular sorting endosomes. Here, most of the surface area (including most of the membrane-bound molecules) are in the long tubular projections that repeatedly pinch off and deliver their contents to the recycling route, while some membrane components are specifically retained in this organelle and are eventually delivered to late endosomes. Such sorting out of the recycling route would require that these molecules do not enter the tubules that contain material destined to recycle. Here, we propose mechanisms that could act to constrain a fraction of membrane-bound molecules in the membrane surrounding the spherical part of the sorting endosome. (1) The tubules could be enriched in more fluid domains so that lipids that preferentially partition into such domains [e.g., DiIC12(3) and FAST DiI] would be enriched there, while rigid domain–preferring lipids such as DiIC16(3) could be depleted. (2) The necks of the tubules could represent extremely fluid domains (due to excessive curvature stress), and only those membrane components that can traverse these domains would be able to enter the tubules in significant proportions. (3) Certain lipids such as DiIC16(3) may be enriched in the invaginations of the vesicular region of the sorting endosome by virtue of their inverted cone shape. See text for more detailed discussion. The above possibilities are not mutually exclusive.

References

    1. Axelrod D. Carbocyanine dye orientation in red cell membrane studied by microscopic fluorescence polarization. Biophys J. 1979;26:557–574. - PMC - PubMed
    1. Berk DA, Hochmuth RM. Lateral mobility of integral proteins in red blood cell tethers. Biophys J. 1992;61:9–18. - PMC - PubMed
    1. Brown DA, London E. Structure of detergent-resistant membrane domains: does phase separation occur in biological membranes? . Biochem Biophys Res Commun. 1997;240:1–7. - PubMed
    1. Callaghan R, van Gorkom LCM, Epand RM. A comparison of membrane properties and composition between cell lines selected and transfected for multi-drug resistance. Br J Cancer. 1992;66:781–786. - PMC - PubMed
    1. Chattopadhyay A, London E. Parallax method for direct measurement of membrane penetration depth utilizing fluorescence quenching by spin-labeled phospholipids. Biochemistry. 1987;26:39–45. - PubMed

Publication types