. 1999 Mar 22;144(6):1337-48.
doi: 10.1083/jcb.144.6.1337.

Extracellular matrix regulates apoptosis in mammary epithelium through a control on insulin signaling

Affiliations

Extracellular matrix regulates apoptosis in mammary epithelium through a control on insulin signaling

N Farrelly et al. J Cell Biol. .

Abstract

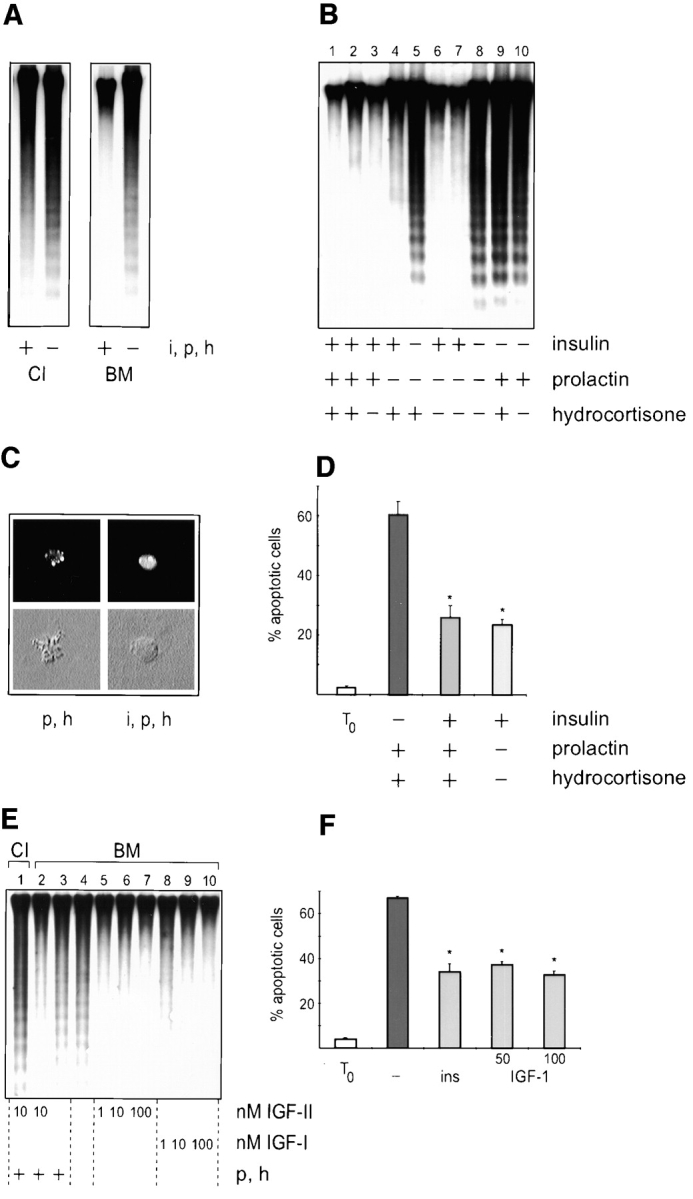
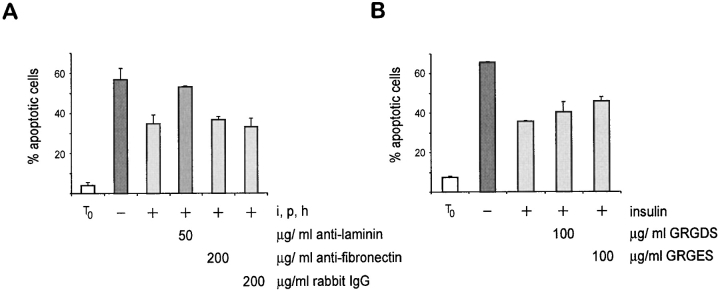
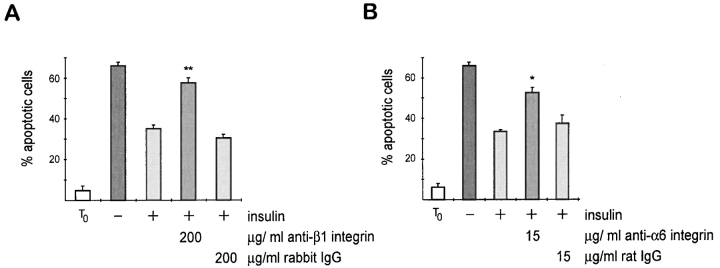
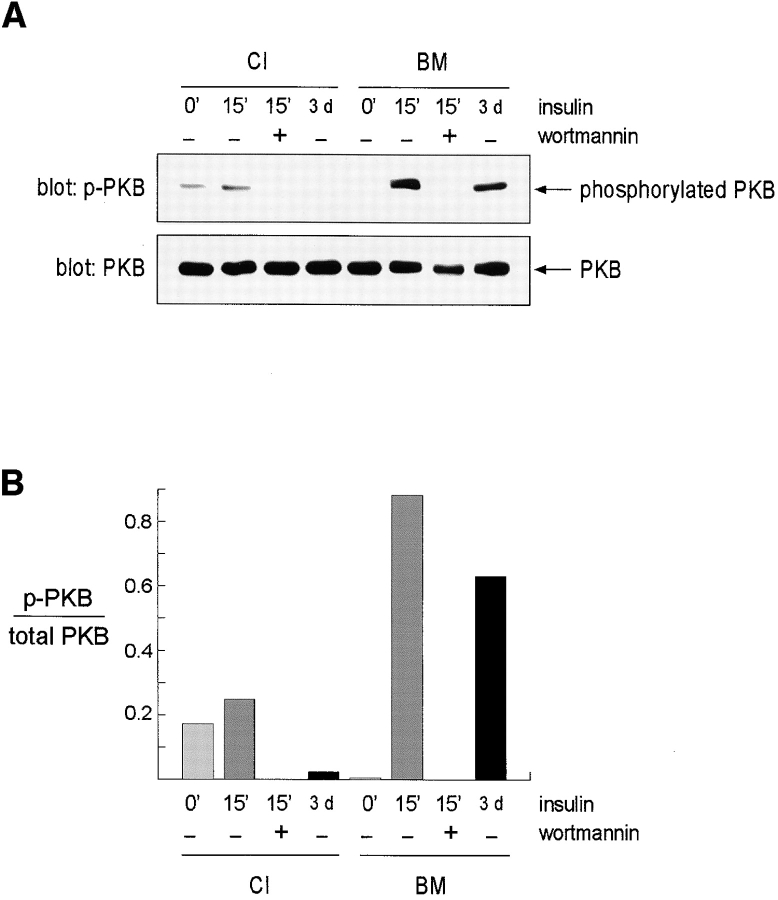
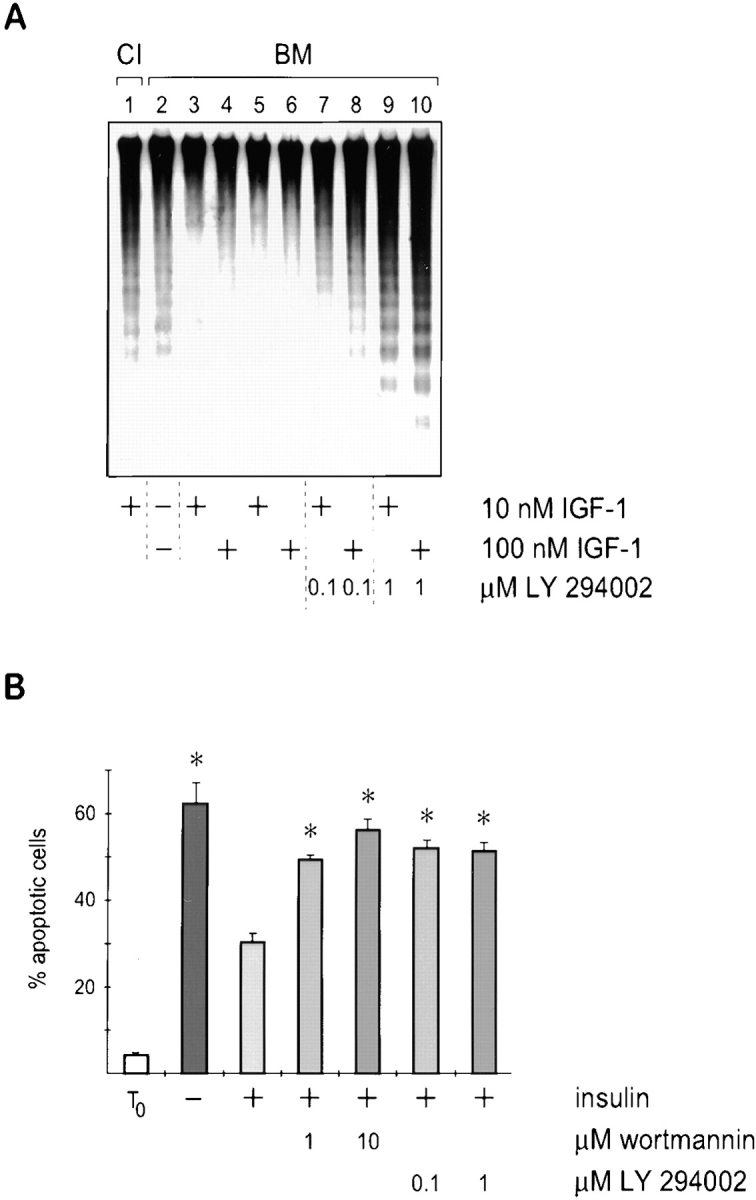
Adherent epithelial cells require interactions with the extracellular matrix for their survival, though the mechanism is ill-defined. In long term cultures of primary mammary epithelial cells, a laminin-rich basement membrane (BM) but not collagen I suppresses apoptosis, indicating that adhesion survival signals are specific in their response (. J. Cell Sci. 109:631-642). We now demonstrate that the signal from BM is mediated by integrins and requires both the alpha6 and beta1 subunits. In addition, a hormonal signal from insulin or insulin-like growth factors, but not hydrocortisone or prolactin, is necessary to suppress mammary cell apoptosis, indicating that BM and soluble factors cooperate in survival signaling. Insulin induced autophosphorylation of its receptor whether mammary cells were cultured on collagen I or BM substrata. However, both the tyrosine phosphorylation of insulin receptor substrate-1 and its association with phosphatidylinositol 3-kinase were enhanced in cells cultured on BM, as was the phosphorylation of the phosphatidylinositol 3-kinase effector, protein kinase B. These results suggest a novel extracellular matrix-dependent restriction point in insulin signaling in mammary epithelial cells. The proximal signal transduction event of insulin receptor phosphorylation is not dependent on extracellular matrix, but the activation of downstream effectors requires adhesion to BM. Since phosphatidylinositol 3-kinase was required for mammary epithelial cell survival, we propose that a possible mechanism for BM-mediated suppression of apoptosis is through its facilitative effects on insulin signaling.


Figures

Figure 1
Figure 1
Coordinate signaling between BM and insulin regulates mammary survival. (A) Southern analysis of DNA isolated from cells cultured on collagen I (CI) or BM in the presence (+) or absence (−) of insulin, prolactin and hydrocortisone (i, p, and h). Note that DNA fragmentation is only suppressed in cells cultured on BM together with lactogenic hormones. (B) Southern analysis of DNA isolated from cells cultured on BM with combinations of insulin, prolactin and hydrocortisone. Samples in lanes 2 and 7 were from cells cultured in phenol red–free media, and the results indicate that estrogenic activity of phenol red did not contribute to survival. (C) Cryosections of cells suspended within gels of BM matrix after Hoechst staining (upper panels) and the corresponding differential interference contrast images (lower panels). These images are typical of apoptotic single cells cultured with hydrocortisone and prolactin (p and h), and those which resisted apoptosis when cultured additionally with insulin (i, p, and h). (D) Quantitative analysis of apoptosis in single cells embedded within BM. The percentage of apoptotic cells, as determined by nuclear morphology after Hoechst staining, is shown in cultures incubated with combinations of insulin, prolactin and hydrocortisone. Results are the mean ± SE of counts from five independent cultures from two separate experiments. The values with insulin are significantly different to those without insulin (*P < 0.01). Less than 5% of the cells were apoptotic in embedded cultures that were fixed 1 h after plating (To). (E) Southern analysis of DNA isolated from cells cultured on collagen I or BM in the presence of 1, 10, or 100 nM IGF-I or IGF-II. Lanes 1–3 additionally contained prolactin and hydrocortisone (p and h). (F) Quantitative analysis of IGF-I suppression of apoptosis in single cells embedded within BM. Results are the mean ± SE of counts from six independent cultures from two separate experiments. The values with insulin and IGF-I are significantly different to those without hormones (*P < 0.05). Less than 5% of the cells were apoptotic at the time of plating (To).
Figure 2
Figure 2
Inhibition of mammary epithelial apoptosis by BM is not dependent on three-dimensional multicellular structure. Mammary cells cultured as monolayers on collagen I (0 mg/ml EHS) were incubated with lactogenic hormones and the indicated concentrations of BM proteins diluted into the culture medium (0.1, 0.4 mg/ml EHS), or as alveoli on top of BM (14 mg/ml EHS). (A) Apoptosis was measured in a quantitative assay. Each day during a 3-d experiment, the cultures were washed and then the detached apoptotic cells were collected over a 4-h time period. Apoptosis is expressed as the number of apoptotic cells per 1,000 cells initially attached to the culture dish. Results are the mean ± SE of two separate experiments. The number of cells that died toward the end of the experiment was lower than on day 1 because at this time there were fewer cells remaining on the dish. (B) Apoptosis was measured by DNA fragmentation analysis as in Fig. 1 A.
Figure 2
Figure 2
Inhibition of mammary epithelial apoptosis by BM is not dependent on three-dimensional multicellular structure. Mammary cells cultured as monolayers on collagen I (0 mg/ml EHS) were incubated with lactogenic hormones and the indicated concentrations of BM proteins diluted into the culture medium (0.1, 0.4 mg/ml EHS), or as alveoli on top of BM (14 mg/ml EHS). (A) Apoptosis was measured in a quantitative assay. Each day during a 3-d experiment, the cultures were washed and then the detached apoptotic cells were collected over a 4-h time period. Apoptosis is expressed as the number of apoptotic cells per 1,000 cells initially attached to the culture dish. Results are the mean ± SE of two separate experiments. The number of cells that died toward the end of the experiment was lower than on day 1 because at this time there were fewer cells remaining on the dish. (B) Apoptosis was measured by DNA fragmentation analysis as in Fig. 1 A.
Figure 3
Figure 3
Laminin affects the survival potential of mammary epithelial cells. (A) Quantitative analysis of apoptosis in single cells embedded within BM in the presence of anti-laminin and fibronectin antibodies. The percentage of apoptotic cells, as determined by nuclear morphology after Hoechst staining, is shown. Results are the mean ± SE of counts from four independent cultures from two separate experiments. The values with anti-laminin antibody are significantly different to those for control IgG and anti-fibronectin antibody (P < 0.001). Note that insulin together with prolactin and hydrocortisone failed to suppress apoptosis in mammary cells cultured with anti-laminin antibody. (B) Quantitative analysis of apoptosis in single cells embedded within BM in the presence of GRGDS and its control GRGES peptides. Note that there was no significant different difference in levels of apoptosis between those cells cultured with and without GRGDS (P = 0.34).
Figure 4
Figure 4
Requirement of integrin for mammary cell survival. Quantitative analysis of apoptosis in single cells embedded within BM in the presence of anti-integrin antibodies. The percentage of apoptotic cells, as determined by nuclear morphology after Hoechst staining, is shown. Results are the mean ± SE of counts from five independent cultures from two separate experiments. The values with anti-integrin antibody are significantly different to those for control IgG (*P < 0.05; **P < 0.01). Insulin failed to suppress apoptosis in mammary cells cultured with either (A) anti– β1 integrin or (B) anti–α6 integrin antibody.
Figure 5
Figure 5
Cross talk between insulin and BM signaling pathways. Mammary cells cultured on either collagen I or BM were stimulated for 15 min with insulin or left unstimulated. (A) Cell lysates were immunoprecipitated with anti-insulin receptor β (Ins-Rβ) antibody and precipitated proteins were analyzed by immunoblotting for phosphotyrosine (4G10; top). Equivalent amounts of insulin receptor β were confirmed by SDS-PAGE of the same amount of whole cell lysate followed by immunoblotting with anti-insulin receptor β antibody (bottom). (B) Duplicate cell lysates were immunoprecipitated with anti–IRS-1 antibody and precipitated proteins were analyzed by immunoblotting for either phosphotyrosine using 4G10 (top) or for IRS-1 itself to confirm that equal levels of IRS-1 were present in all the samples (bottom). (C) Association of PI 3-kinase with IRS-1 was determined by immunoprecipitating lysates with anti–IRS-1 antibody, followed by immunoblotting with antibodies to either phosphotyrosine, the p85 subunit of PI 3-kinase (p85), or the precipitating antibody. (D) The signal from the experiment in C was quantitated by scanning densitometry and the level of phosphotyrosine or PI 3-kinase in each sample was normalized to the level of IRS-1. Note that threefold more PI 3-kinase associated with IRS-1 in cells cultured on BM than in cells cultured on collagen I.
Figure 5
Figure 5
Cross talk between insulin and BM signaling pathways. Mammary cells cultured on either collagen I or BM were stimulated for 15 min with insulin or left unstimulated. (A) Cell lysates were immunoprecipitated with anti-insulin receptor β (Ins-Rβ) antibody and precipitated proteins were analyzed by immunoblotting for phosphotyrosine (4G10; top). Equivalent amounts of insulin receptor β were confirmed by SDS-PAGE of the same amount of whole cell lysate followed by immunoblotting with anti-insulin receptor β antibody (bottom). (B) Duplicate cell lysates were immunoprecipitated with anti–IRS-1 antibody and precipitated proteins were analyzed by immunoblotting for either phosphotyrosine using 4G10 (top) or for IRS-1 itself to confirm that equal levels of IRS-1 were present in all the samples (bottom). (C) Association of PI 3-kinase with IRS-1 was determined by immunoprecipitating lysates with anti–IRS-1 antibody, followed by immunoblotting with antibodies to either phosphotyrosine, the p85 subunit of PI 3-kinase (p85), or the precipitating antibody. (D) The signal from the experiment in C was quantitated by scanning densitometry and the level of phosphotyrosine or PI 3-kinase in each sample was normalized to the level of IRS-1. Note that threefold more PI 3-kinase associated with IRS-1 in cells cultured on BM than in cells cultured on collagen I.
Figure 6
Figure 6
Phosphorylation of PKB is coordinately regulated by insulin and BM. Mammary cells cultured on either collagen I or BM were stimulated for 15 min with insulin or were left unstimulated. Wortmannin was included in some cultures at the time of insulin addition to show that PKB phosphorylation depended on enzymes within the PI 3-kinase signaling pathway. Some cultures were treated with insulin continuously for 3 d before harvesting. (A) Cell lysates were analyzed by immunoblotting with an antibody specific for phospho-PKB (p-PKB; top). Equivalent amounts of PKB were confirmed by reprobing the blots with anti-PKB antibody (PKB; bottom). (B) The signal from the experiment was quantitated by scanning densitometry and the level of phosphorylation in each sample was normalized to the level of PKB. Note that maximal phosphorylation depended on both insulin treatment and the cells being in contact with BM, and that it was inhibited by wortmannin.
Figure 7
Figure 7
Enzymes in the PI 3-kinase signaling pathway are required to suppress apoptosis of mammary epithelial cells. (A) Southern analysis of DNA isolated from cells cultured on collagen I, or on BM in the absence of factors or with IGF-I and the kinase inhibitor LY 294002. Note the inability of IGF-1 to suppress apoptosis in the presence of PI 3-kinase inhibitor. Vehicle alone (0.1% DMSO) did not itself induce DNA fragmentation (lanes 5 and 6). (B) Quantitative analysis of apoptosis in single cells embedded within BM in the presence of kinase inhibitors. The percentage of apoptotic cells, as determined by nuclear morphology after Hoechst staining, is shown. Results are the mean ± SE of counts from four to six independent cultures from two separate experiments. The values with kinase inhibitors are significantly different to those without (*P < 0.001). Note that insulin failed to suppress apoptosis in mammary cells cultured with 1 μM wortmannin or 0.1 μM LY 294002.

References

    1. Aggeler J, Ward J, Blackie LM, Barcellos-Hoff MH, Streuli CH, Bissell MJ. Cytodifferentiation of mouse mammary epithelial cells cultured on a reconstituted basement membrane reveals striking similarities to development in vivo. J Cell Sci. 1991;99:407–417. - PubMed
    1. Alexander CM, Howard EW, Bissell MJ, Werb Z. Rescue of mammary epithelial cell apoptosis and entactin degradation by a tissue inhibitor of metalloproteinases-1 transgene. J Cell Biol. 1996;135:1669–1677. - PMC - PubMed
    1. Barcellos-Hoff MH, Aggeler J, Ram TG, Bissell MJ. Functional differentiation and alveolar morphogenesis of primary mammary cultures on reconstituted basement membrane. Development. 1989;105:223–235. - PMC - PubMed
    1. Boudreau N, Sympson CJ, Werb Z, Bissell MJ. Suppression of ice and apoptosis in mammary epithelial cells by extracellular matrix. Science. 1995;267:891–893. - PMC - PubMed
    1. Bozzo C, Bellomo G, Silengo L, Tarone G, Altruda F. Soluble integrin ligands and growth factors independently rescue neuroblastoma cells from apoptosis under nonadherent conditions. Exp Cell Res. 1997;237:326–337. - PubMed

Publication types

MeSH terms