. 1999 Apr;181(7):2017-25.
doi: 10.1128/JB.181.7.2017-2025.1999.

Mutational analysis of the phoD promoter in Bacillus subtilis: implications for PhoP binding and promoter activation of Pho regulon promoters

Affiliations

Mutational analysis of the phoD promoter in Bacillus subtilis: implications for PhoP binding and promoter activation of Pho regulon promoters

S Eder et al. J Bacteriol. 1999 Apr.

Abstract

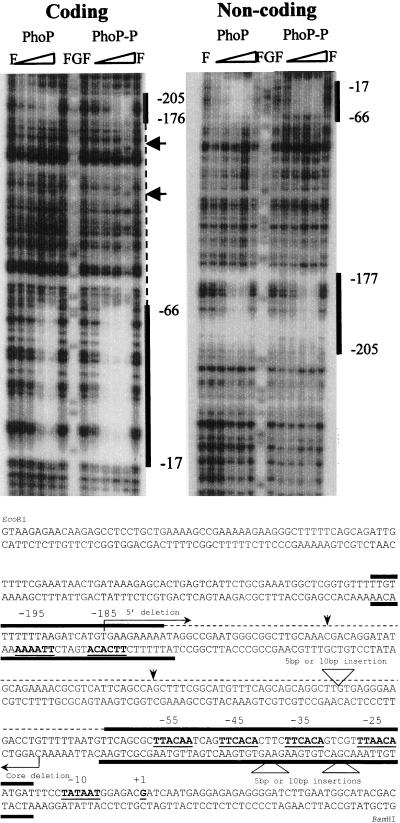
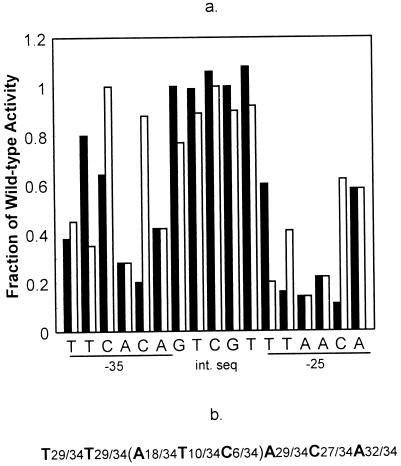
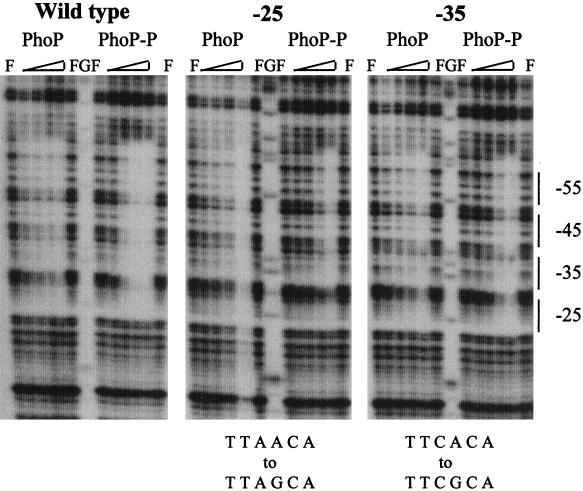
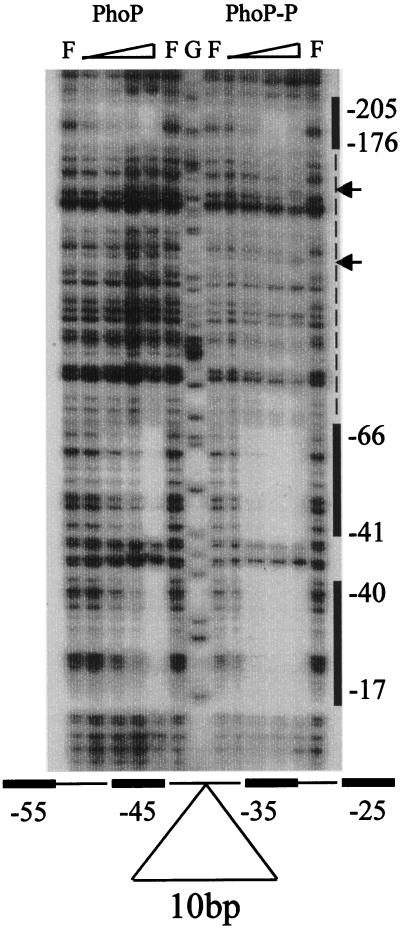
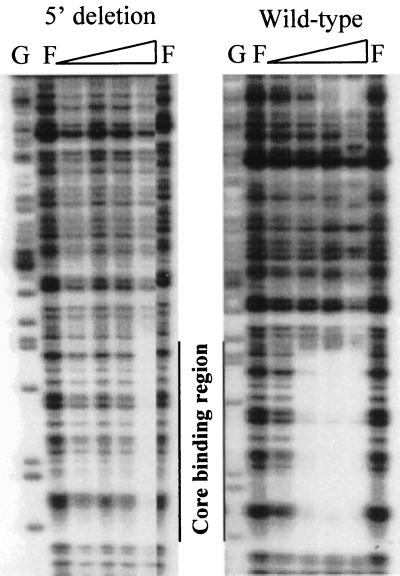
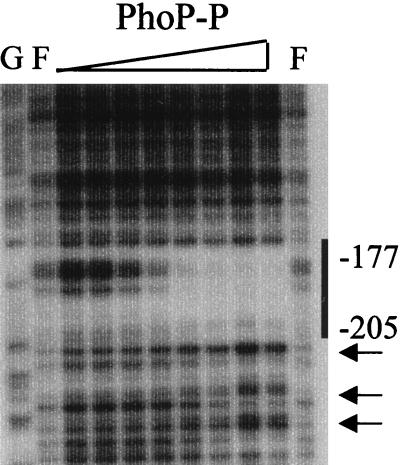
The PhoP-PhoR two-component regulatory system controls the phosphate deficiency response in B. subtilis. A number of Pho regulon genes which require PhoP approximately P for activation or repression have been identified. The studies reported here were initiated to understand the PhoP-DNA interaction necessary for Pho promoter regulation. The regulatory region of phoD was characterized in detail using oligo-directed mutagenesis, DNase I footprinting, and in vivo transcription assays. These data reveal basic principles of PhoP binding relevant to PhoP's interaction with other Pho regulon promoters. Our results show that: (i) a dimer of PhoP approximately P is able to bind two consensus repeats in a stable fashion; (ii) PhoP binding is highly cooperative within the core promoter region, which is located from -66 to -17 on the coding strand and contains four TT(A/T/C)ACA-like repeats; (iii) specific bases comprising the TT(A/T/C)ACA consensus are essential for transcriptional activation, but the specific base pairs of the intervening sequences separating the consensus repeats are not important for either PhoP binding or promoter activation; (iv) the spacing between two consensus repeats within a putative dimer binding site in the core region is important for both PhoP binding and promoter activation; (v) the exact spacing between two dimer binding sites within the core region is important for promoter activation but less so for PhoP binding affinity, as long as the repeats are on the same face of the helix; and (vi) the 5' secondary binding region is important for coordinated PhoP binding to the core binding region, making it nearly essential for promoter activation.


Figures

FIG. 1
FIG. 1
Primer extension analysis of phoD. The end-labeled primer was annealed to RNA from phosphate-depleted vegetative cells grown in LPDM (lane +1) and extended with reverse transcriptase. Lanes C, G, A, and T are a sequencing ladder made by annealing the same end-labeled primer to a plasmid containing the 5′ end of phoD and extending it with Sequenase (United States Biochemical). The +1 indicates the base (shown in bold print) to which the primer extension product maps.
FIG. 2
FIG. 2
(A) DNase I footprint analysis of the phoD promoter bound by PhoP and PhoP∼P. A 365-bp phoD promoter fragment (−321 to +44) was used as the probe. F represents free lanes where no PhoP was used; G represents the G-sequencing reaction lane used as a reference. The reactions for both the coding and noncoding strands contained 0.6 μg (0.6 μM) of ∗PhoR. The amounts of PhoP in each of the reactions from the left to right are as follows: 20 ng (27.5 nM), 40 ng (55 nM), 80 ng (110 nM), and 160 ng (220 nM). When PhoP∼P was needed, a final concentration of 4 mM ATP was added. The vertical solid lines mark the regions on the promoter which were bound by both PhoP and PhoP∼P. The dashed line represents the area on the coding strand where extension of the footprint by PhoP∼P occurred at intermittent places. The hypersensitive sites are indicated by arrows. (B) The phoD promoter sequence showing the PhoP and PhoP∼P binding sites. The coding and noncoding sequence of the 365-bp fragment is shown. The binding sites for both PhoP and PhoP∼P are represented by bold lines either above (coding) or below (noncoding) the sequence. A dashed line indicates the area between the two main binding sites which was intermittently protected when the highest concentration of PhoP∼P (220 nM) was used. The arrows indicate the hypersensitive sites. The 6-bp TT(A/T)ACA-like consensus repeats (shown in bold) are underlined on both strands, and their locations in the promoter are indicated above the coding strand. The −10 and the transcriptional start site are shown in bold, underlined, and labeled. The locations of the various deletion or insertion mutations are marked for reference. The numbering is based on the transcriptional start site established by primer extension.
FIG. 3
FIG. 3
(a) Point mutational analysis of the phoD promoter. The black bars represent the bases in the 3′ half of the core binding region (from the −25 to the −35 consensus repeat) that were individually changed to guanines. The white bars represent all the bases which were changed from purines to purines or pyrimidines to pyrimidines. Plasmids containing these various phoD-lacZ promoter fusions in pDH32 were linearized and integrated into B. subtilis JH642 chromosome at the amyE locus as a result of a double crossover. The strains carrying these various promoter constructions were then grown in LPDM, and the promoter activity was detected every hour for a 12-h growth period. The highest level of induction attained before repression was used to calculate the specific activity of each promoter (12). The figure gives an average of three independent assays. The results are expressed in terms of the fraction of activity observed compared to the wild-type strain. (b) Consensus PhoP binding sequence based on the comparison of 34 TT(A/T)ACA-like repeats in seven different Pho regulon promoters.
FIG. 4
FIG. 4
DNase I footprint analysis of the wild-type phoD core binding region versus a −25 or a −35 mutant phoD core binding region using PhoP and PhoP∼P. The mutant phoD promoters in pSE274b (−25, TTAACA to TTAGCA) and pSE292b (−35, TTCACA to TTCGCA) were used as probes, and only the coding strands are shown. The amounts of PhoP, PhoR, and ATP in each reaction were the same as those used for footprinting both the coding and noncoding strands of the wild-type phoD promoter shown in Fig. 2A. The core binding region is marked for reference by a dashed line along with the general location of the TT(A/T)ACA-like repeats.
FIG. 5
FIG. 5
DNase I footprint analysis of the phoD promoter with a 10-bp insertion between the −35 and −45 consensus repeats of the core binding region using PhoP and PhoP∼P. The mutant phoD promoter in pSE344b was used as a probe. Only the coding strand was labeled. The amounts of PhoP, PhoR, and ATP in each reaction were the same as those used for footprinting both the coding and noncoding strands of the wild-type phoD promoter shown in Fig. 2A. The labels are also the same as those in Fig. 2A.
FIG. 6
FIG. 6
DNase I footprint analysis of the wild-type phoD promoter versus the phoD 5′ binding region deletion mutant promoter using PhoP∼P. The amounts of PhoP, PhoR, and ATP in each reaction were the same as those used for footprinting both the coding and noncoding strands of the wild-type phoD promoter in Fig. 2A. The core binding region is marked for reference.
FIG. 7
FIG. 7
DNase I footprint analysis of the core binding region deletion mutant using PhoP∼P. The amounts of PhoR and ATP in each reaction were the same as those used for footprinting both the coding and noncoding strands of the wild-type phoD promoter shown in Fig. 2A. The concentrations of PhoP used in each lane from left to right were 27.5, 55, 110, 165, 220, 275, 330, and 385 nM. Hypersensitive sites are marked with arrows, and the 5′ binding region is marked with a bold line.

References

    1. Chesnut R S, Bookstein C, Hulett F M. Separate promoters direct expression of phoAIII, a member of the Bacillus subtilis alkaline phosphatase multigene family, during phosphate starvation and sporulation. Mol Microbiol. 1991;5:2181–2190. - PubMed
    1. Cutting S M, Vander Horn J A. Genetic analysis. In: Harwood C R, Cutting S M, editors. Molecular biological methods for bacillus. New York, N.Y: John Wiley; 1990. pp. 27–74.
    1. Eder S, Shi L, Jensen K, Yamane K, Hulett F M. A Bacillus subtilis secreted phosphodiesterase/alkaline phosphatase is the product of a Pho regulon gene, phoD. Microbiology. 1996;142:2041–2047. - PubMed
    1. Ferrari E, Howard S, Hoch J A. Effect of stage 0 sporulation mutants on subtilisin expression. J Bacteriol. 1986;166:173–179. - PMC - PubMed
    1. Hanahan D. Techniques for transformation of E. coli. In: Glover D M, editor. DNA cloning II: a practical approach. Washington, D.C: IRL Press; 1985. pp. 109–135.

Publication types

LinkOut - more resources