. 1999 Mar 30;96(7):3670-5.
doi: 10.1073/pnas.96.7.3670.

Single-pair fluorescence resonance energy transfer on freely diffusing molecules: observation of Förster distance dependence and subpopulations

Affiliations

Single-pair fluorescence resonance energy transfer on freely diffusing molecules: observation of Förster distance dependence and subpopulations

A A Deniz et al. Proc Natl Acad Sci U S A. .

Abstract

Photon bursts from single diffusing donor-acceptor labeled macromolecules were used to measure intramolecular distances and identify subpopulations of freely diffusing macromolecules in a heterogeneous ensemble. By using DNA as a rigid spacer, a series of constructs with varying intramolecular donor-acceptor spacings were used to measure the mean and distribution width of fluorescence resonance energy transfer (FRET) efficiencies as a function of distance. The mean single-pair FRET efficiencies qualitatively follow the distance dependence predicted by Förster theory. Possible contributions to the widths of the FRET efficiency distributions are discussed, and potential applications in the study of biopolymer conformational dynamics are suggested. The ability to measure intramolecular (and intermolecular) distances for single molecules implies the ability to distinguish and monitor subpopulations of molecules in a mixture with different distances or conformational states. This is demonstrated by monitoring substrate and product subpopulations before and after a restriction endonuclease cleavage reaction. Distance measurements at single-molecule resolution also should facilitate the study of complex reactions such as biopolymer folding. To this end, the denaturation of a DNA hairpin was examined by using single-pair FRET.


Figures
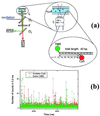
Figure 1
Figure 1
(a) Experimental setup for diffusion spFRET. L is the objective, D1 and D2 are dichroic mirrors centered at 530 and 630 nm, respectively, and F is a notch filter. (Inset) The DNA n constructs used for the FRET distance study. TMR is attached to one end of the DNA and CY5 is attached to the nth base from the end. (b) Dual (donor and acceptor) channel time traces for DNA 12 freely diffusing in solution. Fluorescence bursts above background are clearly visible as molecules traverse the laser beam. The conditions used were 30 pM DNA concentration, 0.6 mW, 514 nm laser light focused 10 μm into the solution from the coverslip surface and a 0.2-ms integration time.
Figure 2
Figure 2
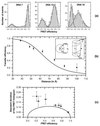
(a) FRET histograms extracted from time traces for DNAs 7, 12, and 19 using a threshold of 20. Double gaussian fits extract numbers for the mean (width) of the higher efficiency peak of 0.95 (0.05), 0.75 (0.13), and 0.38 (0.21) respectively. (b) Mean FRET efficiencies extracted from FRET histograms plotted as a function of distance for the seven DNA constructs, DNAs 7, 12, 14, 16, 19, 24, and 27. Distances are calculated by using the model shown in the Inset and discussed in Materials and Methods. The error bars represent two SDs (±1σ) from multiple measurements and increase with distance. The solid line is the theoretical curve with R0 = 65 Å for comparison. (c) Mean widths extracted from the histograms are plotted as a function of the mean FRET efficiencies. The x-axis error bars are the same as in b. The y-axis error bars represent two SDs (±1σ) from multiple measurements. The solid line shows widths calculated by using a simple model for the effect of shot noise, as described in the text.
Figure 3
Figure 3
FRET histogram of a 1:1 mixture of DNA 7 and 14 showing the separate subpopulations.
Figure 4
Figure 4
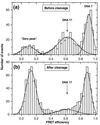
Restriction endonuclease cleavage of DNA. Histograms of a mixture of DNA 7 (no EcoRI site) and DNA 17 (with EcoRI site) before (a) and after (b) the cleavage reaction. The FRET peak corresponding to DNA 17 virtually disappears after the cleavage reaction, and there is a simultaneous increase in the “zero peak.”
Figure 5
Figure 5
DNA hairpin denaturation. The mean FRET efficiency and the widths as a function of urea concentration. (Inset) The donor-acceptor labeled haipin construct. The lines are visual guides for the data.

Similar articles

Cited by

References

    1. Basché T, Moerner W E, Orrit M, Wild U P, editors. Single-Molecule Optical Detection, Imaging, and Spectroscopy. Cambridge: Wiley; 1997.
    1. Nie S M, Zare R N. Annu Rev Biophys Biomol Struct. 1997;26:567–596. - PubMed
    1. Xie X S, Trautman J K. Annu Rev Phys Chem. 1998;49:441–480. - PubMed
    1. Lu H P, Xun L, Xie X S. Science. 1998;282:1877–1882. - PubMed
    1. Shera E B, Seitzinger N K, Davis L M, Keller R A, Soper S A. Chem Phys Lett. 1990;174:553–557.

Publication types

MeSH terms

LinkOut - more resources