Comparative Study
. 1999 Mar 30;96(7):3676-81.
doi: 10.1073/pnas.96.7.3676.

Comparing in vitro, in situ, and in vivo experimental data in a three-dimensional model of mammalian cochlear mechanics

Affiliations
Comparative Study

Comparing in vitro, in situ, and in vivo experimental data in a three-dimensional model of mammalian cochlear mechanics

P J Kolston. Proc Natl Acad Sci U S A. .

Abstract

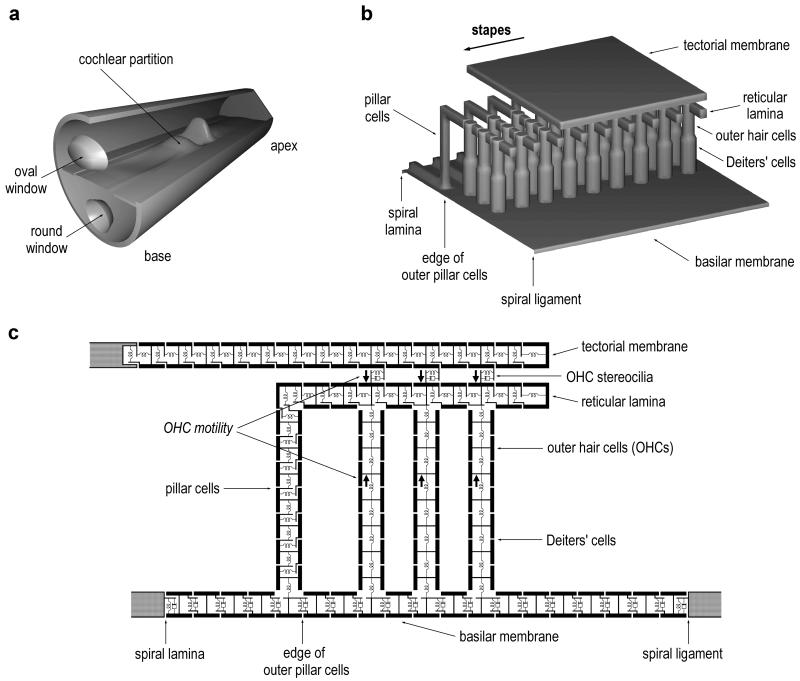
Normal mammalian hearing is refined by amplification of the motion of the cochlear partition. This partition, comprising the organ of Corti sandwiched between the basilar and tectorial membranes, contains the outer hair cells that are thought to drive this amplification process. Force generation by outer hair cells has been studied extensively in vitro and in situ, but, to understand cochlear amplification fully, it is necessary to characterize the role played by each of the components of the cochlear partition in vivo. Observations of cochlear partition motion in vivo are severely restricted by its inaccessibility and sensitivity to surgical trauma, so, for the present study, a computer model has been used to simulate the operation of the cochlea under different experimental conditions. In this model, which uniquely retains much of the three-dimensional complexity of the real cochlea, the motions of the basilar and tectorial membranes are fundamentally different during in situ- and in vivo-like conditions. Furthermore, enhanced outer hair cell force generation in vitro leads paradoxically to a decrease in the gain of the cochlear amplifier during sound stimulation to the model in vivo. These results suggest that it is not possible to extrapolate directly from experimental observations made in vitro and in situ to the normal operation of the intact organ in vivo.


Figures

Figure 1
Figure 1
(a) Schematic of the mammalian cochlea, shown unrolled and not to scale. The cochlea is a liquid-filled duct that is divided lengthwise into two chambers by the flexible cochlear partition. Sound stimulation is provided by the piston-like motion of the stapes bone in the oval window. This produces a wave of transverse motion on the partition that propagates from base to apex. (b) A short longitudinal segment of the cochlear partition, showing the organ of Corti sitting on top of the BM. The BM is composed of flexible protein fibers that span the cochlear duct from spiral lamina to spiral ligament. The overlying TM has been partially removed to reveal the tops of the OHCs and the reticular lamina. The pillars of Corti comprise two cells (outer and inner) in a triangular arrangement (shown here schematically). The foot of the inner pillar cell sits on the spiral lamina edge of the BM. The pillar cells couple vertical motion of the BM to radial shearing motion between the reticular lamina and the TM. (c) A single cross-section of the 3-DOC model, illustrating how the solid structures of the cochlear partition are each divided into several discrete (mass) elements, coupled (visco-)elastically to each other. The mass elements are 10 μm square. In addition to its axial stiffness, each model OHC produces a force acting in antiphase between its bottom and top that is controlled by the bending of its stereociliary bundle. All of the mass elements are surrounded by an inviscid, linear, and incompressible fluid; except for the TM, the density of the mass elements is the same as that of the fluid.
Figure 2
Figure 2
Response of the model BM during sound stimulation to the stapes (30 kHz), for three values of OHC motility. All panels show BM motion vs. stapes motion, on a linear scale. (a) Magnitude, no OHC motility. Motion peak occurs 2.5 mm from the base of the cochlea; there is also a smaller, secondary peak 3.9 mm from the base. The rotation of the pillar cells as a single unit about the spiral lamina is indicated by the linear increase in motion to the edge of the outer pillar cells (40 μm from spiral lamina). (b) Magnitude, normal OHC motility (330 pN/nm). Motion peak occurs 3.0 mm from the base, and the secondary peak is no longer present. Motion at the center of the membrane at the peak is ≈30 dB greater than that with no OHC motility. Motion near the base is unchanged. At each position from the base, motion across the BM width is now asymmetric. (c) Magnitude, enhanced OHC motility (560 pN/nm). Motion peak occurs 2.6 mm from the base. BM motion is less than that observed with normal OHC motility. The largest change occurs beneath the pillar cells, producing an exaggerated inflexion point at the edge of the outer pillar cells. (d) Phase, no OHC motility. Monotonic accumulation of phase with distance from the base exceeds 360°, which indicates the presence of a travelling wave. (e) Phase, normal OHC motility. There is now a difference in BM phase across its width. (f) Phase, enhanced OHC motility. There is a slightly enhanced phase variation across the width of the BM.
Figure 3
Figure 3
Motion of the model BM at the position of the peak during sound stimulation to the stapes (30 kHz), as a function of OHC motility (normalized relative to the optimum value of 330 pN/nm). The solid line shows the phase difference between motion at the edge of the outer pillar cells and beneath row three of the OHCs. The magnitude of the motion at these two positions—relative to that of the stapes—is shown by the dotted and dashed lines, respectively. Letters at the top of graph indicate the motility values used for Fig. 2 ac.
Figure 4
Figure 4
The real and imaginary components of the effective model BM impedance during sound stimulation to the stapes (30 kHz), for three values of OHC motility. (a) Imaginary component, no OHC motility. In basal regions, the imaginary component is stiffness-dominated (negative value), becoming mass-dominated (positive value) apical to the peak, indicating that true resonance occurs apical to the peak (because of the relatively large resistance). At each position from the base, the BM stiffness increases symmetrically to either side of a central minimum, consistent with simple stretching of the BM fibers because of a uniform hydrodynamic load. (b) Imaginary component, normal OHC motility. Small reduction in stiffness basal to the peak, and significant radial asymmetry. (c) Imaginary component, enhanced OHC motility. Further reduction in stiffness beneath the OHCs and pillar cells. Beneath the pillar cells, the position of resonance has moved significantly toward the base. (d) Real component, no OHC motility. The (positive) resistance value is approximately constant along the length of the model. (e) Real component, normal OHC motility. Dramatic changes in value basal to the peak, with a large increase beneath the pillar cells and negative values beneath the OHCs. (f) Real component, enhanced OHC motility. There is a further increase in resistance beneath the pillar cells, and the negative values beneath the OHCs are now smaller than those with normal motility.
Figure 5
Figure 5
Response of the model BM during localized stimulation (40 kHz, 50 pN) of motility in OHCs located 3.0 mm from the base (corresponding to the position of the motion peak during sound stimulation at 30 kHz; see Fig. 2b). Forward transduction in the OHCs throughout the model is switched on. (a) Phase. At the position of stimulation, the BM motions beneath the pillar cells and beneath the OHCs are in antiphase (i.e., a phase difference of 180°). (b) Magnitude. As during sound stimulation to the stapes, the pillar cells rotate as a rigid structural unit, but now the motion beneath the edge of the outer pillar cells is larger than at the center of BM, with a minimum occurring between these two regions.

References

    1. Cooper N P, Rhode W S. J Neurophysiol. 1997;78:261–270. - PubMed
    1. Khanna S M, Leonard D G B. Science. 1982;215:305–306. - PubMed
    1. Nuttall A L, Dolan D F, Avinash G. Hear Res. 1991;51:203–214. - PubMed
    1. Rhode W S. J Acoust Soc Am. 1971;49:1218–1231. - PubMed
    1. Robles L, Ruggero M, Rich N. J Acoust Soc Am. 1986;80:1364–1374. - PubMed

Publication types

LinkOut - more resources