

A logical analysis of T cell activation and anergy
- PMID: 10097134
- PMCID: PMC22391
- DOI: 10.1073/pnas.96.7.3894
A logical analysis of T cell activation and anergy
Abstract
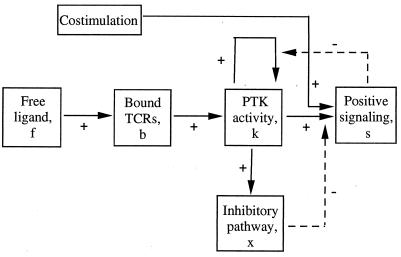
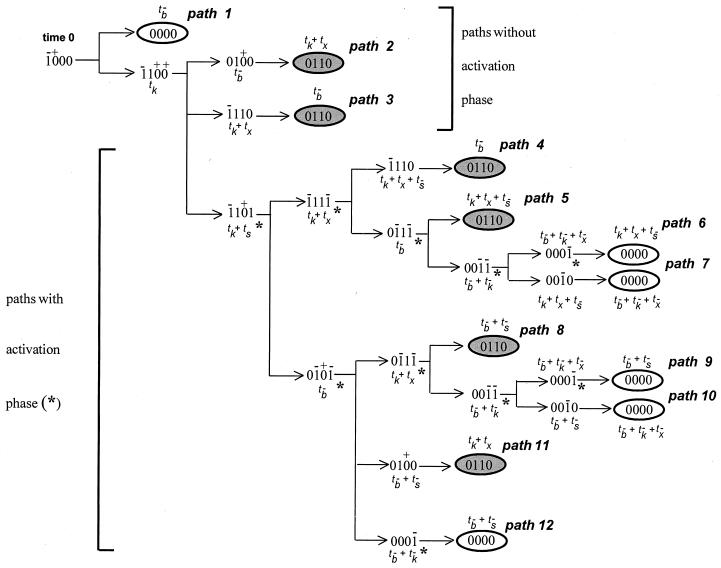
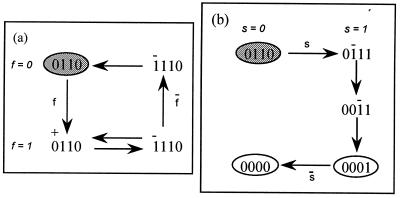
Interaction of the antigen-specific receptor of T lymphocytes with its antigenic ligand can lead either to cell activation or to a state of profound unresponsiveness (anergy). Although subtle changes in the nature of the ligand or of the antigen-presenting cell have been shown to affect the outcome of T cell receptor ligation, the mechanism by which the same receptor can induce alternative cellular responses is not completely understood. A model for explaining both positive (cell proliferation and cytokine production) and negative (anergy induction) signaling of T lymphocytes is described herein. This model relies on the autophosphorylative properties of the tyrosine kinases associated with the T cell receptor. One of its basic assumptions is that the kinase activity of these receptor-associated enzymes remains above background level after ligand removal and is responsible for cellular unresponsiveness. Using a simple Boolean formalism, we show how the timing of the binding and intracellular signal-transduction events can affect the properties of receptor signaling and determine the type of cellular response. The present approach integrates into a common framework a large body of experimental observations and allows specification of conditions leading to cellular activation or to anergy.
Figures
Similar articles
-
Prevention of T cell anergy by signaling through the gamma c chain of the IL-2 receptor.Science. 1994 Nov 11;266(5187):1039-42. doi: 10.1126/science.7973657. Science. 1994. PMID: 7973657
-
Partial T cell signaling: altered phospho-zeta and lack of zap70 recruitment in APL-induced T cell anergy.Cell. 1994 Dec 2;79(5):913-22. doi: 10.1016/0092-8674(94)90080-9. Cell. 1994. PMID: 8001128
-
T cell anergy and costimulation.Immunol Rev. 2003 Apr;192:161-80. doi: 10.1034/j.1600-065x.2003.00009.x. Immunol Rev. 2003. PMID: 12670403 Review.
-
A model for antigen-induced T cell unresponsiveness based on autophosphorylative protein tyrosine kinase activity.Int Immunol. 1996 Apr;8(4):613-24. doi: 10.1093/intimm/8.4.613. Int Immunol. 1996. PMID: 8671649
-
T-cell activation through the antigen receptor. Part 2: role of signaling cascades in T-cell differentiation, anergy, immune senescence, and development of immunotherapy.J Allergy Clin Immunol. 2002 Jun;109(6):901-15. doi: 10.1067/mai.2002.124965. J Allergy Clin Immunol. 2002. PMID: 12063516 Review.
Cited by
-
Computational Verification of Large Logical Models-Application to the Prediction of T Cell Response to Checkpoint Inhibitors.Front Physiol. 2020 Sep 30;11:558606. doi: 10.3389/fphys.2020.558606. eCollection 2020. Front Physiol. 2020. PMID: 33101049 Free PMC article.
-
Combined logical and data-driven models for linking signalling pathways to cellular response.BMC Syst Biol. 2011 Jul 5;5:107. doi: 10.1186/1752-0509-5-107. BMC Syst Biol. 2011. PMID: 21729292 Free PMC article.
-
A methodology for the structural and functional analysis of signaling and regulatory networks.BMC Bioinformatics. 2006 Feb 7;7:56. doi: 10.1186/1471-2105-7-56. BMC Bioinformatics. 2006. PMID: 16464248 Free PMC article.
-
Understanding the Dynamics of T-Cell Activation in Health and Disease Through the Lens of Computational Modeling.JCO Clin Cancer Inform. 2019 Jan;3:1-8. doi: 10.1200/CCI.18.00057. JCO Clin Cancer Inform. 2019. PMID: 30689404 Free PMC article. Review.
-
Digital clocks: simple Boolean models can quantitatively describe circadian systems.J R Soc Interface. 2012 Sep 7;9(74):2365-82. doi: 10.1098/rsif.2012.0080. Epub 2012 Apr 12. J R Soc Interface. 2012. PMID: 22499125 Free PMC article.
References
-
- Sloan-Lancaster J, Evavold B D, Allen P M. Nature (London) 1993;363:156–159. - PubMed
-
- Jameson S C, Bevan M J. Immunity. 1995;2:1–11. - PubMed
-
- Rabinowitz J D, Beeson C, Wülfing C, Tate K, Allen P M, Davis M M, McConnell H M. Immunity. 1996;5:125–135. - PubMed
-
- DeSilva D R, Urdahl K B, Jenkins M. J Immunol. 1991;147:3261–3267. - PubMed
Publication types
MeSH terms
Substances
LinkOut - more resources
Full Text Sources
